Upswing in cement in Spain
 IMF, WEO 2016
 CEPCO
CEPCO
 CEPCO
CEPCO
 Oficemen, OneStone Research
 Oficemen, OneStone Research
 Oficemen
 Oficemen
 Oficemen, OneStone Research
 CEPCO, OneStone Research
 CEPCO
CEPCO
 Cemex
Cemex
 Cemex
Cemex
 CPV
CPV
 OneStone Consulting
 LafargeHolcim
 Italcementi
 Votorantim
 OneStone Consulting
 Oficemen
 OneStone Consulting
As Spain’s construction and real estate sectors start to recover from seven years of recession cement demand shows some upswing. However the downturn of the cement industry was so large that it will take many years and special programs to reach even 60 % of pre-crisis production levels.
1 Introduction
In 2015 Spain’s economy expanded by 3.2 %, which significantly outperforms growth in the Euro Area. The economic growth is robust, driven by domestic demand, positive labor market developments, improved access to credit for companies and households and a low oil price. Private consumption expenditure increased from 1.2 % to 3.1 % in 2015. At the same time the high unemployment rate declined from 24.4 % to 22.1 % (20.9 % in 4.Q), although youth unemployment (under 25) is still scandalously high at 45.5 % compared to 19.4 % on average in the EU and only 6.9 % in Germany. The...
1 Introduction
In 2015 Spain’s economy expanded by 3.2 %, which significantly outperforms growth in the Euro Area. The economic growth is robust, driven by domestic demand, positive labor market developments, improved access to credit for companies and households and a low oil price. Private consumption expenditure increased from 1.2 % to 3.1 % in 2015. At the same time the high unemployment rate declined from 24.4 % to 22.1 % (20.9 % in 4.Q), although youth unemployment (under 25) is still scandalously high at 45.5 % compared to 19.4 % on average in the EU and only 6.9 % in Germany. The full-year deficit narrowed from 5.9 % of GDP in 2014 to 5.1 % in 2015. However in the 1.Q 2016 GDP growth lost some momentum and Spain’s second general election within six months brings more uncertainty.
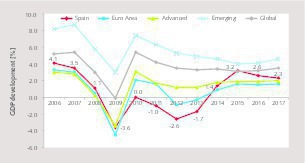
In the last ten years Spain’s GDP growth always outperformed the Euro area, in both positive and negative ways. In 2006 Spain with 4.1 % had a larger GDP growth than the Euro Area at 3.3 % (Figure 1). This trend continued until 2008, however in 2009 negative growth in the Euro Area was -4.5 %, larger than Spain at -3.6 %. From 2010 to 2013 the Spanish economy further declined, while the economy in the Euro Area more or less expanded. However, since 2014 Spain again leads the growth in the Euro Area. The International Monetary Fund (IMF) predicts in its latest World Economic Outlook (WEO) from April 2016 that the momentum in Spain’s GDP will decline, mostly due to the deceleration of private consumption. However, a growth of 2.6 % is projected for 2016 and 2.3 % in 2017.
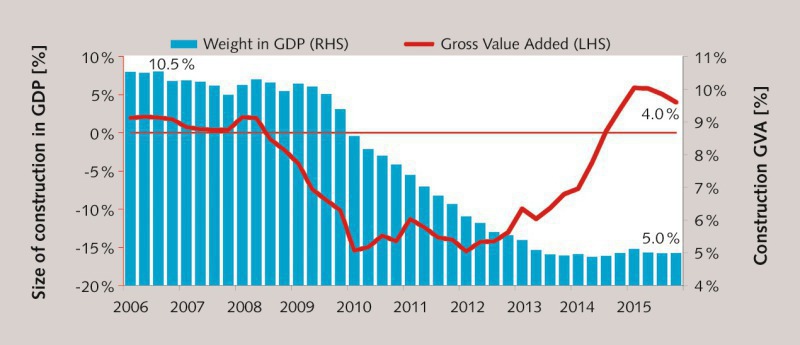
Figure 2 shows that Spain’s construction industry massively declined from 2.H of 2008 until 2013. While the size of the construction industry in Spain’s economy was 10.5 % in 2006 and still 10.3 % in 1.H 2008 it declined to only 4.9 % by the end of 2013. The year-on-year (YoY) drop in construction was largest from 2010 to 2012. What happened? After Spain joined the Euro, the country experienced a boom, supported by a real estate and property bubble, financed by cheap loans to builders and homebuyers. House prices rose almost 45 % in the five years up to 2008. Since the bubble burst until the end of 2013 property prices dropped by more than a third, on average, in Spain. Although from 2014 on prices increased slightly.
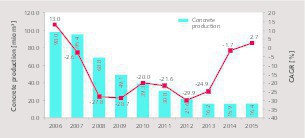
The development of concrete production is a good indicator for the cement demand in Spain. In 2006 concrete production increased by 13 % to almost 100 million m³ (Figure 3). In 2007, there was the first decline of 2.6 %, after a steady increase since the year 2000, when 64.4 million m³ of concrete were produced. In 2008 production declined by a massive 27.8 % to 68.8 million m³. And, after 2008 production further declined every year by about 20-30 % until 2013, when 16.2 million m³ were produced. Production bottomed out in 2014 and 2015 was the first year with a slight increase of 2.7 % after the housing bubble burst. In 2015 in Spain 45 152 houses were completed, compared to 641 419 in 2007. Nevertheless, there is now a significant increase in the number of housing starts with 49 695 in 2015 after 34 873 in 2014.
2 Cement market development
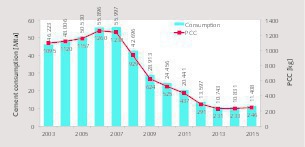
Until 2007 Spain had the second highest per capita cement consumption (PCC) in Europe, after Cyprus [1]. In 2007 Spain’s PCC stood at 1238 kg and cement consumption was 55.997 million t (Mta) (Figure 4). Cement demand declined for six consecutive years and bottomed out in 2013 with 10.743 Mta, which corresponds to a reduction of almost 81 %. The PCC declined from 1238 kg to only 231 kg, which is significantly below the average PPC in W.-Europe, which is about 300 kg. In 2014 there was a slight increase in demand to 10.831 Mta (+0.8 %) and the PCC rose to 233 kg. In 2015 cement demand increased by 5.3 % to 11.408 Mta and a PCC of 246 kg. In the 1.Q 2016 consumption declined by 0.5 % YoY, dropping to 2.566 Mta, which is about 12 000 t less than the year before. Demand had stagnated.
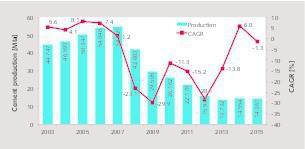
Figure 5 shows cement production and compound annual growth rate (CAGR) of production from 2003 to 2015. Cement production was highest in 2007 with 54.721 Mta, growing from 44.747 Mta in 2003. Highest CAGR was in 2005 with 8.1 %. In 2008 production declined by 23.1 % and in the following year by an even higher 29.9 %. In 2010 the decline slowed down to -11.3 %, while 2012 saw again a huge decline of 28.1 %. In 2013 cement production bottomed out with 13.732 Mta, which is a decline of 74.9 % from 2007 and is a little better than the decline in the cement demand. How much production is influenced by exports can be seen in 2014 and 2015 when cement production first increased by 6 % and than declined by 1.3 %, while cement consumption increased by 0.5 % and 5.3 % respectively.
3 Import and export development
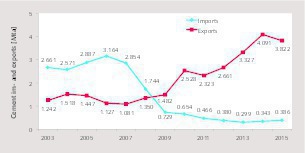
Until 2007 Spain was the largest cement importer in W.-Europe. Figure 6 illustrates the development of cement imports and exports from 2003 to 2015. With the reduction in demand in 2007 imports also declined from 2.854 Mta to 1.744 Mta in 2008. However, although Spain has enough cement production capacity there were still relatively large imports until 2011. Imports were lowest in 2013 and are just beginning to increase now. Until 2008 Spain was an average cement exporter with 1.350 Mta or just 3.2 % of production. From 2009 on exports significantly increased to 4.091 Mta in 2014, which makes up 28.1 % of production. Nevertheless in 2015 exports decreased by 6.6 %, but still made up 26.6 % of the cement production.
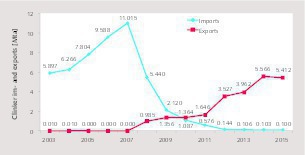
The development of Spain’s clinker imports and exports are illustrated in Figure 7. Imports nearly doubled from 5.897 Mta in 2003 to 11.015 Mta in 2007, while exports during that time were almost zero. With the cement crisis in 2008 imports abruptly declined by 50.6 % to 5.44 Mta and in 2009 by another 61.0 % to 2.12 Mta. In 2015 clinker imports stood at 0.10 Mta. It is hard to understand, why clinker imports were still relatively high in 2008 and 2009, when compared to cement imports. There was enough clinker production capacity available locally. The main reasons could be that import contracts could not be terminated and/or that imported clinker was still competitive. However, Spain’s cement industry had to expand the clinker exports and in 2014 these exports peaked at 5.566 Mta. However 2015 saw a decline of 3.0 %.
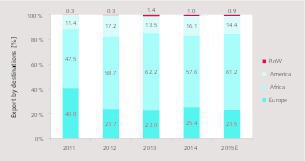
Figure 8 shows the main destinations of the cement and clinker exports in the last few years. Most of the exports, more than 80 %, go to Africa and Europe. However, the share in Europe declined from 40.8 % in 2011 to an estimated 23.5 % in 2015, while the share in Africa increased from 47.5 % in 2011 to an estimated 61.2 % in 2015. In Europe in 2014 almost 99 % went to countries of the EU and only 1 % to non-EU countries. In Africa, North-Africa took about 39 %, while Sub-Saharan Africa took more than 61 %. In the Americas, Latin America took 95 % and USA/Canada 5 %. The Rest of the World (RoW) comprises Asia and the Middle East, of which the Middle East was responsible for taking 98 %. The crisis forced many cement producers to improve their marketing to achieve exports. There is a lot of theory on how to develop an export market, and a few lessons created a better understanding of export markets. One such lesson was that each export destination is different.
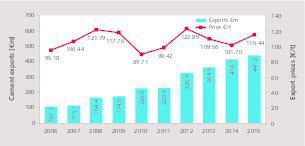
Figure 9 shows the export income of the cement producers and the average export prices achieved for Spain. It can be seen that the export income increased fourfold from 107.3 million € in 2006 to 441.2 million € in 2015. In 2008 and 2009 there were only slight increases, showing that the cement producers needed time to react to the new situation and to look after new markets. Another push was in 2010 as well as in 2012. The average prices achieved were about 107.9 €/t, but they were not constant at all, and varied between 89.71 €/t in 2010 to 122.85 €/t in 2012. In 2015 the prices achieved were slightly better and increased by 13.5 %, which suggests that cement exports declined in that year.
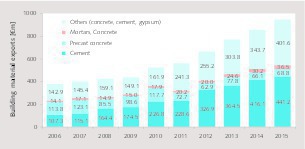
Spain’s grey cement exports in the context of other building material exports are illustrated in Figure 10. Listed are the grey cement exports and exports of precast concrete, mortars/concrete as well as other kinds of concrete, cement (white cement) and gypsum. In 2006 grey cement exports had a share of 28.4 %, while precast concrete had a share of 30.1 % and all others 41.5 %. In 2015 the share of the grey cement exports climbed to 46.5 %, while precast concrete decreased to 7.3 %. The export statistics by CEPCO (Confederación Española de Asociaciones de Fabricantes de Productos de Construcción) show that the official figures for the Spanish per capita cement consumption (PCC) have to be adjusted, because a significant amount of cement, which is consumed in Spain, is exported with other products.
4 Cement producer highlights
The cement market in Spain is fragmented [2]. There are nine companies with 35 plants producing clinker and cement. In five of the plants white cement is produced. Furthermore there are four separate grinding plants. These plants combine 30.6 Mta grey clinker capacity and 41.0 Mta grey cement capacity (2015 data). With a clinker and cement production of 16.8 Mta and 14.4 Mta, respectively, the utilization rates are about 55 % and 35 %, respectively. As a result of the low capacity utilization rates some plants have been closed, idled or only run for half a year. For example, in Catalonia of the six foremost cement plants, only three are operating today. The cement companies try to do their best to keep the operating costs down. However, in 2014 only 23.1 % of fossil fuels were substituted by alternative fuels. This is one of the lowest percentages of cement producers in Europe. European benchmarks are the Netherlands with 85 % alternative fuels and Germany with 63 %.
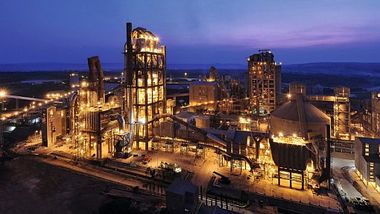
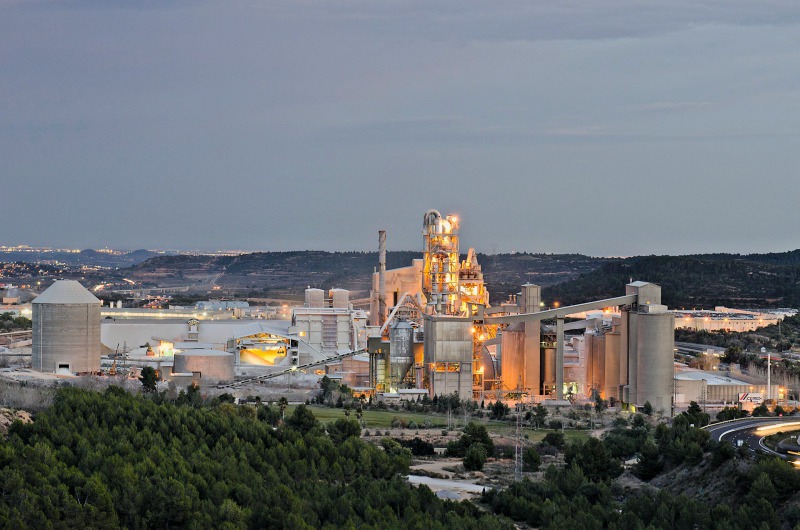
Table 1 shows the cement producers and their capacities at the end of 2015. Cemex is the leading producer with 10.7 Mta capacity from seven integrated plants and two separate grinding plants. The two largest Cemex plants in Spain are those in Alcanar with 2.2 Mta capacity and the one in Bunol (Figure 11) with 2.05 Mta capacity. Bunol is Cemex’ only white cement production plant with 0.69 Mta capacity, as a result of the cement production in Alicante (Figure 12) being completely switched from white to grey. The new plant in Teruel, which should have started operating in 2009 is now idle and up for sale. As part of a number of asset transactions with Holcim, Cemex acquired the Gador cement plant (0.85 Mta) and the Yeles cement grinding plant (0.9 Mta). According to Cemex with these assets in 2015 the cement volume in Spain increased by 35 %, while the “like for like” (LFL) volume decreased by 9 %.
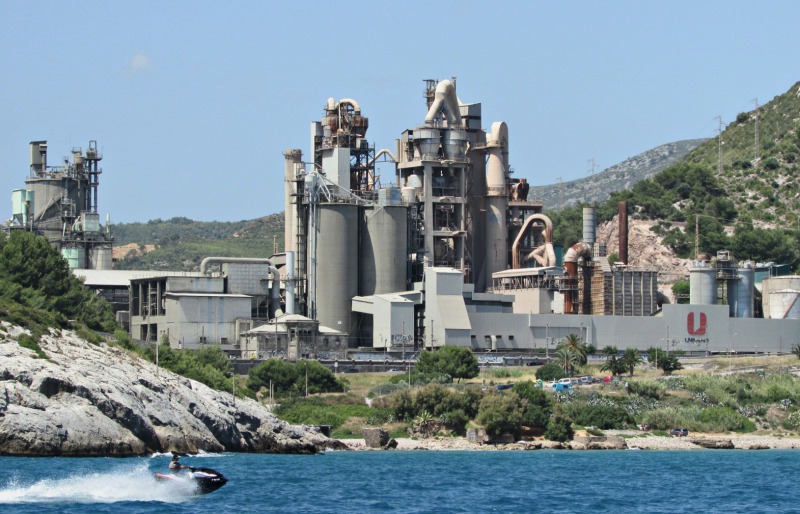
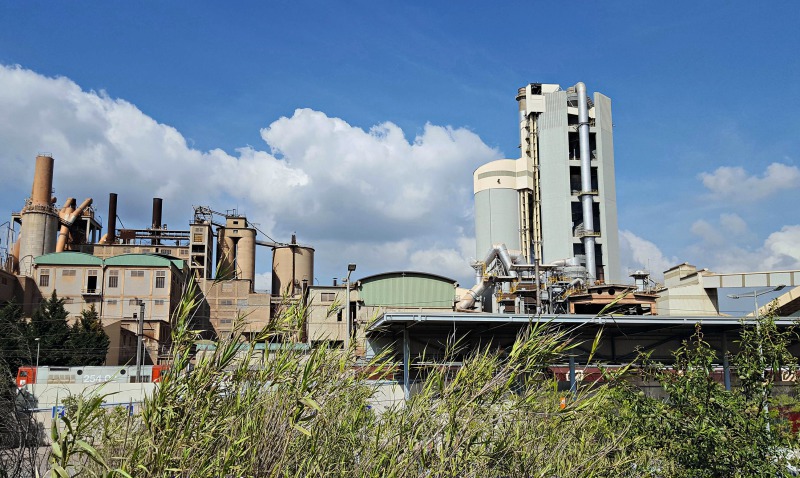
No. 2 in capacity ranking in Spain is CPV (Cementos Portland Valderrivas). The company operates six integrated plants El Alto, Hontaria, Olazagutia, Santa Margarida i.e. Monjos, Alcala de Guadaira and Mataporquera. El Alto (Figure 13) is the largest with a grey cement capacity of 2.8 Mta and a white capacity of 0.31 Mta. The plant in Mataporquera is operated by Cementos Alpha, which is part of the CPV Group, who also have cement assets in the USA, Tunisia and the UK. Beside the six plants in Spain, already mentioned here, there is also the Vallcarca plant (Figure 14), which is close to Barcelona and which has its own marine terminal. However, the plant was shut-down in 2012 and is now idle. CPV suffers from a relatively low capacity utilization. In 2014, about 3.9 Mta of cement and clinker were sold, 2.6 Mta in the domestic market and 1.3 were exports, resulting in a cement capacity utilization rate below 30 %.
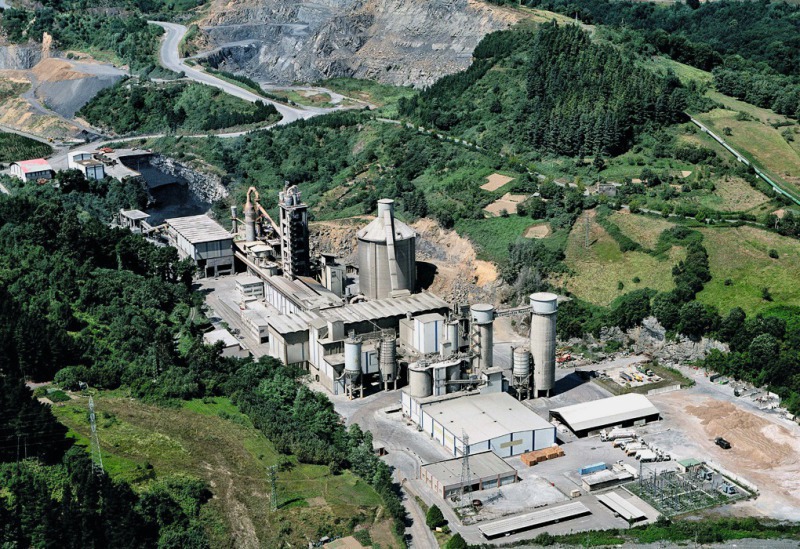
LafargeHolcim is no. 3 in the market after the merger last year and despite the sale of two plants to Cemex. The company operates the five cement plants Jerez de la Frontera, Carboneras, Montcada i Reixac (Barcelona, Figure 15), Sagunto and Villaluenga de la Sagra, giving them a cement capacity of 5.7 Mta. In the Sagunto plant white and grey cement are produced. The domestic cement volumes were up by 15.1 %, LFL, while the exports declined. Next in the capacity ranking is Cementos Tudela Veguin, who operate two grey cement plants (3.9 Mta) and one white cement plant (0.2 Mta). In 2008 the company stopped three wet process kilns with a combined capacity of 1450 t/d, due to the low cement demand. Tudela Veguin is substituting about 24 % of clinker in cement with the use of fly ash, granulated blast furnace slag (GBFS), limestone and gypsum, which allows them to produce a wide variety of blended cements.
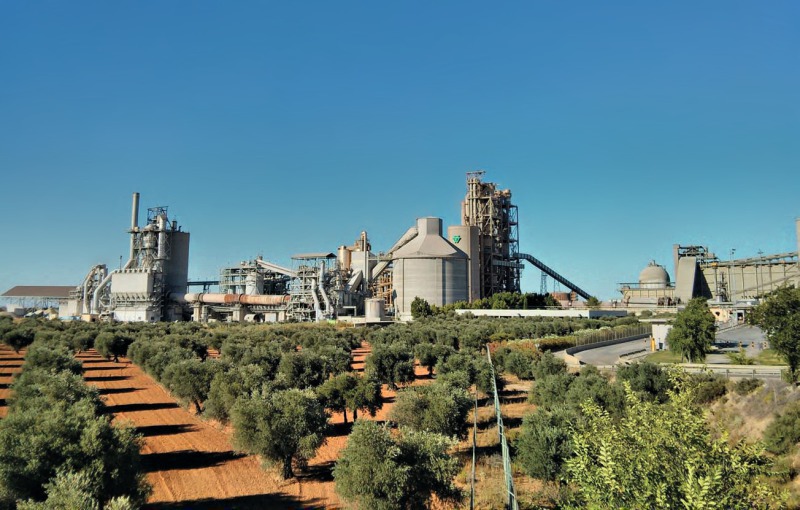
FYM (Sociedad Financiera y Minera), which is part of the Italcementi Group, has a cement capacity of 3.2 Mta from the three plants in Anorga (San Sebastian), Arrigorriaga-Bilbao (Figure 16) and Malaga. The revamping of the Malaga plant, a few years ago, is the biggest ever investment in Malaga, and especially designed to meet environmental requirements and implement BAT (Best Available Technologies). In 2015 FYM’s cement and clinker sales were down by 2.8 %, due to lower export volumes. Corporacion Noroeste (Cementos Cosmos), which is part of the Votorantim Group also has a cement capacity of 3.2 Mta. The company, which was formed following the exchange of assets of Cimpor with Camargo Correa in 2012, operates the four integrated plants Toral de los Vados (Figure 17), Oural, Cordoba and Niebla and a grinding plant in Santa Cruz de Tenerife. Due to improving market conditions the Cordoba plant was restarted after having been left idle.
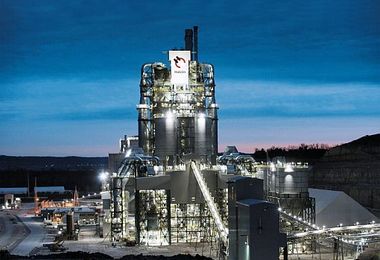
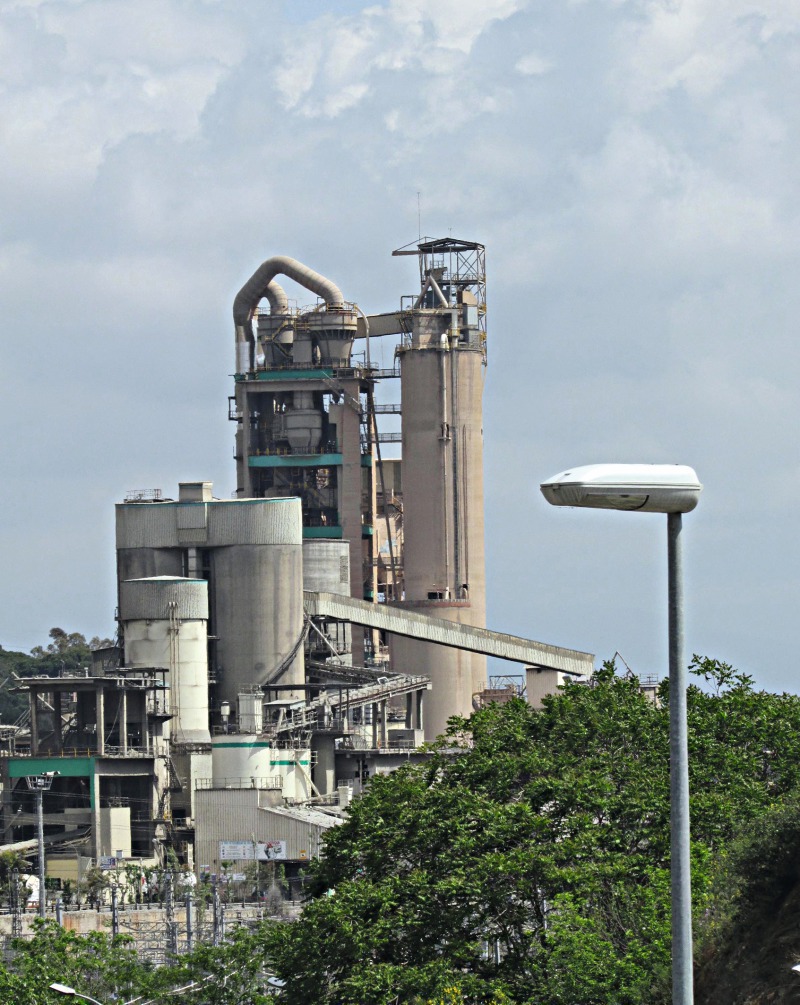
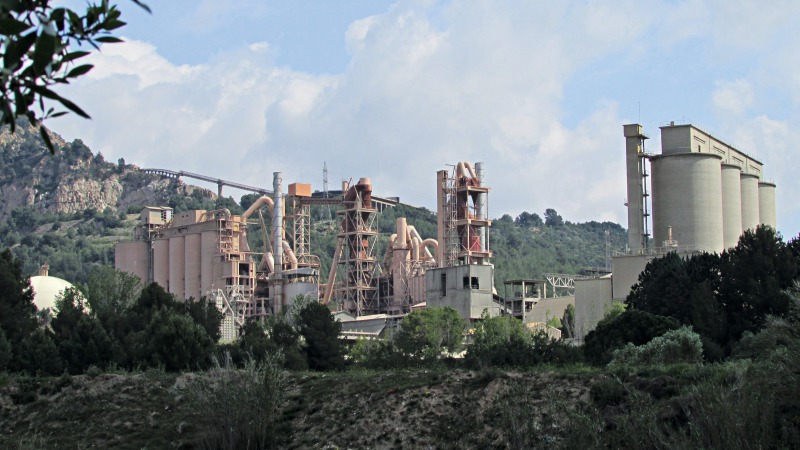
The final three places are held by the three other companies Cementos Molins, Cementos Balboa and Cementos Lemona, with 1.6 Mta, 1.6 Mta and 1.3 Mta capacity, respectively. Cementos Molins made a new 4100 t/d production line (Figure 18) operational in 2010 in St. Vicenc des Horts (Barcelona) as a replacement for three older lines. In 2013, the company acquired the cement production and commercial activities of the mothballed 0.9 Mta Cemex facility at Sant Feliu de Llobregat (lead picture), Barcelona, without restarting production. The profits rose 65 % in 2015, due to higher sales mainly by the cement assets in Mexico and Argentina. Cementos Balboa is the only cement producer in Extremadura, owned by the Alfonso Gallardo Group. In 2013 it was reported that production was stopped due to the “exorbitant” high electricity prices. The other producer, Cementos Lemona, is part of the CRH Group.
5 Market outlook
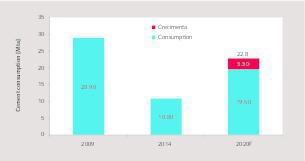
Oficemen, the Spanish Cement Producer Association, recently introduced an ambitious plan to achieve a stable cement production of 30 Mta by 2020. This means, in practice, doubling the current consumption levels and keeping the high export rates. The plan was introduced in November 2015 under the name “Crecimenta 20.30” [3] and foresees an additional consumption of 3.3 Mta in addition to the consumption growth under the “BAU” (Business as Usual) scenario (Figure 19). The year 2009 is taken as a reference point with 27.2 Mta consumption, although official statistics show a consumption of 28.913 Mta. However, in the plan for the BAU scenario an annual consumption growth (CAGR) of 10.4 % is anticipated while for the Crecimenta scenario a CAGR of 13.3 % is anticipated. According to the plan the proposals will result in nearly 7000 new jobs and an added value of 1.4 bn € to the economy.
The main assumptions for the plan are an average growth rate of 2.1 % for the economy between 2015 and 2020, investment in public works of 15 bn € in 2020 (equivalent to 1.3 % of GDP), 145 000 housing starts in 2020, 5.8 million m² construction in the non-residential sector in 2020 (equivalent to 3 % average growth between 2015 and 2020), a much higher cement consumption in road construction (based on 40 % savings in maintenance costs and conservation through rehabilitation, compared to asphalt), higher consumption in railway construction (based on 52 % savings in maintenance costs of slab track compared to ballasted track), and finally a gross value added in the cement sector of 35 % of turnover. The plan for the revitalization of the sector includes 25 measures, which starts with internal measures by the cement industry to overcome deficits.
However, there are more and more experts, who think significant structural moves in developed cement markets are highly unlikely in the future. Cycles will continue as always, but cement consumption levels are settling at a sustainable per capita consumption. HeidelbergCement and Italcementi, respectively are projecting a CAGR of 5.2 % for the cement consumption in Spain, which leads to 11.9 Mta in 2016 and 12.5 Mta in 2017. This is very different to the Crecimenta projections of 10.4 % under business as usual and 13.3 % in their optimistic scenario. The political situation is also not encouraging at the moment. In the second general election within six months again no party secured the majority with the danger that the period of uncertainty will be prolonged and the endless dispute with Catalonia about independence will also need to be resolved ultimately.
Überschrift Bezahlschranke (EN)
tab ZKG KOMBI EN
This is a trial offer for programming testing only. It does not entitle you to a valid subscription and is intended purely for testing purposes. Please do not follow this process.
This is a trial offer for programming testing only. It does not entitle you to a valid subscription and is intended purely for testing purposes. Please do not follow this process.
tab ZKG KOMBI Study test
This is a trial offer for programming testing only. It does not entitle you to a valid subscription and is intended purely for testing purposes. Please do not follow this process.
This is a trial offer for programming testing only. It does not entitle you to a valid subscription and is intended purely for testing purposes. Please do not follow this process.