The global cement capacity development
 OneStone Consulting
 OneStone Consulting
 OneStone Consulting
 OneStone Consulting
 OneStone Consulting
 LafargeHolcim
 OneStone Consulting
 OneStone Consulting
 HeidelbergCement
 OneStone Consulting
 Italcementi
 OneStone Consulting
 LafargeHolcim
 Vicat
Vicat
 Semen Indonesia
 OneStone Consulting
![17 New contracted kiln capacity [4]](https://www.zkg-online.info/imgs/101551383_c6f7791106.jpg) OneStone Consulting [4]
OneStone Consulting [4]
![18 Major kiln sizes of contracted capacity [4]](https://www.zkg-online.info/imgs/101551424_4bf514eddb.jpg) OneStone Consulting [4]
OneStone Consulting [4]
 HeidelbergCement
On a global level significant cement overcapacity and low utilization rates are now an issue, resulting in a lack of investment in new capacity. This article provides an overview about the latest trends in cement capacities and the utilization rates of major producers/countries and how this affects newly contracted capacity.
1 Introduction
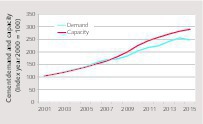
Cement capacities are growing faster than demand [1]. Figure 1 shows the global development since 2001. Up to 2007 cement demand was growing faster than capacity, because the demand growth was higher than expected and new capacity needed at least two years to become operational. With the delay in investment decisions, newly contracted capacity peaked when the global financial crisis started and the demand in developed markets in the Americas and Europe rapidly declined. In China newly contracted capacity peaked in 2010. In Africa, India and Brazil huge capacity expansions started...
1 Introduction
Cement capacities are growing faster than demand [1]. Figure 1 shows the global development since 2001. Up to 2007 cement demand was growing faster than capacity, because the demand growth was higher than expected and new capacity needed at least two years to become operational. With the delay in investment decisions, newly contracted capacity peaked when the global financial crisis started and the demand in developed markets in the Americas and Europe rapidly declined. In China newly contracted capacity peaked in 2010. In Africa, India and Brazil huge capacity expansions started after 2010, although a few years later there was only moderate growth and even a decline in cement demand. Now the gap between capacity and demand is further increasing because of the shrinking demand in China since last year.
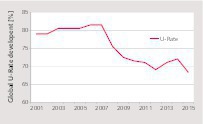
The development of capacity utilization rates is illustrated in Figure 2. In 2001 the global cement capacity utilization rate (U-Rate) was below 80 %. Up to 2008 the slow growth in capacity expansion and with the huge demand growth the U-Rate improved to 82 %. But since then the U-Rate has declined. Last year the global cement demand stood at 4100 million t (Mta), while cement capacity was almost 6000 Mta, resulting in a global average capacity utilization of 68.3 %. In Europe the capacity utilization stands at about 60 %. A further consolidation and eventual closing of plants is expected here, if the demand does not significantly improve. Low capacity utilization rates are unhealthy for most of the cement producers. The targeted figures are 75 % or above. Decisions for new capacity are closely linked to the U-Rate and the supply/demand situation in local markets.
2 Capacity development of major producers
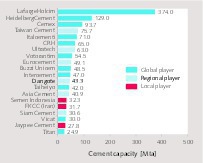
Figure 3 shows the capacity ranking of the TOP 20 cement producers (2014/15 data), excl. Chinese companies. After its merger LafargeHolcim is the undisputed truly global leader with 374 Mta capacity from plants in about 60 countries. Second in ranking is HeidelbergCement with 129 Mta capacity from 34 countries. They will complete the takeover of Italcementi (71 Mta capacity) this year. The list of the TOP 20 cement companies has changed a lot in the last few years. Foremost local players such as Taiwan Cement, Ultratech, Eurocement, Dangote, Asia Cement or Siam Cement have become regional players, foremost regional players such as Votorantim and Intercement have become global players. Today the TOP 20 have about 1375 Mta of cement capacity.
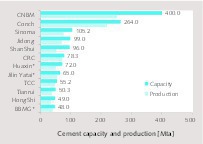
The TOP 12 cement producers in China, which receive support from the Chinese Government, already have 1382 Mta capacity (Figure 4, 2014 data), which is slightly more than the capacity of the “Global” TOP 20. CNBM is the market leader in China with more than 400 Mta capacity, followed by Anhui Conch (264 Mta) and Sinoma (105 Mta). BBMG, the no. 12 in the Chinese capacity ranking has almost 50 Mta capacity. The average capacity utilization rate of the TOP 12 was 72.0 % in 2014. With the huge cement demand decline in China (-120 Mta from 2014 to 2015) the U-Rates in China as well as the cement prices will be under more pressure. ShanShui Cement, the no. 5 in the Chinese capacity ranking, reported massive financial problems and is now a candidate for acquisition.
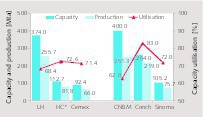
Figure 5 gives an indication of the capacity utilization rates of the Global TOP 3 (2015 data) and the TOP 3 producers in China (2014 data). Almost all producers suffer from relatively low capacity utilization rates. Global market leader LafargeHolcim achieved with a cement production of 255.7 Mta a U-Rate of 68.4 %, which is very close to the global level. HeidelbergCement achieved a U-Rate of 72.6 %, however the production figure of 81.8 Mta includes clinker sales. Cemex increased its U‑Rate to 71.4 %. CNBM only achieved a U-Rate of 62.8 % in 2014, Sinoma with 72 % is at the same level as HeidelbergCement and Cemex, while Anhui Conch is with a U-Rate of 83 % the market leader in this comparison. Accordingly there is plenty of “free” capacity to capture demand growth and capacity expansion programs are limited.
With less capacity expansion the foremost TOP 10 global players such as Lafarge, Holcim, HeidelbergCement, Cemex, Italcementi, Buzzi Unicem, CRH, Taiheiyo, Vicat and Titan have lost influence in emerging markets. With less cash to invest and increasing asset disposals due to net debt concerns, expansion by the majors was only moderate. After the Asian Crisis they were able to increase their market share to more than 80 %, worldwide, excluding China. Now their market share outside China has declined to about 64 %. Emerging market competitors challenged the leadership of the majors in emerging markets. Such competitors include new market entrants, who are willing to invest in new plants with the latest technology and higher efficiency to push the more established producers with older plants out of the market.
3 Capacity utilization of major producers
by world regions
With the trend to lower U-Rates gross margins of the cement producers have come under pressure and the improvement of capacity utilization rates has become a major issue. However the U‑Rates depend on a number of parameters, such as demand, imports, exports and capacities. Accordingly not only the average U-Rates of the companies are different accordingly to their country portfolio, but also within a country the U-Rates of individual companies are very different, one reason is the location of the plants in relation to the main cement consuming areas, but the distribution and cement price policy as well as the trading network of the companies is important. In the following section of this report the regional U-Rates of the leading companies are given.
3.1 LafargeHolcim
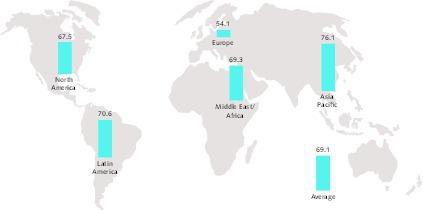
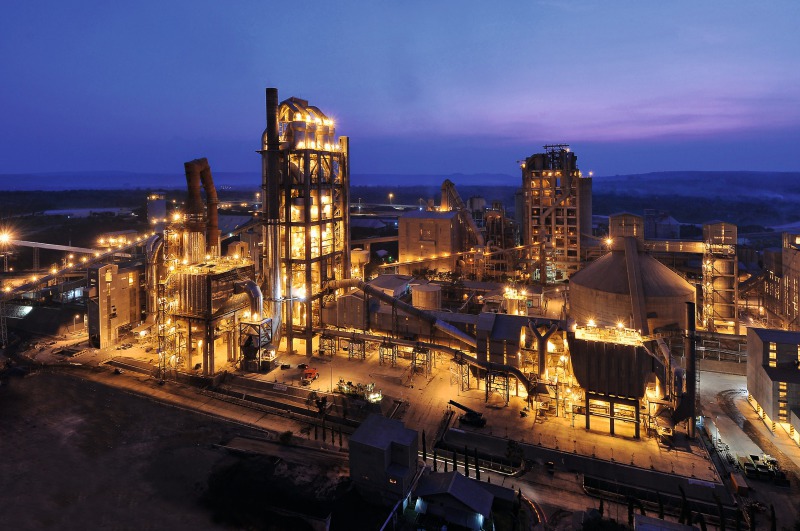
LafargeHolcim operates a total of 239 integrated and grinding plants in almost 60 countries around the world, with a cement capacity of 374 Mta. Largest capacities are in India (68.2 Mta), China (37.8 Mta), the USA (25.9 Mta), Indonesia (15.2 Mta), Mexico (12.2 Mta, Figure 6), Russia (10.6 Mta), Algeria (10.6 Mta), France (10.2 Mta) and Malaysia (10.1 Mta). In 2015 the group produced 255.7 Mta of cement, which led to an average utilization rate of 68.4 %. Figure 7 shows how the U-Rate performs regionally. The average U-Rate in this context is 69.1 %, because 2.6 Mta of inter-regional trading volume has not been allocated and is added to the production quantity. The highest U‑Rate has been achieved in Asia with 76 %, the lowest in Europe with only 54 %. The U‑Rate in North America is relative low with 67.5 %, while Latin America and the Middle East/Africa are slightly above the regional averages.
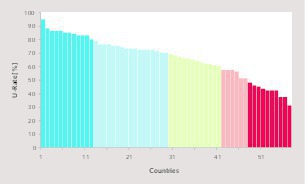
In Figure 8 the U-Rate of LafargeHolcim is given on a country base. The data relates to the year 2014. The highest U-rate that has been achieved is 95 %, while the lowest is only 31 %, which cannot be operated economically. The LafargeHolcim target is a U-Rate of 85 %. This has only been achieved in seven countries. Six other countries were between 80 to < 85 %. The majority of countries achieved U‑Rates of 70 to 79 %. The U-rate of 12 countries was between 60 and 69 %, which is about 25 % below the target. In 16 countries the U-Rate was below 60 %, ten of them were even below 50 %.
If future demand growth is in those countries with a low capacity utilization, then the company has headroom to grow with market momentum. If the future growth is in countries with high utilization rates, then the company will have to make a decision about further expansion.
3. 2 HeidelbergCement
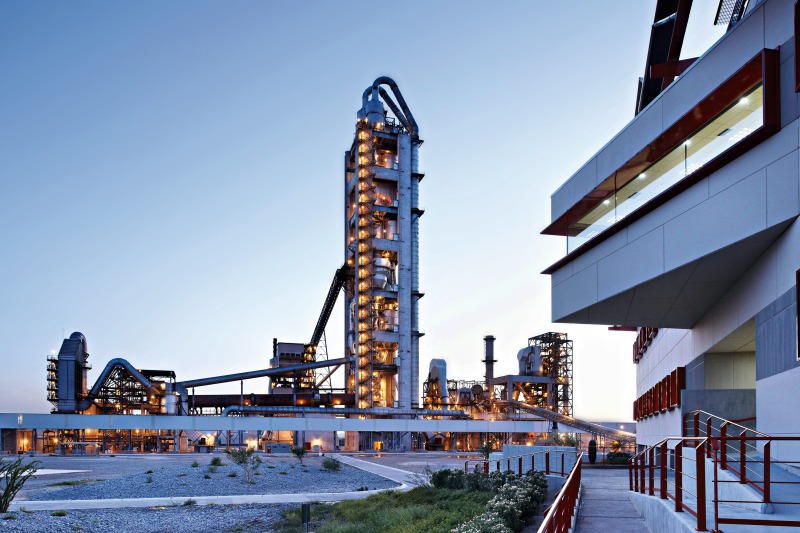
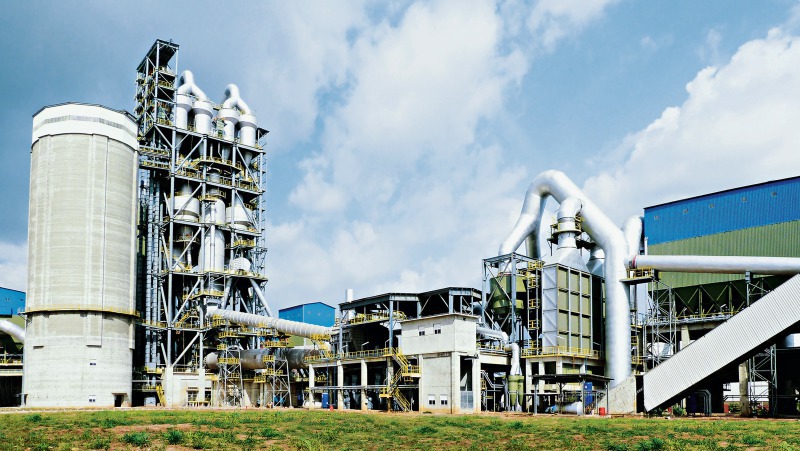
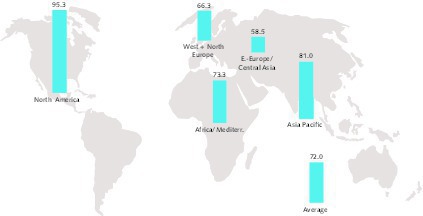
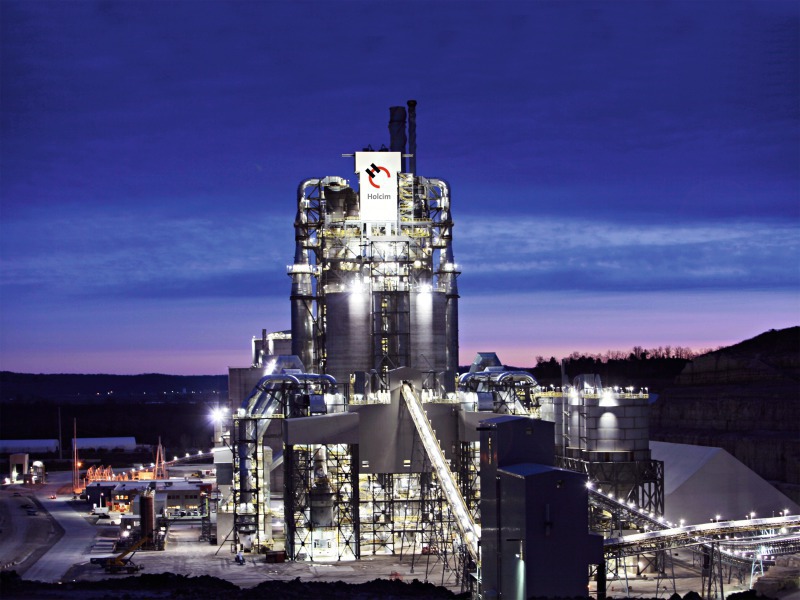
HeidelbergCement currently operates 85 cement plants in 28 countries with a capacity of 112.7 Mta plus another 16 plants in six countries as part of joint ventures with a capacity of 16.5 Mta. Largest capacities excluding the joint ventures are in Indonesia (20.5 Mta), Germany (11.0 Mta), the USA (10.3 Mta), the UK (6.3 Mta), Romania (6.2 Mta), Poland (6.0 Mta), India (5.6 Mta) and Russia (5.1 Mta). Largest joint-venture capacities are in China (7.4 Mta) and Turkey (3.8 Mta). In the last few years a number of new plants became operational, including an integrated 1.5 Mta plant in Togo (Figure 9). The regional U-Rates are derived from the cement and clinker sales of the fully consolidated companies, respectively 112.7 Mta capacity with an average U-Rate of 72 % (Figure 10). Highest U-Rates were achieved in North America with 95.3 % (!), lowest in Eastern Europe/Central Asia with 58.5 %.
3.3 Italcementi
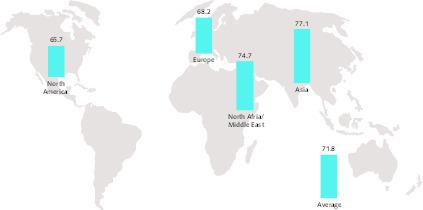
The acquisition of Italcementi by HeidelbergCement will be finalized this year. Therefore it is interesting to have a look at the Italcementi cement capacities and U-Rates. The company operates 42 integrated cement plants and 15 separate grinding plants in 17 countries with a consolidated cement capacity of 60.0 Mta and 71 Mta if the company’s joint-ventures in some other countries are included. The largest number of cements plants and capacity is in Europe (Figure 11), with 32 plants and 22 Mta capacity, followed by North Africa/Middle East with ten plants and 17 Mta capacity. In 2015 cement and clinker sales of 43.4 Mta were achieved, which results in an average U-Rate of 71.8 %. Figure 12 shows the regional distribution of the U-Rates. The highest U-Rate was achieved in Asia with 77.1 %, the lowest in North America with 65.7 %.
4 Capacity utilization trends in selected countries
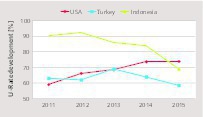
Although the global capacity utilization is declining, there are some countries with a positive trend. Three countries were selected, the USA, Turkey and Indonesia, to illustrate the trends in capacity utilization over the last five years. The countries are very different from the perspective of cement development, however all three countries have a fragmented cement industry in common with a large number of different producers.
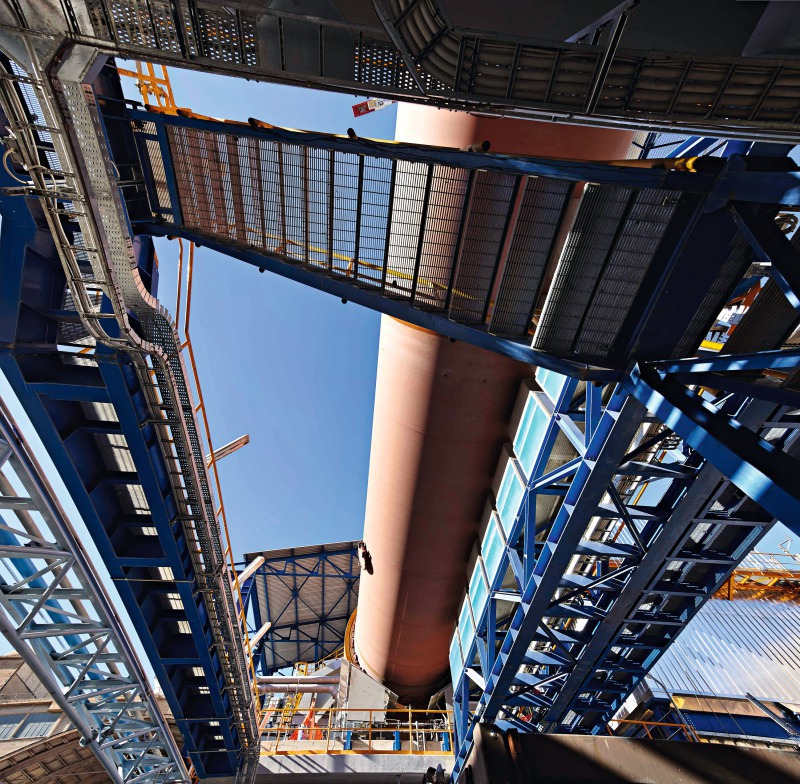
The cement industry in the USA was mostly affected by the global financial crisis with a massive decline in cement consumption [2]. Due to this decline 5.3 Mta of capacity were permanently closed. Today in the USA there are 97 integrated cement plants (Figure 13) and 14 separate grinding plants operational with a combined capacity of 112 Mta. In 2015 about 10 Mta of cement were imported. The second country under review is Turkey. Turkey has more than 20 cement producers with a combined clinker and cement capacity of 76.5 Mta and 126.1 Mta, respectively. These numbers include all the factories in Turkey. Turkey’s cement industry is very competitive and the plants are mostly of the latest design (Figure 14). Over the last years significant quantities of cement and clinker were exported. In 2015 about 7.4 Mta of cement were exported to almost 80 countries, and 3.1 Mta of clinker were exported to about 30 countries.
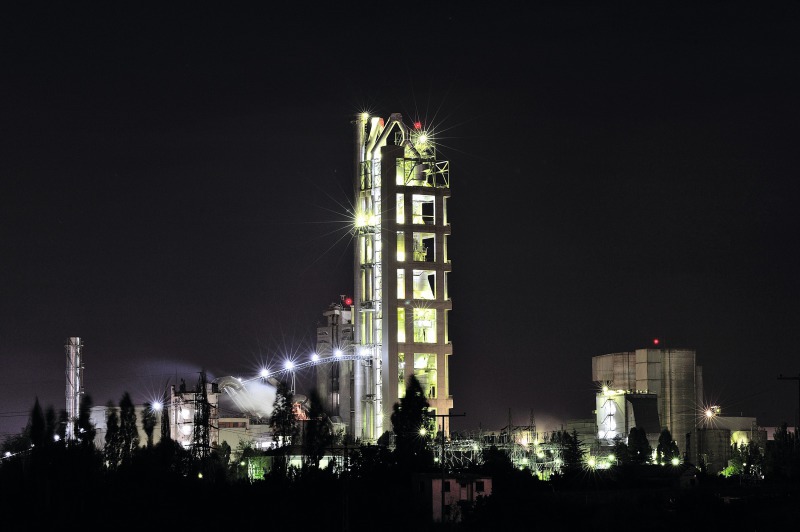
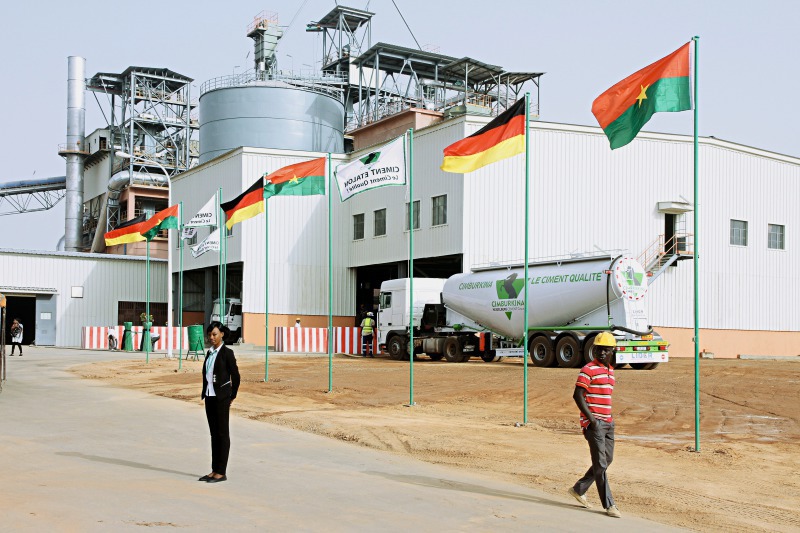
In Indonesia at the end of 2013 there were seven cement producers with a combined cement capacity of 68.0 Mta [3]. By 2015 this had increased to 13 producers with a combined capacity of 88.2 Mta with Semen Indonesia (Figure 15) as the leading player. This capacity is based on design capacity, and only 70.0 Mta are considered to be productive. By the end of 2016 the design cement capacity is projected to increase to 97.7 Mta, while the productive capacity will increase to 75.5 Mta. In general the future capacity development in Indonesia is not very clear, because existing players announced 36.2 Mta of new capacity from 2013 to 2017 and new market entrants announced another 40.3 Mta of new capacity. The latest prognosis by the leading producers suggests 23.6 Mta of new capacity by the existing players and 13.1 Mta by the new market entrants, which leads to another 7.0 Mta new capacity in 2017.
Figure 16 illustrates the capacity utilization development in the three countries. In the USA the average U-Rate increased from 59.0 % in 2011 to 73.9 % in 2015 with an almost constant capacity. In Turkey the U-Rate declined from 63.0 % in 2011 to 58.5 % in 2015, after a slight increase to 69 % in 2013. It has to be noted that the Turkish’ U-Rate is derived from the members of the TCMA (the Turkish Cement Manufacturers Association). However the reason for the decline in the U-Rate is mainly the large increase in the production capacity, although production was nearly constant in the last three years. In Indonesia, however the utilization rate is related to the design capacity and this clearly shows a large decline from 92.6 % in 2012 to less than 70 % (69.2 %) in 2015. The weak cement demand and the rapid capacity expansion resulted in lower sales volumes of the established producers. And the new market entrants will be unlikely to achieve their production goals.
5 New contracted kiln capacity
From 2009 to 2015 a total of 268 new kiln lines with capacities larger than 1000 t per day (t/d) were contracted outside China with a combined kiln capacity of 397 Mta. In the same period 714 new kiln lines were contracted in China with a capacity of 602 Mta [4]. In China the annual new contracted capacity is in a large decline (Figure 17) with 165 Mta being contracted in 2009 and 160 Mta in 2010, last year only 34 Mta were newly contracted. These new contracts are mostly in the West of China or as a replacement of obsolete capacity which had to be closed down. In the rest of the world, outside China, in the last three years there is a slight increase from 56.4 Mta in 2013 to 58.0 Mta in 2015. However, the peak in the newly contracted capacity outside China was in 2006 with almost 150 Mta and in the two years after with more than 120 Mta.
The trend is for larger kiln sizes, although in most cases it is not realistic to operate these kilns in the first years with a high capacity utilization. Figure 18 shows the contracted sizes outside China for the two time periods 2009–2015 and 2013-2015. In 2013-2015 relatively more kilns > 8000 t/d and relatively less kilns > 1000–2000 t/d have been contracted. The major kiln size was from > 4000–5000 t/d in both periods. The other major sizes were > 2000–3000 t/d and > 5000–6000 t/d. From 2009 to 2015 in total 16 kilns with sizes larger than 8000 t/d were contracted. So from our point of view the lower capacity utilization rates have a lot to do with the trend to larger kiln sizes and the fact that most of the large new kilns operate at U-Rates below 50 %, when they become operational. Often two to three years after commissioning U-Rates of only 70 % are achieved. Some new entrants even fail to achieve this benchmark.
The trend to larger kiln sizes is mostly affected by the economies of scale. Average prices for new contracted kiln capacities of 1.5-2.0 Mta have fallen to about 63 US$/t cli. in China and about 117 US$/t cli. in other emerging markets. However prices differ widely by regions and suppliers and depend on the quality of the core equipment and how much is sourced from specialists. It has also to be noted that newly contracted cement capacities are much higher than the kiln capacities. This has to do with the decreasing clinker factor in cement, which stands at a rate of 73 %, worldwide. OneStone has issued a new market report “Cement Industry Grinding 2020”, which, amongst other things, shows that in 2015 a total of 63 % of all newly contracted mills have been clinker and slag grinding mills. Many of these mills are operated as split grinding plants [5].
6 Outlook
The new market report “Cement Pyro Systems 2020” forecasts a slowdown in contracted capacity outside China for the next few years [4]. By the end of this decade newly contracted capacity will accelerate. Let us again take LafargeHolcim as an example. The leading global player suffers from low capacity utilization rates. For the next few years the company has enough room to grow using existing capacity and the new capacity projects that started before the merger and being developed in countries such as Algeria, Brazil, Canada, Ecuador, India, Nigeria, Russia and the USA. It is unrealistic to expect new investment decisions before 2019. Another example is Dangote Cement. The company is massively expanding its capacity in Africa and has also started an international strategy. The company is planning to grow its cement capacity from 43.6 Mta in 2015 to 77.3 Mta in 2019, which gives them plenty of time to carefully consider new investment decisions.
Überschrift Bezahlschranke (EN)
tab ZKG KOMBI EN
This is a trial offer for programming testing only. It does not entitle you to a valid subscription and is intended purely for testing purposes. Please do not follow this process.
This is a trial offer for programming testing only. It does not entitle you to a valid subscription and is intended purely for testing purposes. Please do not follow this process.
tab ZKG KOMBI Study test
This is a trial offer for programming testing only. It does not entitle you to a valid subscription and is intended purely for testing purposes. Please do not follow this process.
This is a trial offer for programming testing only. It does not entitle you to a valid subscription and is intended purely for testing purposes. Please do not follow this process.