Lafarge-Holcim’s cement rivals in the Americas
 OneStone Consulting
 OneStone Consulting
 OneStone Consulting
 OneStone Consulting
 OneStone Consulting
 Holcim
 OneStone Consulting
 Vicat
Vicat
 CEMEX
CEMEX
 Votorantim
 Intercement
 Argos
Argos
 HeidelbergCement
 Ash Grove Cement
 OneStone Consulting
 OneStone Consulting
 OneStone Consulting
 OneStone Consulting
 OneStone Consulting
 OneStone Consulting
 OneStone Consulting
 Lafarge
Lafarge-Holcim will have the largest cement capacity of any of the cement producers in the Americas after their merger and sale of assets to CRH. In the following review we will discuss the implications of the merger, profile the major cement rivals in this region and look at the latest market developments in the major markets of the USA, Brazil and Mexico.
1 Introduction
The cement industry benchmarks of North America and Latin America are very different. While cement prices are highest in Latin America (258 compared to an index of 100 for Asia Pacific), North America is, with an index of 191, closer to the global average of 173. But operating costs are highest in North America (index of 232 compared to 100 for Asia Pacific) and much lower in Latin America, with an index of 126, which is below the global average of 146. Finally, replacement costs for cement capacity are indexed at 250 for North America and 130 for Latin America (compared to an...
1 Introduction
The cement industry benchmarks of North America and Latin America are very different. While cement prices are highest in Latin America (258 compared to an index of 100 for Asia Pacific), North America is, with an index of 191, closer to the global average of 173. But operating costs are highest in North America (index of 232 compared to 100 for Asia Pacific) and much lower in Latin America, with an index of 126, which is below the global average of 146. Finally, replacement costs for cement capacity are indexed at 250 for North America and 130 for Latin America (compared to an index of 90 for China). Interestingly the clinker to cement ratio is highest in North America at 0.83 and lowest in South America at 0.68 (all data for 2012, taken from [1]).
In 2013 Lafarge and Holcim (LH) had a cement capacity of 82.2 million annual tons (Mta) and a market share of 21 % of the almost 390 Mta total cement capacity in the Americas. In North America, which comprises the USA and Canada, LH had a 30 % share of capacity with 38.5 Mta and in Latin America LH had a 17 % share of capacity with 43.7 Mta. Nevertheless, when the merger of Lafarge and Holcim will be complete possibly in 1 H 2015, LH will only have about 73.3 Mta cement capacity after asset disposals in the USA, Canada, Brazil and Ecuador. The assets of 7.5 Mta in the first 3 countries mentioned will go to the Irish building material group CRH, while the Lafarge assets of 1.4 Mta in Ecuador will be transferred to Union Andina de Cementos (UNACEM).
2 America’s cement industry
America’s cement industry development is driven by a relatively high population growth, adequate housing requirements and infrastructure development [2, 3]. In 2014 North America had a population of 353 million and Latin America 618 million. North America’s population is forecast to grow by a compound annual growth rate (CAGR) of 0.4 %, while Latin America’s growth is 1.2 %, leading to a population of 393 million in 2030 and 444 million in 2050 for North America, and 710 and 773 million for Latin America respectively (all data by Population Reference Bureau).
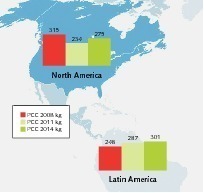
Fig. 1 shows the per capita cement consumption (PCC) in the Americas in 2008, 2011 and 2014, which is based on a population of 337.8 million (2008), 346.2 million (2011) and 353.2 million (2014) for North America and 577 million, 596 million and 618 million for Latin America. In North America the PCC was highest in 2008 with 315 kg. With the global crisis the cement consumption dramatically decreased and so did the PCC, leading to 234 kg in 2011. Now, after some recovery the PCC stands at 275 kg, still much lower than in 2008. In Latin America the PCC was steadily growing from 248 kg in 2008 to 301 kg in 2014, which is the highest figure that has ever been achieved.
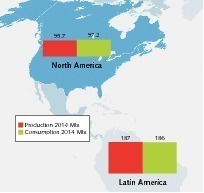
Actual data about the cement production and consumption in the regions is illustrated in Fig. 2. Total cement production in the Americas was 282.7 Mta in 2014, compared to 251.4 Mta in 2011, which corresponds to a CAGR of 4.0 %. The cement consumption increased from 252.1 Mta in 2011 to 283.2 Mta, which also corresponds to a CAGR of 4.0 %. So the Americas was a net importer of just 0.5 Mta in 2014. Last year North America had a 33.9 % share of production with 97.2 Mta, while Latin America produced 187.0 Mta (66.1 %). In terms of consumption North America consumed 34.3 % with 97.2 Mta and Latin America 186.0 Mta or 65.7 %.
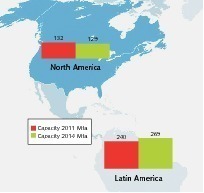
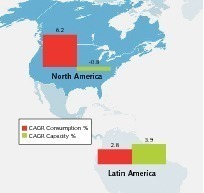
The cement capacity in the Americas increased from 372 Mta in 2011 to 398 Mta in 2014 (Fig. 3), which corresponds to a CAGR of 2.3 % or 26 Mta of additional cement capacity in 3 years which is about 8.7 Mta of new capacity per year. The share of North American cement capacity decreased from 35.5 % to 32.4 %, while the Latin American capacity increased from 64.5 % to 67.6 %, or 269 Mta which is a new all-time high. In Fig. 4 the CAGR for cement consumption and cement capacity additions are compared, for the period 2011 to 2014. While the average cement consumption growth for the Americas was 4.0 %, the capacity growth was 2.3 %. North America had 6.4 % growth in consumption but capacity dropped by -0.8 %. Latin America had 2.8 % growth in consumption and 3.9 % growth in capacity.
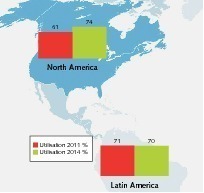
On an average the capacity utilization in the Americas increased from 68 % in 2011 to 71 % in 2014 (Fig. 5). While the utilization rate in North America significantly increased from 61 % to 74 %, in Latin America the utilization sank from 71 % in 2011 to 70 % in 2014, due to the fact that cement capacity was growing faster than consumption.
3 Major cement rivals in the Americas
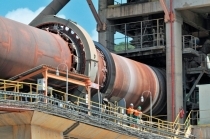
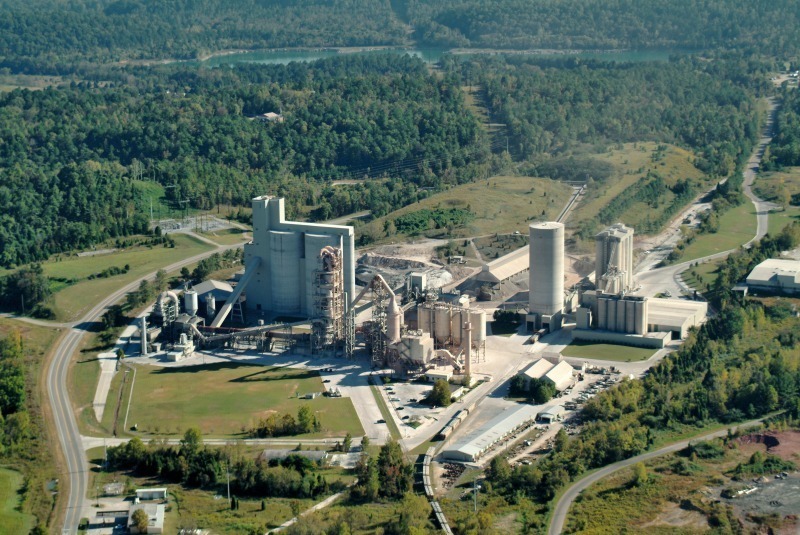
LH has a cement production in 11 countries, including Argentina, Brazil, Canada, Chile, Colombia, Costa Rica, Ecuador, El Salvador, Mexico, Nicaragua and the USA. In 2013 in North America LH had 25 integrated cement plants (Fig. 6) and 8 grinding plants with a combined cement capacity of 22.0 Mta. In Latin America there were 25 integrated plants and 11 grinding plants with a capacity of 43.7 Mta. With the planned divestments of Holcim’s assets in Canada, Holcim’s Trident plant in the USA, 3.6 Mta assets from both Lafarge and Holcim in Brazil and the sales of Lafarge’s assets in Ecuador, the merged company will still be present in 11 countries with a combined capacity of 73.3 Mta from 43 integrated and 17 grinding plants.
In 2013 Holcim produced 11.7 Mta of cement in North America and 25.0 Mta in Latin America, which with the previously mentioned cement capacities resulted in capacity utilization rates of 53 % and 71 % respectively. Nevertheless LH has capacity upgrade and expansion plans. Holcim is planning a new dry kiln line for the US Joppa plant to be operational in the 1H 2016 and to upgrade the Ada plant from wet to dry. Lafarge announced an upgrade of the Ravenna cement plant to 2.8 Mta by 2016 and a new 2.6 Mta cement line in the Joppa plant, after the older kiln 2 was mothballed in 2012.
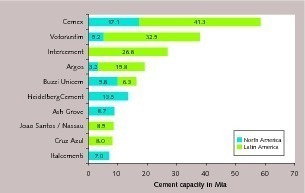
Fig. 7 gives an overview of the TOP 10 cement rivals for LH in the Americas, which comprise CEMEX, Votorantim, Intercement, Cementos Argos, Buzzi Unicem, HeidelbergCement, Ash Grove, Joao Santos Group, Cruz Azul and Italcementi (all cement capacity data from 2013). The TOP 10 rivals had a combined cement capacity of 211.3 Mta, which corresponds to 54.2 % of the 390 Mta capacity in the Americas. There are about 50 other local producers, with a combined capacity of 96.5 Mta, including companies such as TXI, Titan, Taiheiyo, Eagle Materials, Vicat (Fig. 8) Ciments Quebec in North America, and GCC Mexico, Elementia, Cimentos Tupi, Cimentos Liz, Cimentos Mizu, Ciplan, Cementos Bio Bio, Cemento Melon, Soboce, Cementos Avellandea, Petroquimica, Trinidad Cement and many others in Latin America. Monopolist Invecem in Venezuela is not regarded as competitor.
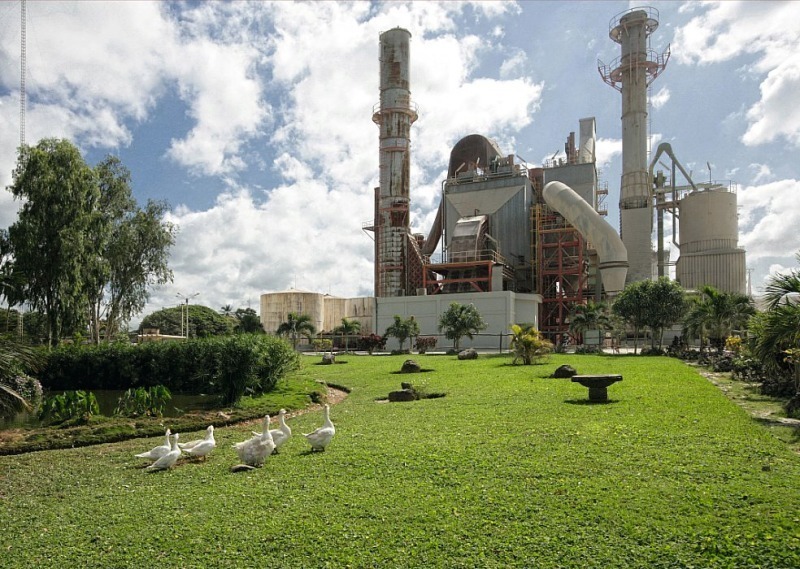
The largest competitor in the region is CEMEX with a cement capacity of 17.1 Mta in North America and 41.2 Mta in Latin America with operations in Mexico, the USA, Colombia, Costa Rica, Dominican Republic, Panama, Nicaragua (Fig. 9), Puerto Rico and Guatemala. This gives the company a 15 % market share in the Americas. CEMEX has other non-controlling positions in cement plants in Trinidad and Tobago, Barbados, Jamaica, the Cayman Islands and Bermuda. CEMEX also operates a network of 8 marine terminals in Haiti, the Bahamas and Brazil. Capacity expansion projects were announced in Mexico, Colombia, Costa Rica and Nicaragua, including brown field cement plants and grinding plants, which will increase the cement capacity by 7.4 Mta in 2017.
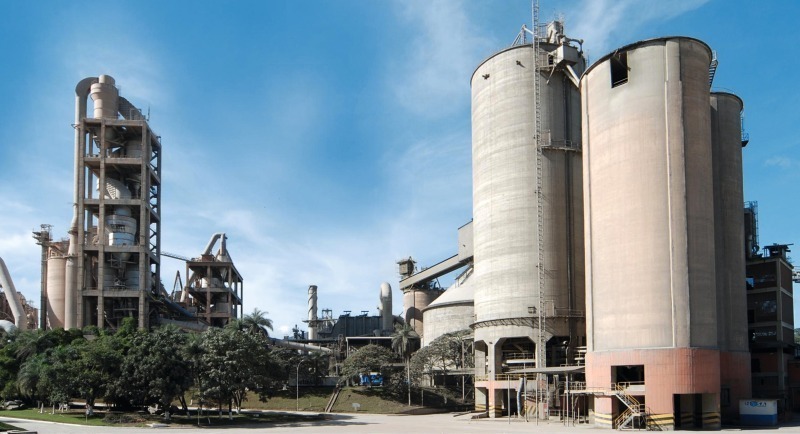
Votorantim Cimentos has a global cement capacity of 53.9 Mta, of which 32.5 Mta are in Latin America and 5.2 in North America. Accordingly the market share of the cement capacity in the Americas is 9.7 %. In Brazil the company has 16 cement and 11 grinding plants (Fig. 10). In Argentina, Bolivia, Chile, Peru and Uruguay the company owns 6 cement and 2 grinding plants. In the USA and Canada Votorantim owns and operates 5 cement plants and 2 grinding plants. In Brazil a massive expansion programme started in 2007 including new greenfield plants. Construction projects for new plants are still underway in Primavera and Edealina in Brazil, which will be completed in 2H 2015. In North America Votorantim’s Great Lakes Charlevoix plant will be upgraded and the non-permanent-closed Dixon III plant might be put into operation again.
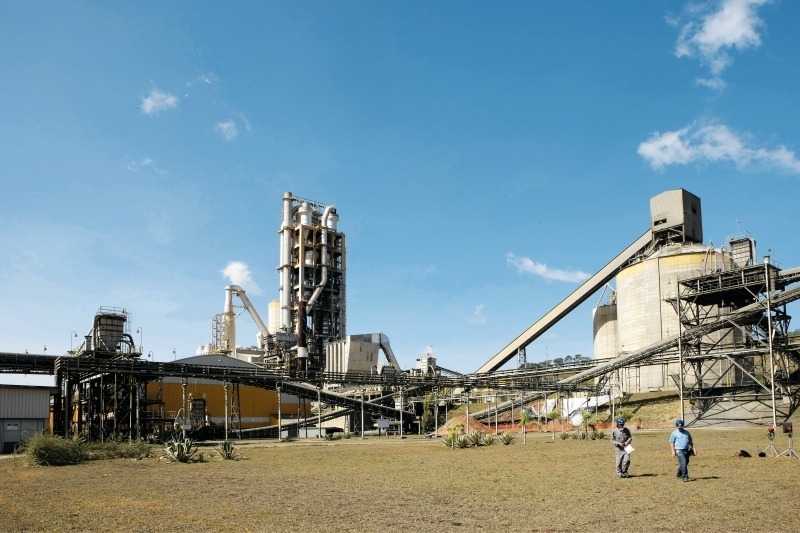
Intercement became the 3rd largest cement rival to LH in the Americas after the asset swap and corporate restructuring with CIMPOR. Now the company has a capacity of 46 Mta, of which 26.8 Mta are located in Brazil (Fig. 11), Argentina and Paraguay. In Brazil in 2013 new kiln lines became operational in Cezarina and Caxitu as well as a grinding plant in Cubatao. For the coming years no major projects have been announced. Cementos Argos is next in ranking with 15.8 Mta capacity in Latin America and 3.2 Mta in North America, from cement plants in Colombia, Honduras and the USA. In 2011 and 2013 the Lafarge assets in Honduras and the USA (Fig. 12) were taken over. The company is planning expansions of the Antioquia, Sogamoso and Harleyville cement plants.
Buzzi Unicem is the fifth largest cement rival to LH in the Americas with 16.1 Mta capacity, followed by HeidelbergCement with 13.5 Mta. Buzzi Unicem has 8 cement plants in the USA with a combined capacity of 9.8 Mta and 3 plants in Mexico with a combined capacity of 6.3 Mta. The 3 kilns of the Maryneal plant in the USA will be replaced by a new 1.6 Mta line in 2016. HeidelbergCement has 10.9 Mta of cement capacity in the USA and 2.6 Mta in Canada. In the USA the company operates 11 integrated (Fig. 13) and 2 grinding plants. Last month the company announced its intention to sell its Hanson related North American and UK Building Material Business to the Lone Star Group. The transaction is not expected to have any major impacts on the cement business.
The final 4 places in the TOP10 ranking go to the cement producers Ash Grove Cement, Grupo Joao Santos, Cruz Azul and Italcementi, which either have capacities in North or Latin America. Ash Grove Cement has 8 integrated plants (Fig. 14) in the USA and 8.7 Mta of capacity. The company is planning a new dry kiln line for its Midlothian plant which will be operational in 2016. Joao Santos is a Brazilian cement producer with 8.5 Mta from 10 plants with two more kiln lines under construction. Cruz Azul has 4 cement plants in Mexico with 8.0 Mta capacity. Italcementi operates through Essroc in the USA, Canada and Puerto Rico with a cement capacity of 7.0 Mta from 7 plants.
The proposed acquisition of LH assets by CRH will make CRH another cement rival in the Americas with 3.9 Mta capacity in North America and 3.6 Mta in Latin America. Furthermore other investors are interested in operating in this attractive market. One such example is McInnis Cement, who will construct a 2.5 Mta greenfield cement plant in Port-Daniel-Gascons in Quebec Canada. This project is mainly export driven.
4 Major cement countries in the Americas
4.1 USA
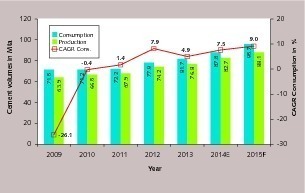
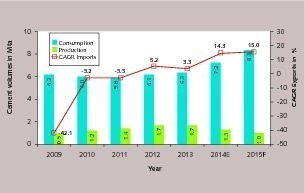
The latest forecasts of the cement growth in the USA by the Portland Cement Association (PCA) suggest that the cement market is expected to have grown by 8.2 % in 2014, followed by 8.4% in 2015 and 10.7 % in 2016 [4]. Nevertheless, in recent years the quarterly PCA forecasts were, mostly, not achieved, but this time the projection could be true. Fig. 15 shows the US cement production and consumption and consumption growth rate by 2015. Different to the forecasts provided by the PCA this projection includes Portland and blended cements as well as Masonry cements. In 2014 cement consumption and production stood at 87.8 Mta and 82.7 Mta respectively. The consumption is expected to grow from 7.5 % in 2014 to 9.0 % in 2015, leading to 95.7 Mta.
In Fig. 16 the cement imports and exports are given. In 2006 imports peaked at 32.1 Mta with more than 180 facilities involved in trade and distribution [5]. With the economic crisis imports decreased to 5.8 Mta in 2011. Since then imports have increased to 7.2 Mta by a double digit growth rate in 2014. In 2015 imports are projected to grow further by 15.3 % to 8.3 Mta. On the other hand with the sluggish cement demand growth exports increased from 0.7 Mta in 2006 to 1.7 Mta in 2012 and they are forecasted to decrease to 1.3 Mta in this year. While imports are mainly from Canada, South Korea, China, Greece, Taiwan, Mexico and Sweden, exports are mainly to the Caribbean.
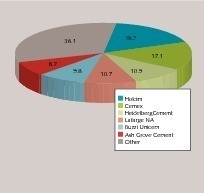
In the USA there are 97 integrated cement plants and 14 separate grinding plants operational with a combined capacity of 112 Mta. Fig. 17 shows the major producers.
Holcim is the market leader with a capacity of 18.7 Mta and a 16.7 % market share from 10 integrated and 3 grinding plants. No. 2 and 3 in the ranking are CEMEX and HeidelbergCement with 15.3 % and 9.7 % market share. Lafarge has 10.7 Mta capacity and 9.6 % market share from 6 integrated and 3 grinding plants. The other leading producers are Buzzi Unicem and Ash Grove Cement with 8.8 % and 7.9 % market share. The other producers including TXI, Italcementi, Votorantim, Titan, Taiheiyo, Argos, Eagle Materials, Vicat, Valderrivas, GCC, Mitsubishi, Continental and Florida Rock have 36 Mta capacity and 49 cement plants.
4.2 Brazil
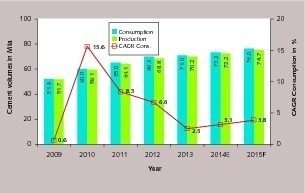
The development of Brazil’s cement industry was disappointing in the last few years [6]. Fig. 18 provides updated cement consumption and production data. After a 2.5 % consumption growth in 2013 the consumption slightly increased by 3.1 % to 73.2 Mta with a forecast of 3.8 % growth in 2015 and a cement consumption of 76.0 Mta. Nevertheless in former projections by the cement industry a consumption of more than 80 Mta was anticipated for 2015. Closely following cement consumption production is also largely behind expectations. In our forecast we expect a cement production of 72.2 Mta in 2014 and 74.7 Mta in 2015. Accordingly with the planned and ongoing capacity expansion programme for the next few years the cement capacity utilization will further decline from about 78 % in 2014.
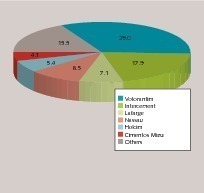
Fig. 19 contains an update of the major cement producers in Brazil. Votorantim Cimentos is the market leader with a capacity of 29 Mta and market share of 33 % from 16 integrated and 11 grinding plants. Second and third in ranking are Intercement and Grupo Joao Santos with 20 % and 10 % market share, respectively. Intercement has 17.9 Mta of cement capacity in Brazil from 14 integrated and 2 grinding plants, while Joao Santos has a capacity of 8.5 Mta from its 10 cement plants. Lafarge, Holcim and Cimentos Mizu are the other leading producers with market shares of 8 %, 6 % and 5 % respectively. The other producers in Brazil comprise a cement capacity of 15.5 Mta from 14 cement plants and include Cimentos Tupi, Cimentos Liz, Ciplan, CSN, Brenand, Secil, Apodi and 2 smaller producers.
4.3 Mexico
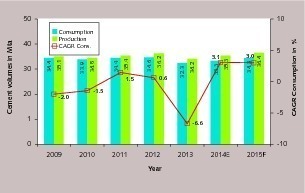
In recent years the cement market growth in Mexico has been difficult to predict (Fig. 20). After a slight market recovery in 2011 the market growth again declined in 2012 and 2013. 2014 was the first year with some significant growth after the global economic crisis. The cement consumption increased by 3.1 % to 33.3 Mta, while the cement production increased to 35.3 Mta. For 2015 it is forecasted that the growth will be on a similar level so that a cement consumption of 34.4 Mta and cement production of 36.4 Mta will be achieved. Nevertheless in 2014, the cement capacity utilization rate was just 59 % with 60.1 Mta cement capacity.
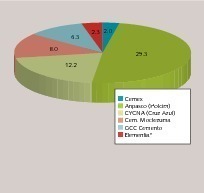
Fig. 21 shows how the cement capacity was distributed in 2013. CEMEX is the undisputed market leader with a market share of 49 % with 29.3 Mta capacity in 15 cement plants. Holcim (Apasco) is No. 2 in the ranking with a market share of 20 % from 12.2 Mta capacity of 7 cement plants. The other leading producers with 13 and 10 % market share are CYNA (Cruz Azul) and Buzzi Unicem (Cementos Moctezuma). CYNA has 8.0 Mta capacity from 4 plants and Buzzi Unicem has 6.3 Mta capacity from 3 plants. The other two smaller producers are GCC and Elementia with 4 and 3 % market share. Lafarge has a 47 % participation in Elementia with the contribution of its formerly owned Vito and Tula cement plants.
5 Outlook
Lafarge-Holcim will have a leading position in the cement industry of the Americas with about 18 % market share in the 2015 cement capacities. Nevertheless LH’s rivals will grow their capacities in the Americas faster, as LH strives to improve their capacity utilization rates. So, by 2020 it is anticipated that LH will have not more than 15 % market share in the Americas, when only the internal growth of LH is considered without major acquisitions. On the other hand the probability of acquisitions will increase with growing overcapacities in the market especially in Latin America as a result of the excellent returns on investment in this world region, which has been a market driver for many years.
Überschrift Bezahlschranke (EN)
tab ZKG KOMBI EN
This is a trial offer for programming testing only. It does not entitle you to a valid subscription and is intended purely for testing purposes. Please do not follow this process.
This is a trial offer for programming testing only. It does not entitle you to a valid subscription and is intended purely for testing purposes. Please do not follow this process.
tab ZKG KOMBI Study test
This is a trial offer for programming testing only. It does not entitle you to a valid subscription and is intended purely for testing purposes. Please do not follow this process.
This is a trial offer for programming testing only. It does not entitle you to a valid subscription and is intended purely for testing purposes. Please do not follow this process.