Recovery of India’s cement industry
 WEO of IMF
 OneStone Research
 OneStone Research
 OneStone Research
 OneStone Research
 OneStone Research
 LafargeHolcim
 Ultratech
 KHD Humboldt Wedag
 Jaypee Group
 Shree Cement
 Italcementi
 Vicat
Vicat
 TKIS
TKIS
 OneStone Research
 OneStone Research
 OneStone Research
 LafargeHolcim
In recent years India’s cement demand has been much weaker than expected. However the signs are now indicating a recovery with a higher demand, higher production and higher utilization rates of the installed capacity. In this market review latest cement figures are presented and an outlook to 2018 is given.
1 Introduction
India is a fascinating country. Every major world religion is represented here. In a world of conflict and bigotry, the country provides an alternative model of peaceful co-existence. India has 1650 languages, 30 of which are spoken by more than a million and about 120 of which are spoken by more than 10 000. Culture, traditional medicine and beautiful landscape are other highlights, to name a few. India can also be characterized through its huge contrasts. Today, India has a greater share of the world’s poorest than it had thirty years ago, 33 % of the population which...
1 Introduction
India is a fascinating country. Every major world religion is represented here. In a world of conflict and bigotry, the country provides an alternative model of peaceful co-existence. India has 1650 languages, 30 of which are spoken by more than a million and about 120 of which are spoken by more than 10 000. Culture, traditional medicine and beautiful landscape are other highlights, to name a few. India can also be characterized through its huge contrasts. Today, India has a greater share of the world’s poorest than it had thirty years ago, 33 % of the population which corresponds to more than 400 million and nearly 36 % of the global poorest is living on less than US$ 1.25 a day. On the other hand only 160 000 (0.012 %) of India’s 1.296 billion population owns 1/3 of the country’s wealth. And 11 % of the world’s gold is in the hands of rich Indian housewives.
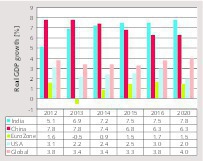
In the coming years India’s economy will grow faster than China (Fig. 1.) In the latest WEO Update from July 2015 (World Economic Outlook by the International Monetary Fund) for India a GDP growth of 7.5 % is projected for 2015 and 2016 while the projection for China is 6.8 % and 6.3 % respectively. Accordingly, India’s growth is expected to strengthen, while China will be weaker. Growth will benefit from recent policy reforms, an increase in investments, and lower oil prices. In the GDP ranking India stands with a global share of 6.8 % at fifth position, after the USA, China, Japan and Germany (2014 data). India’s share of the emerging countries is 12.0 %. However, on the basis of PPP (Purchase Power Parity), GDP per capita stands at 5855 US$, and the world ranking of India is 125.
Despite mega cities such as Mumbai, Delhi, Bangalore, Chennai and Kolkata most of India’s population still lives in rural areas. The urbanization rate today is just 31 % which is relatively small when compared to China (45 %), Indonesia (54 %), Mexico (78 %) and Brazil (87 %). According to the 2013 revision of the World Population Prospects by the UN, India’s population will overtake China by 2028 or earlier. Projections for 2030 suggest that India will have a population of about 1.51 billion. By this time about 600 million Indians (40 %) will reside in urban areas, compared to the 400 million today. Urbanization will be central to India’s strategy of achieving faster and more sustained growth, because it provides more opportunities for earning a livelihood and enables inclusion of more people in the process of economic growth.
2 Infrastructure and construction needs
The new Indian Government under Prime Minister Narendra Modi proposed various measures that should lead to increased infrastructure and construction spending and finally to an increased cement demand. The new Government plan to 2022 goes far beyond the 12th five year plan 2012–2017, is focusing on housing for all, uninterrupted power (24*7), electrification of remaining 20 000 villages, clean drinking water as well as sewage and road connectivity. The cost of the program will exceed one trillion US$. Financing of the housing program is mainly through public-private-partnership (PPP), interest subsidy and increased flow of resources by the Government to the housing sector. Investments in infrastructure and other construction uses Build-Operate-Transfer (BOT) models and Engineering-Procurement-Construction (EPC). Finally a huge increase in foreign direct investment (FDI) is expected, with for example up to 100 % participation allowed in real-estate projects.
The Housing-for-All program was a key promise of the ruling BJP party in the 2014 election which promises a “pucca” house for each family by the 75th year of Independence. The complete scheme will cover about 20 million houses for urban and 40 million for rural areas. The phase I urban area implementation (FY 2016–17) will cover 100 cities, phase II (FY 2018–19) will cover an additional 200 cities and phase III (FY 2020–2021) will cover the remaining cities. The housing sector alone contributes 5–6 % to the country’s GDP. The real estate market including housing, retail, hospitality and commercial is expected to touch US$ 180 bn by 2020. In 2014 foreign investors bought tenanted office space worth over US$ 2 bn in India. Delhi’s Central Business District has been ranked as the sixth most expensive prime office market in the world with prices of US$ 160/sq ft per year, according to real estate service company CBRE.
Roads, ports, railways, irrigation systems and the clearance of large infrastructure projects could be the driving forces in the near term. India has the second largest road network in the world with 4.7 million km. But with growing passenger traffic and freight movements the necessity of an adequate road network is paramount. The value of roads and bridges infrastructure is expected to touch about US$ 20 bn in 2020. Over FY 2006–13 road construction projects awarded to BOT companies achieved a CAGR (Compound Annual Growth Rate) of 17.1 %. The cement industry will especially profit from the trend to concrete roads. Furthermore India aims to invest US$ 137 bn in railways in the next 5 years. Metro rail projects are coming up in tier II cities such as Ahmedabad, Chandigarh, Jaipur, Kochi, Patna, Pune and Surat. The proposed investment for this is US$ 17 bn. The Indian Power sector has an investment potential of US$ 250 bn in the next 4–5 years. 30 % of the population still live without reliable access to grid electricity and a huge proportion of those who have grid access suffer on average 5–6 hours of daily disruption. The investment program includes 5 new mega power projects of 4000 MW, each and a target of 175 000 MW renewable energy by 2022. To overcome existing deficiencies large efforts have to be made, including a robust bottleneck-free electricity transmission infrastructure and a reliable distribution network. According to the Minister for Power, Coal, New and Renewable Energy there is no doubt about the size and the complexity of the measures.
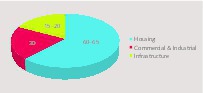
Figure 2 gives an indication of the use of cement for housing, commercial & industrial construction and infrastructure. According to the chart about 60–65 % of the cement produced goes into housing, and 15–20 % is used for infrastructure projects and the rest for other construction. There is a solid and consistent residential base demand, and the other sectors are reviving. Manufacturing and retail will likely pick-up post 2015 with about 7 % growth, and the infrastructure sector could be driving growth with a 30 % higher investment allocation. In the coming years the proportion of cement used in the infrastructure sector will increase while the proportion used in housing might decrease, even with the Housing-for-All program.
3 Cement industry development
According to the Cement Manufacturers’ Association (CMA) in FY 2015 (April 2014 to March 2015) there are 188 large cement plants and about 365 small and mini cement plants in India, with an installed capacity of about 360 million tons per year (Mta) and 11.1 Mta respectively. From our research of the major cement producers, we found that the capacity of the large plants in FY 2015 was about 386 Mta, which might include some plants that are not operational. In this market review only the large plants and their production figures are reviewed. Cement consumption or demand figures should also include the production from the mini cement plants, but there are no accurate market figures available.
There are many different market figures from different sources about the Indian Cement Industry available. Many of these market figures cannot be trusted. We took our figures mainly from the CMA, DIPP (Department of Industrial Policy & Promotion of the Indian Ministry of Commerce & Industry) and publications of the two major producers Ultratech and Holcim. The Holcim figures are especially useful when figures for the calendar year are compared with global figures. Here we focus on market figures for the Indian fiscal years as we have done in previous market reviews [1–3].
3.1 Production and capacity
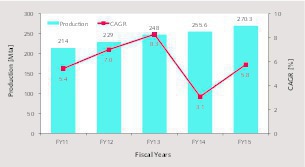
Figure 3 shows the development of cement production from the large plants and the appropriate compound annual growth rates (CAGR) from FY 2011 to FY 2015. It can be seen that production increased from 214 Mta to 270.3 Mta, which corresponds to an average CAGR of 6.0 % over the period. However growth was highest from FY 2011 to 2013. FY 2014 saw a decline of the CAGR to 3.1 % and FY 2015 saw a recovery to 5.8 %, which is still lower than the average CAGR over the period. The high growth of FY 2013 lead to much higher expectations, so the growth expectations had to be adjusted significantly. From our market figures we estimate for FY 2015 a cement consumption of 278 Mta, which leads to a per capita consumption (PCC) in India of about 215 kg. Some other sources publish a very different PCC.
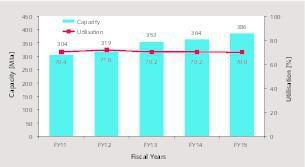
The cement capacity increased from 304 Mta in FY 2011 to 386 Mta in FY 2015 (Fig. 4). The average CAGR over the period is 6.2 %, so capacity was growing faster than production, resp. the cement demand. It has to be noted that during the period under review imports decreased and exports increased. Despite the growing exports the cement capacity utilization declined from 71.8 % in FY 2012 to 70.0 % in FY 2015. Many of the capacity expansion projects were decided when the cement market was booming and when the expectations for future growth were also high. So although some investors got it right a number of them were wrong with their investment decisions.
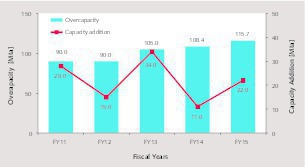
Figure 5 summarizes the overcapacities in the last few years and how the capacity additions developed. Until FY 2012 about 90 Mta was not used (if the capacity utilization is based on 100 %). With capacity additions of 34 Mta in FY 2013 the overcapacity stood at 105 Mta and increased to 108.4 Mta in FY 2014, although only 11 Mta was added in that year. Today overcapacity stands at 115.7 Mta. A large amount is in the Southern region of India (Fig. 6). According to our research in the South about 36.5 % of the capacity is installed (FY 2014), but only 29.7 % of the cement was produced here. So, the Southern region had an overcapacity of 56.8 Mta, which corresponds to more than half (52.4%) of the total overcapacity in India. However, with the large overcapacity in the South the capacity utilization figures in all other regions look much better.
3.2 Main producers
The cement industry in India is extremely fragmented. There are more than 50 independent producers, operating 205 large cements plants of which 66 (32 %) are split grinding plants. The large number of separate grinding plants is mainly a result of the concentration of the limestone reserves in only 7 regions (cement clusters), which are not all close to the cement markets. But it has also to do with the high fly ash utilization rates in cement, with the ashes produced in the major coal-fired power plants close to the markets. Anyhow, to have a good market penetration, for many cement producers it is necessary to own split grinding plants.
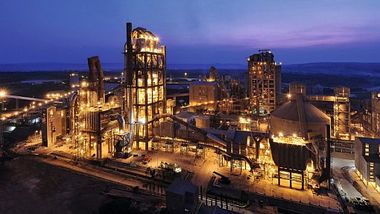
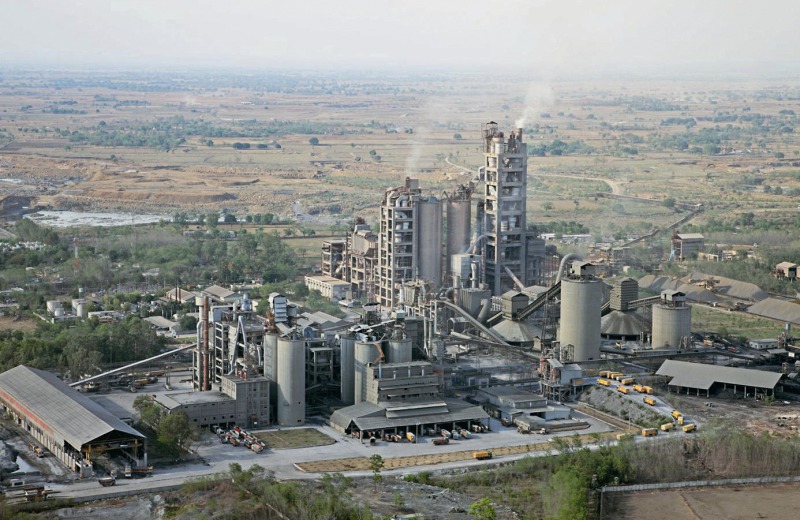
The TOP 10 cement producers have a combined cement grinding capacity of about 279 Mta in FY 2015, which gives them a 72.3 % market share in terms of capacity (Table 1). The TOP 10 operate 136 cement plants of which 86 are integrated plants and 50 are split grinding plants. The rest, more than 40 producers, have a combined cement capacity of about 107 Mta and operate 69 plants of which 53 are integrated plants and 16 are split grinding units. Anyhow ranking of the TOP 10 has changed significantly in the last few years. The No. one is now Lafarge-Holcim as a result of their recent merger. The merged company has a capacity of 68.0 Mta, of which 32.1 % are from the Holcim participation in Ambuja Cement, 30.1 Mta are from the participation in ACC (Fig. 7) and 5.8 Mta are from the former Lafarge assets, after the demerger of one integrated and one grinding plant with 5.15 Mta capacity to Birla Corp. LafargeHolcim is the most widespread cement producer in India.
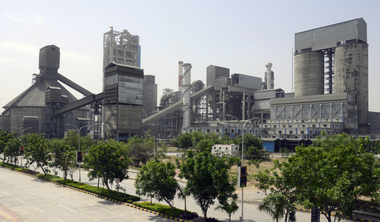
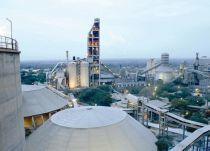
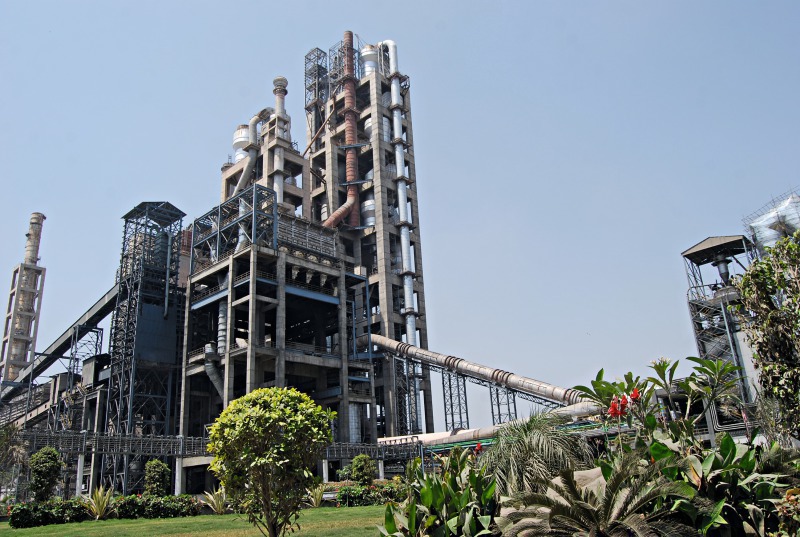
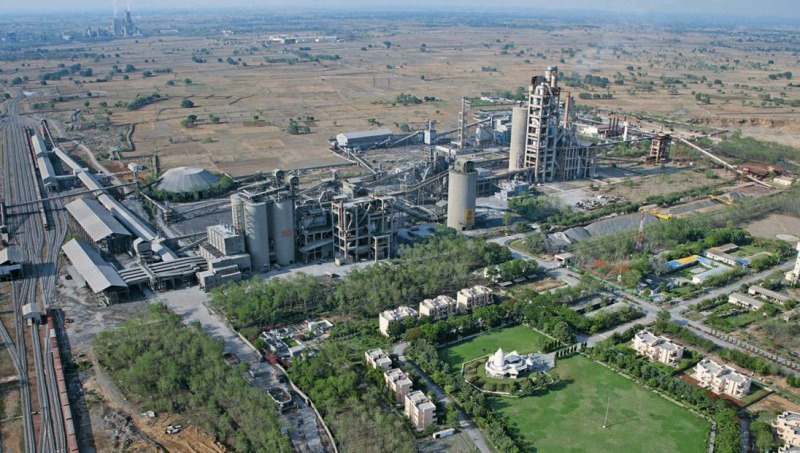
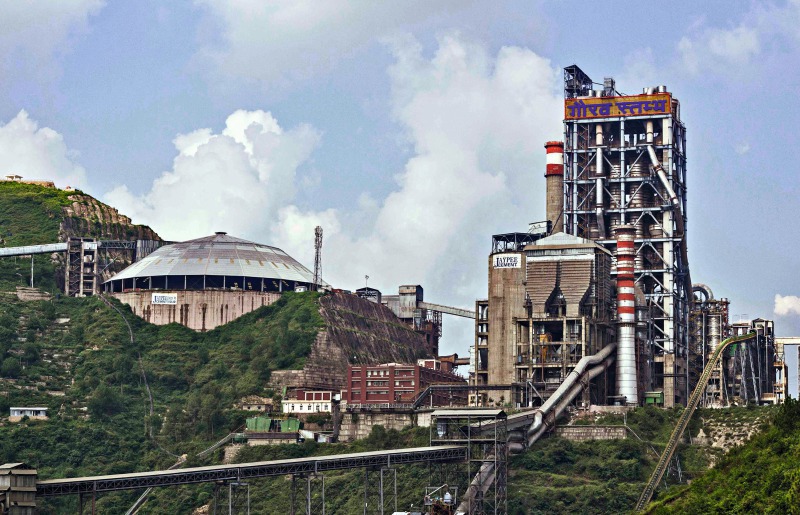
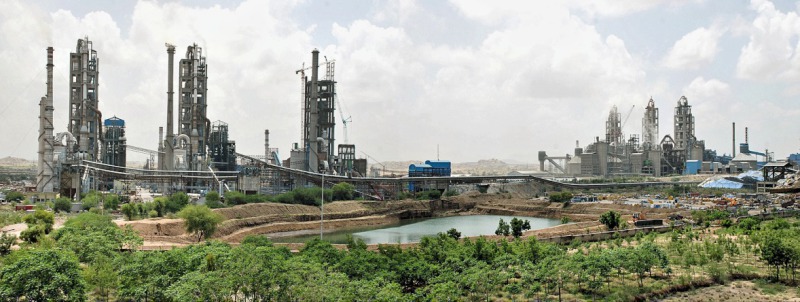
No. 2 in ranking now goes to the former no. 1 Ultratech, an Aditya Birla company. Ultratech’s Indian landscape now has a cement capacity of 65.1 Mta after the acquisition of JAL’s Bela (Fig. 8) and Sidhi plants, which have 4.9 Mta capacity. Before the acquisition Ultratech had 33 % of its capacity in the West and 28 % in the North. After the acquisition and with the addition of grinding units and a brownfield expansion in 2016 the company will have 74.8 Mta capacity, of which 35 % is in the North and 28 % is in the West. Third largest cement producer is still the Jaypee Group, which had a cement capacity of 39.0 Mta in FY 2013, but because of its large debt the company was forced to transfer some of its plants to Ultratech and to Dalmia Cement. Two of the flagship plants of Jaypee are the cement works in Baga (Fig. 9) and Rewa (Fig. 10).
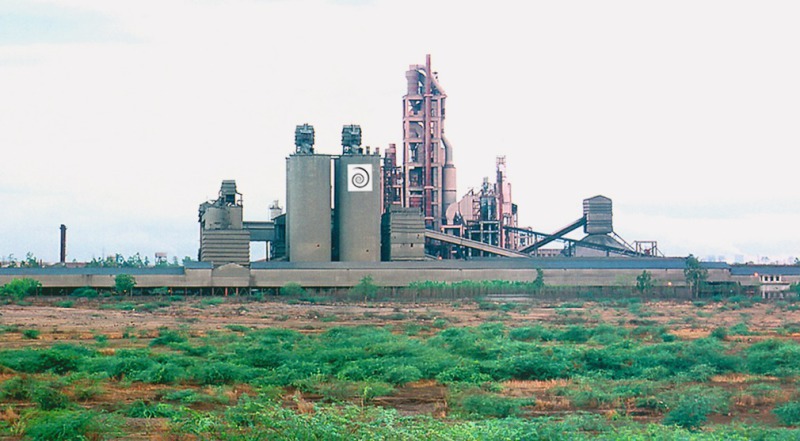
The next places in the ranking are now held by Dalmia, Shree Cement, Birla Corp., India Cements, Century Cement and Ramco Cement. These companies have cement capacities ranging from 12.4 to 24.0 Mta. Dalmia Bharat Limited increased its stake in OCL India via its subsidiary DCBL from 48 % to 74.6 % and nearly doubled its capacity to 24.0 Mta, closely followed by Shree Cement with 23.6 Mta capacity from 12 plants (Fig. 11). Birla Corp. now comprises 15 Mta capacity after the takeover of the former Lafarge Jojobera and Sonadith cement plants. Slightly unchanged in the last few years is India Cements. Century Cement comprises 12.8 Mta capacity, but a merger with the other BK Birla Goup companies Kesoram and Mangalam Cement is still on the agenda. Ramco, the former Madras Cement, grew to 12.4 Mta cement capacity.
No. 10 in ranking will be kept by HeidelbergCement after the merger with Italcementi. In 2013 HeidelbergCement has increased its own capacity in India to 5.6 Mta, while Italcementi will bring in 5.8 Mta capacity from Zuari Cement (Fig. 12). So the market share of the merged company is 3.0 %. Next places in the ranking go to Chettinad Cement (11.3 Mta), JK Cement (8.8 Mta), My Home (8.4 Mta), Vicat Group (7.8 Mta) and Kesoram Cement (7.3 Mta). In general the participation of international majors in India includes only Lafarge-Holcim, HeidelbergCement, Vicat (Fig. 13) and CRH, which have a 50 % participation in My Home Cement. These international majors have less than 25 % of the capacity under control, while the national companies control 75 %.
3.3 Latest market trends
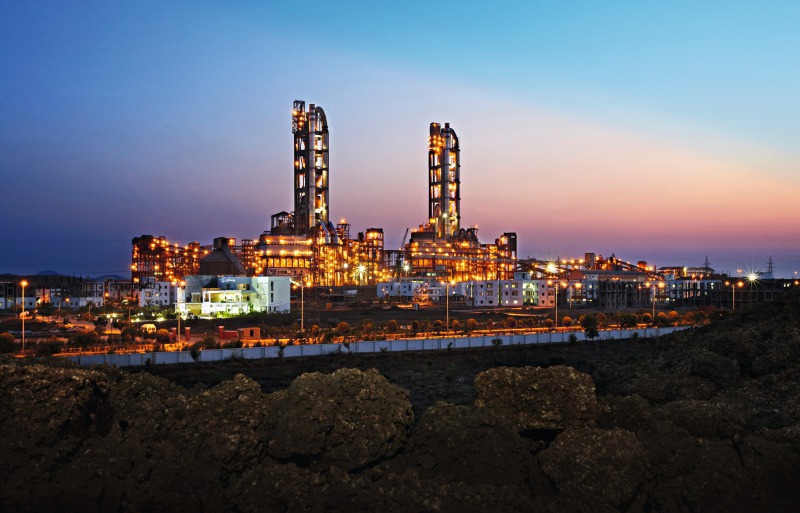
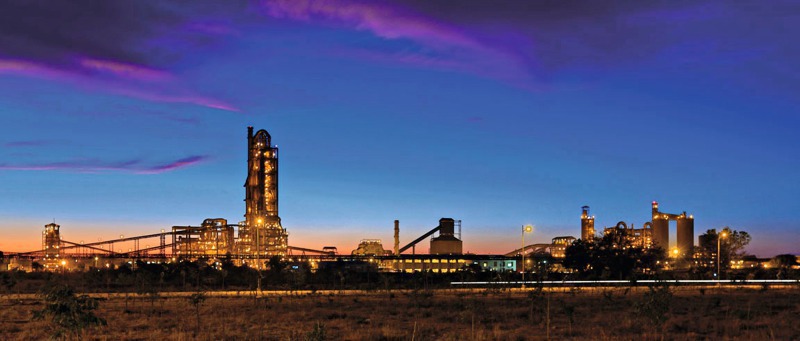
Apart from the mergers & acquisitions in India, the cement industry has not changed much. The prices are recovering a little, the share of blended cements is still rising and the use of alternative fuels is increasing, especially since the new Technology Roadmap was released in 2013, which targets CO2 emission reductions. However the fuel substitution rates are still low, when compared to European levels or to the advances in Brazil. However, it is undisputed that the Indian cement plants are leading in terms of low energy and electricity consumption. This has on the one hand to do with the huge amount of new capacity (Fig. 14) with pre-calciners that have been installed and on the other hand with the efforts of the plant owners and managers to set the benchmarks. The low electricity requirement has mainly to do with the installation of modern grinding systems such as vertical roller mills and HPRG (high pressure grinding rollers) and the large amount of fly ash that is used in cement.
4 Cement industry outlook
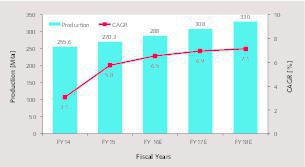
Figure 15 summarized the projection of the cement production by FY 2018. The CAGRs are projected to increase steadily from 5.8 % in FY 2015 to 7.1 % by FY 2018. This will result in a cement production of about 330 Mta, compared to 270 Mta last fiscal year. The average CAGR is projected at 6.9 %, compared to 6.0 % the period before. We believe that the resulting cement consumption in FY 2018 will be around 345 Mta, which corresponds to a per-capita cement consumption of 251 kg, which is an increase of 36 kg within three years from the 215 kg level in FY 2015. Furthermore it is expected that imports will slightly increase and that exports will stay at a relatively low level.
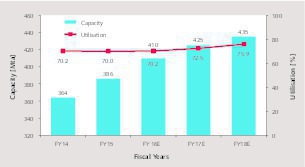
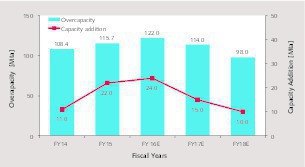
The development of the cement capacity expansion and of the capacity utilization is summarized in Figure 16. From the projection, capacity will increase from 386 Mta in FY 2015 to 435 Mta in FY 2018, which corresponds to an average CAGR of 4.1 %, which is much lower than the projected production CAGR of 6.9 %. Accordingly the capacity utilization will rise from 70.0 % to 75.9 %. Figure 17 shows the projected development of the capacity additions and of the overcapacity at 100 % utilization. While the new additions will decrease from 24 Mta in FY 2016 to 10 Mta in FY 2018, the overcapacity will decrease from 122 Mta to 98 Mta.
5 Final remarks
FY 2015 showed new growth in India’s cement industry. With increasing GDP growth as well as reforms and investment measures by the Government the cement industry should do better in the next few years. More caution in capacity expansion will keep the capacity utilization rates growing. This will lead to a better return of investments and healthier profits. However, caution is also necessary in the projection of the future growth in the per capita cement consumption, as long as the urbanization rate will be relatively low. So in our opinion urbanization development is the key parameter in the future cement demand.
Überschrift Bezahlschranke (EN)
tab ZKG KOMBI EN
This is a trial offer for programming testing only. It does not entitle you to a valid subscription and is intended purely for testing purposes. Please do not follow this process.
This is a trial offer for programming testing only. It does not entitle you to a valid subscription and is intended purely for testing purposes. Please do not follow this process.
tab ZKG KOMBI Study test
This is a trial offer for programming testing only. It does not entitle you to a valid subscription and is intended purely for testing purposes. Please do not follow this process.
This is a trial offer for programming testing only. It does not entitle you to a valid subscription and is intended purely for testing purposes. Please do not follow this process.