India beats the economic crisis
Summary: India has been largely spared by the global economic crisis. Although the country’s economic growth decreased to 6.7 % in 2008 after 9 % previously, the Economic Advisory Council in India is already forecasting a slightly increase to 7.7 % for 2009. For the next three years, India will have an increase in cement consumption of around 10 % per year. Up to the end of FY 2012, the per capita cement consumption is expected to rise from the present 153 kg to 193 kg. New cement production capacities will increase by at least 83 Mta in the next three years, which exceeds the forecast of 55.6 Mta growth in cement output by 49 %. Correspondingly, a distinct deterioration in capacity utilization has to be expected, from the present 83 % to 78 % or less.
Mahatma Gandhi coined the phrase “India lives in its villages”. Even today, 71 % of the 1.17 billion population of India live in the countryside. However, as a consequence of the economic development, a dramatic urbanization has taken place in recent years. The UN’s Urbanisation Report [1] forecasts that from 2007 to 2025 an additional 197 million people will populate the towns and cities of India and by 2050 this figure will increase by a further 377 million. The proportion of urban population will thus rise to 37.2 % by 2025 and then to 55.2 % by 2050. Cities like Mumbai,...
Mahatma Gandhi coined the phrase “India lives in its villages”. Even today, 71 % of the 1.17 billion population of India live in the countryside. However, as a consequence of the economic development, a dramatic urbanization has taken place in recent years. The UN’s Urbanisation Report [1] forecasts that from 2007 to 2025 an additional 197 million people will populate the towns and cities of India and by 2050 this figure will increase by a further 377 million. The proportion of urban population will thus rise to 37.2 % by 2025 and then to 55.2 % by 2050. Cities like Mumbai, Delhi and Calcutta will have populations of 26.4, 22.5 and 20.6 million by 2025. Other sources forecast that the number of Indian cities with a population of more than one million will increase from the present 33 to over 56 in 2025.
India has been largely spared by the global economic crisis. Although the country‘s economic growth decreased to 6.7 % in 2008 after 9 % previously, the Economic Advisory Council in India is already forecasting a slightly increase to 7.7 % for 2009. This may be due firstly to the fact that India still has a large rural population, and that economic factors have little influence on “life in the countryside”. Secondly, the overwhelming victory of the Congress Party in the parliamentary elections in May caused a very optimistic mood in the population and boosted the country‘s share index. The rupee and Indian bond issues also increased significantly in value. The market regarded the re-election of Prime Minister Manmohan Singh as a sign for stability, continuity and growth. Particular hopes are placed on the continuance of reforms.
The 11th Five-Year Plan (2008-12) of the Indian government allocated a sum of US$ 492 billion for infrastructure projects. Annual spending will be more than doubled to more than US$ 100 billion in 2009. This measure is intended as a means of stimulating the slow growth of the building and construction sector. In 2005 and 2006 this sector‘s growth still exceeded 16 %, but in the fiscal year 2008/2009 (01.04.08–30.03.2009) it slumped to 7.2 %. The investments are especially intended to promote the extension and improvement of the road and railway networks, the airports and harbours, and to crank up infrastructure projects on the power generation and telecommunication sectors. The national housing requirement is 74 million units. Substantial tax incentives are to be provided for new housing units completed by March 2010. Furthermore, favourable credit rates are available for home purchases and housing construction.
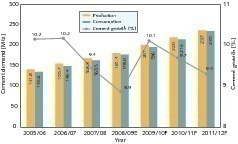
In the fiscal year 2009 (calendar year 2008/2009), cement production in India rose by 7.8 % to 181.4 Mta (million tonnes per year) in spite of the worldwide economic crisis. These figures do not include the cement output of mini cement plants. Cement consumption increased in 2009 by 8.9 % to 178 Mta (Fig. 1), this figure containing the imports but not the cement output of mini cement plants, which was about 6.2 Mta. Correspondingly, the calculated per capita cement consumption was 153 kg, or 159 kg if mini cement plants are included. This difference should be kept in mind, because the data published in other sources for India‘s cement consumption and cement dispatch differ greatly, in some cases because the calendar year is used instead of the fiscal year (FY). India is expected to have approximately two-digit growth in the coming years; the figures stated in this report are on the conservative side compared to those of local sources.
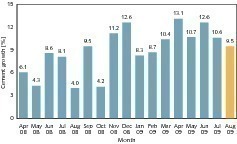
Some forecasts derived from the present monthly (YoY) growth rates see a 12 % growth in cement consumption for FY 2010 (Fig. 2). However, in the case of the figures for June 2009, it must be taken into account that the monsoon season had not commenced as usual before that point of time, so that the construction sector had an above-average utilization in that month. In August, the estimated growth of 9.5 % already shows a decline. On the production side, figures are being increasingly affected by the import and export policies of the Indian government. The export ban for cement that was decreed in April 2008 was intended to prevent an excessive rise in prices. However, in practice only the main exporters like Ambuja Cement, Grasim, Sanghi Cement and the Metha Group in the west of the country were affected, who mainly export to Bangladesh and the Middle East.
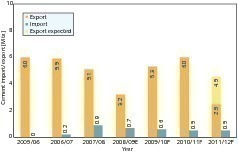
Figure 3 shows the development of the Indian cement industry‘s imports and exports. It shows a drop in exports from 6.0 Mta of cement in FY 2006 and FY 2007 to approx. 3.2 Mta, because the export ban was upheld at least until the middle of December 2008. In contrast, imports rose in FY 2008 to 0.9 Mta, 78 % of which came from Pakistan alone. In FY 2009, however, the imports of Pakistani cement had again fallen to 0.67 Mta, despite the fact that no import duties were levied. A further reduction is expected for this year. On the other hand, exports increased strongly again in this year, approximately reaching their old level. This will presumably continue for one year until the increasing self-sufficiency of present importing countries causes cement exports to decline.
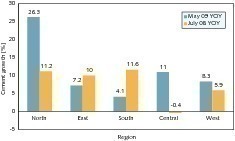
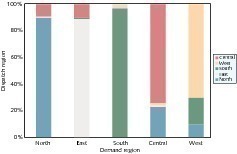
In India itself, the regions have shown greatly differing growth rates. Figure 4 compares the cement sales for the country‘s regions in two selected months, each related to the corresponding month of the preceding year. In the two periods of time, the growth in cement consumption shifts in the direction of the North and Central Indian regions, while the South and East Indian regions have a rather low growth. One indication of the regional cement deliveries can be obtained by combining the demand region (ordinate) with the dispatching region (abscissa) of Figure 5. This reveals which dispatching region provided the consumed cement. Traditionally, for instance, some of the cement produced in the North goes to the West and Central regions, some of the cement produced in the Central region goes to the Eastern region. The only “self-provider” is the Southern region.
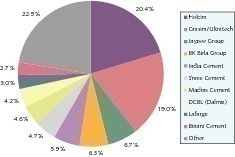
In India there are still 52 cement producers. This figure does not include the holdings, but only the legally independent manufacturing companies. The number of cement factories is 145, which includes 37 pure grinding plants. Considerable changes have occurred in the TOP 10 since the last analysis [2] (Fig. 6, Table 1). At their nominal capacity, the TOP 10 companies have a market share of 77.5 %, whereby the TOP 5 alone have a share of 58 % in the capacity.
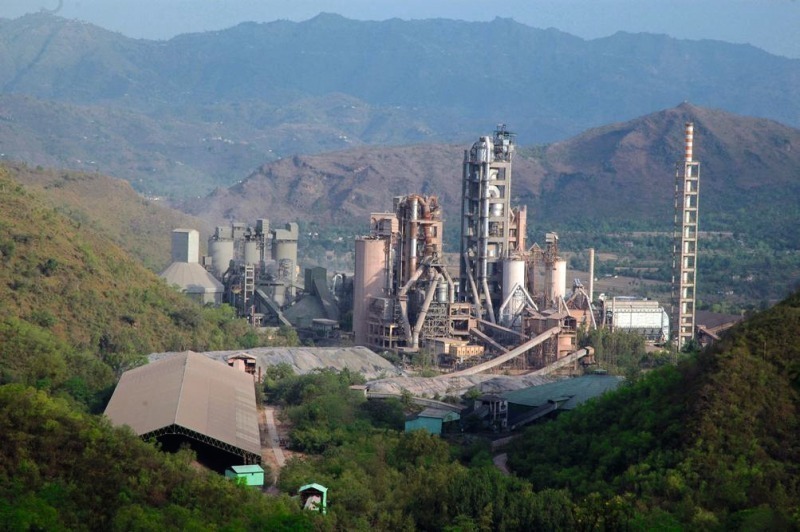
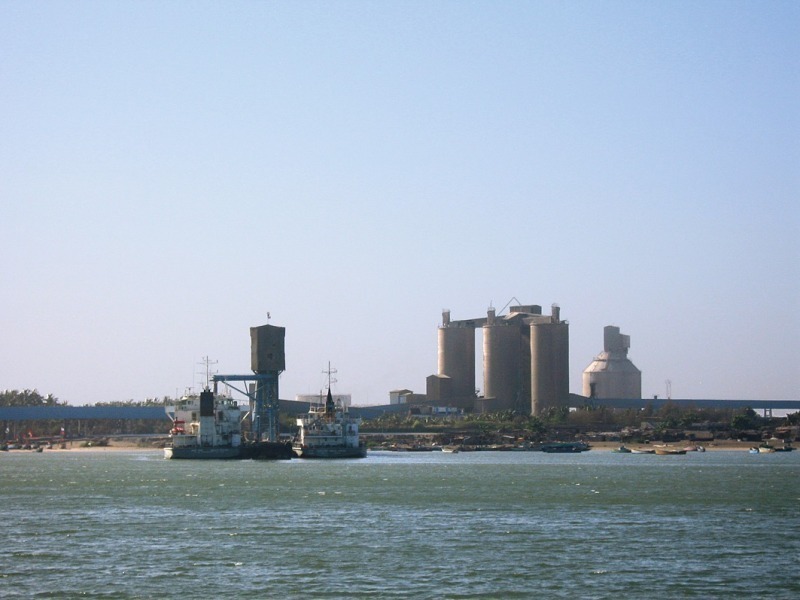
The market leader in India is Holcim with a cement production capacity of 44.6 Mta or 20.4 % market share from its equity interests in ACC and Ambuja Cements (formerly Gujarat Ambuja). The company’s capacity has thus increased by 6.4 Mta since 2007. Holcim owns a total of 24 plants, of which 9 are separate grinding plants. 13 plants (incl. 3 split grinding plants) with a capacity of 22.7 Mta came from ACC, including the 4.4 Mta Gagal plant (Fig. 7) in Himachal Pradesh. Ambuja Cement, which absorbed die Ambuja Cement Eastern Ltd. in 2006, meanwhile owns more than 11 cement works (of which 6 are grinding plants) and has a capacity of 21.9 Mta. Ambuja is one of India‘s most important cement exporters (Fig. 8). In 2005, Holcim entered into a strategic alliance in order to take over ACC [3]. Ambuja Cement was consolidated as from May 2006. Present equity interest in ACC amounts to 46.2 % while it is 45.7 % in the case of Ambuja Cement. ACC intends to expand its “captive power generation” to 16 plants with a capacity of 351 MW by 2010.
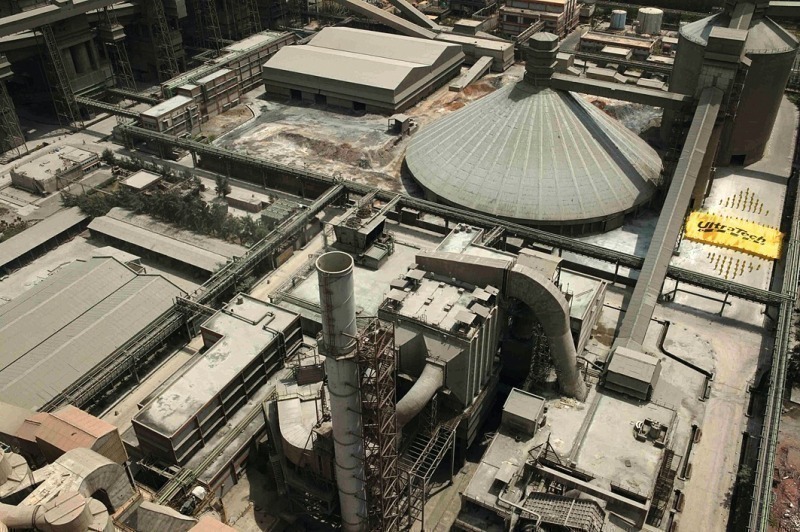
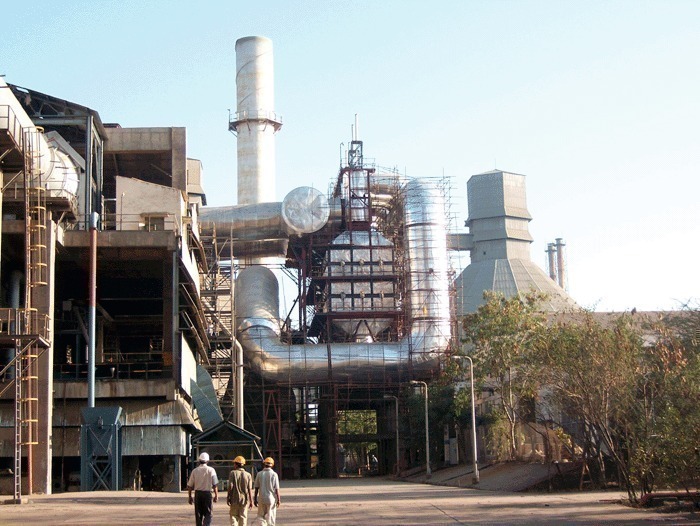
Grasim and Ultratech have a cement production capacity of 41.6 Mta from a total of 21 plants (of which 10 are separate grinding plants and 1 white cement production line with 0.5 Mta), resulting in a market share of 19 % and 2nd place in the rankings. These companies are members of the Aditya Birla Group. Since 2007, capacity has been raised by 9.9 Mta, the most important new factories/extensions being Tadpatri, Kotpuli and Shambhupura I. Of the current capacity, 21.9 Mta belong to Grasim and 19.65 Mta to Ultratech. Ultratech (formerly L&T) originally brought in five integrated plants and five separate grinding plants, including the 5.3 Mta cement factory in Gujarat (Fig. 9). Plans foresee an increase in cement production capacity to 48.8 Mta by the end of FY 2010. In the same period, own electricity generation from captive power plants and waste heat utilization (Fig. 10) is to be raised to over 500 MW from the 144 MW of FY 2007. In the ready-mixed concrete sector 43 new plants were constructed in the last two years. The proportion of bulk cement is correspondingly rising at Grasim / Ultratech reflecting the trend all over the country.
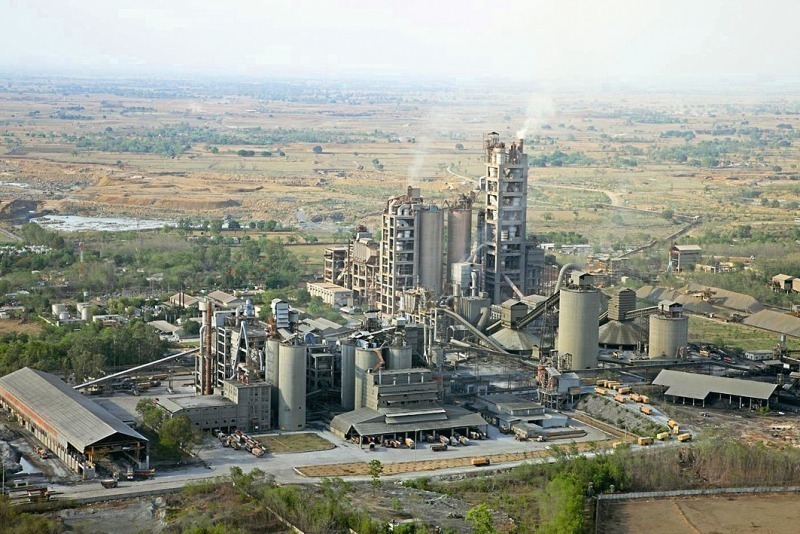
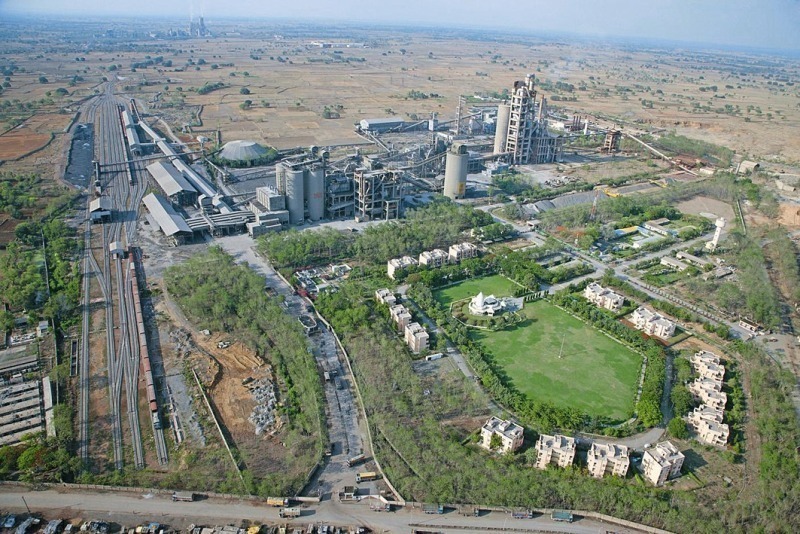
The Jaypee Group (JAL Jaiprakash Associates Ltd.) has made the biggest leap forward in the TOP 10 and now ranks third with 14.7 Mta from a total of nine plants (including three grinding plants). The Rewa plant (Fig. 11) has a capacity of 3.0 Mta, while that of the Bela plant (Fig. 12) is above 2.4 Mta. In 2006, Jaypee took over UP State Cement, which was in liquidation, thus gaining 2.5 Mta of capacity. A new 2.5 Mta grinding plant is being built at Jaypee Himachal. Up to the year 2010 Jaypee intends to have a cement production capacity of 26 Mta and aims to generate 340 MW from captive power. BK Birla has a cement production capacity of 13.9 Mta and owns the cement producers Century Cement, Maihar, Manikgarh, Vasavadatta and Mangalam (Fig. 13). Insiders believe that after the retirement of the almost 90-year-old Chairman Shri B.K. Birla, at least part of the business will be taken over by his grandson Shri Kumar Mangalam Birla, who is the Chairman of Aditya Birla.
The companies in places 5–8: India Cement, Madras Cement, Shree Cement and DCBL are local cement producing groups which have also significantly expanded their capacities in recent years. At present, India Cement has 12.9 Mta, Shree Cement 10.3 Mta, Madras 10.0 Mta and DCBL 9.2 Mta. Shree Cement, the biggest producer in North India, has thus grown by 4.3 Mta from the last reported figure of 6.0 Mta. Its Bewar site is equipped with two kiln lines, while four further kiln lines are installed at the Bangur City or RAS plant (Fig. 14). In Khuskhera a cement grinding plant has been put into operation. The company wants to have 250 MW of captive power by 2010. The Dalmia Group (DCBL and Dalmia Family) have a 45.7 % shareholding in OCL in Orissa, giving them influence over a cement production capacity of 10.5 Mta. Their largest plant (Fig. 15) is that in Puram (TN), with 4.0 Mta.
Lafarge India and Binani are also represented in the Top 10 with 6.5 Mta and 6.0 Mta respectively. Lafarge has been active on the Indian cement market since 1999, when it took over TISCO, and now owns 4 plants (2 of them grinding plants). The company states that the takeover of L&T Concrete with its 66 concrete plants has made it the biggest vendor of ready mixed concrete (RMC) in India, with 4.1 million m3 capacity and 25 % market share. Binani only owns 2 plants in India (Fig. 16). However, the company is one of the few local Indian cement producers with significant capacities outside the country. It owns a 1.2 Mta cement grinding plant in Dubai and two grinding plants (0.3 Mta clinker, 0.5 Mta cement) in Shandong Province, China.
Except for Holcim and Lafarge, foreign cement producers are no longer represented in the Indian TOP 10. Number 3 of the foreign companies is Italcementi with a capacity of 3.5 Mta and a majority shareholding in Zuari Cement. HeidelbergCement has a joint venture with Indorama Cement and shares in Mysore Cement, giving it a cement production capacity of 3.1 Mta. Cimpor has taken over a 53.6 % shareholding in Shree Digivay, which has a capacity of 1.0 Mta. In 2008, CRH took over 50 % of the holding of MHIL (My Home Industries Ltd) in Andhra Pradesh. Vicat has recently taken a 6.6 % stake in Sagar Cements (mini cement plants) and together with that company is planning to construct a new factory with a production capacity of 5.5 Mta.
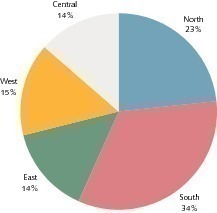
Most of the available information regarding the current effectively available capacity in India is contradictory. One reason for this is that nominal capacities have changed due to capacity increases and another is that some plants are no longer producing or have been shut down for a lengthy time already. The Cement Manufacturers Association (CMA) stated that the nominal capacity on 31.03.2009 was 219 Mta but the actual effective capacity is stated by one of the market leaders to be only 207.3 Mta. Approximately 34 % or 69 Mta of the effective capacity is stated to exist in the Southern Region (Fig. 17). The Northern Region with its 23 % or 48.3 Mta comes in 2nd place, followed by the Western Region (15 %). The Eastern and Central Regions share last place with 14 % each. Table 2 lists the project data for capacity expansions in FY 2010.
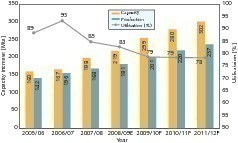
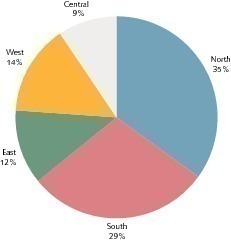
Figure 18 depicts the further development of nominal cement production capacities and capacity utilization. By FY 2012 cement production capacities will probably increase to about 300 Mta (excluding 10 Mta for mini cement plants) from the current 219 Mta. Although the considered growth of 83 Mta in the next 3 years includes all the now known projects with their planned years of commissioning, experience shows that postponements can occur and new projects might also be added or already planned projects might be cancelled. Figure 19 shows how the new capacity will probably be distributed over the regions. About 35 % will go to the North and 29 % to the South, which are the regions that got most of the new capacities in recent years. The three regions East, West and Central should together correspondingly get around 35 % of the new capacities up to FY 2012.
India should experience a rise in cement consumption of approx. 10 % per year for the next three years. Up to the end of FY 2012, the per capita cement consumption is expected to rise from the present 153 kg to 193 kg. The network for ready mixed concrete will be quickly extended and the share of bulk cement products will also increase to 20 % from the current figure of below 5 %. Thanks to improvements in the railway network and the carrying of bulk goods in railway wagons, transportation by rail will also take on more importance. New cement production capacities (Fig. 20) will increase by at least 83 Mta in the next three years, which exceeds the forecast of 55.6 Mta growth in cement output by 49 %. Correspondingly, a distinct deterioration in capacity utilization has to be expected, from the present 83 % to 78 % or less.
Überschrift Bezahlschranke (EN)
tab ZKG KOMBI EN
This is a trial offer for programming testing only. It does not entitle you to a valid subscription and is intended purely for testing purposes. Please do not follow this process.
This is a trial offer for programming testing only. It does not entitle you to a valid subscription and is intended purely for testing purposes. Please do not follow this process.
tab ZKG KOMBI Study test
This is a trial offer for programming testing only. It does not entitle you to a valid subscription and is intended purely for testing purposes. Please do not follow this process.
This is a trial offer for programming testing only. It does not entitle you to a valid subscription and is intended purely for testing purposes. Please do not follow this process.