India’s cement production capacities under pressure
 Source/Quelle: CEMfocus.com
 Source/Quelle: CEMfocus.com
 Source/Quelle: CEMfocus.com
 Source/Quelle: CEMfocus.com
 Source/Quelle: India Planning Commission
 Source/Quelle: ACC Limited
 Source/Quelle: CEMfocus.com
 Source/Quelle: ACC Limited
 Source/Quelle: Holcim
 Source/Quelle: CEMfocus.com
 Source/Quelle: KHD
 Source/Quelle: KHD
 Source/Quelle: FLSmidth
 Source/Quelle: Polysius
 Source/Quelle: KHD
 Source/Quelle: KHD
 Source/Quelle: Dalmia Cement
 Source/Quelle: FLSmidth
 Source/Quelle: Jaypee Group
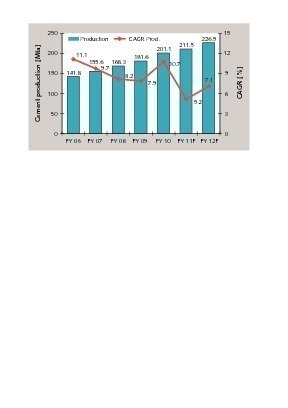
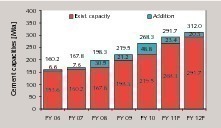
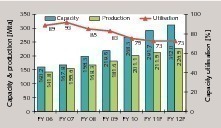
India’s cement production capacities grew by an annual average of 11.8 % over the last seven years. However, the cement production rate only rose by 8.1 % in the same period, so that capacity utilisation dropped from over 90 % to only 73 %.
1 Introduction
1 Introduction
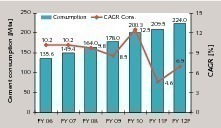
This report is only concerned with the market segment of major production plants. With a production volume of 212.5 million tonnes per year (Mta) in FY11, India is the second largest cement market after China. At the end of FY11, there was a total of 45 cement manufacturers with169 large plants and a cement production capacity of 291.3 Mta. This figure does not include 365 mini cement plants and white cement plants with a capacity of 11.1 Mta and a production volume of 6.0 Mta. As India has a low per capita cement consumption of 174 kg (FY11) although cement consumption has more than tripled since 1995 and cement consumption growth has always been higher than economic growth since 2001, the prospects with regard to future growth have been extremely positive. In 2011, the economic growth was 7.8 % after 10.1 % a year earlier. However, cement sales did not come up to expectations and production figures have recently faltered.
2 Cement production and consumption
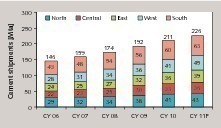
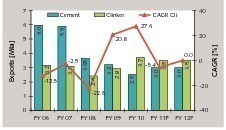
India is subdivided into five cement regions (Fig. 3): North, South, East, West and Centre. The Southern region has a share of 27.9 % in the consumption, followed by the Western region (19.9 %) and the Northern region (19.0 %). At present, the Centre region is showing the biggest growth rates. Figure 4 shows the course of export volumes for cement and clinker in the period FY06 until FY12. Cement exports fell in FY10 because of the high domestic demand, while clinker exports increased slightly due to the new surplus capacities. An analysis of cement exports in FY09, when all the major cement producers were organized in the CMA, the following ranking order results for the countries receiving the most exports from India: Iraq (0.65 Mta), Nepal (0.42 Mta), Qatar (0.25 Mta), Kuwait (0.14 Mta) and Sudan (0.1 Mta). India only exports 0.04 Mta or only 1 % of cement to Sri Lanka and Bangladesh. In the case of clinker exports in FY09, Nepal (0.51 Mta), the UAE (0.24 Mta) and Qatar (0.09 Mta) received the largest quantities.
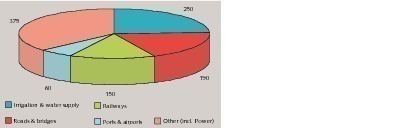
The country’s leading cement producing companies are maintaining a positive expectation for cement consumption in the coming years. Their forecast for the years following FY12 is a growth of more than 8.5 %. One reason for this is the government’s planned infrastructure spending of US$ 1025 billion in the twelfth 5-year plan from FY13 onward (Fig. 5). The proportion of PPP projects is to be increased. Roads and bridges, railways, irrigation facilities and water supply systems, harbours and airports make up more than 63 % of the planned investments. In recent years, the housing construction sector accounted for the lion’s share of cement consumption with a figure of almost two thirds. In the eleventh 5-year plan alone (covering 2008–2012) a requirement of 74 million housing units was specified. The urbanization rate is expected to rise from 29.0 % (2010) to 37.2 % in 2025, while the population will grow from 1189 million to about 1445 million in the same period. The number of cities with over a million inhabitants is expected to rise from 35 to 56 by 2025.
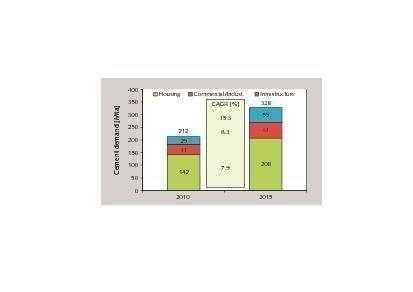
Fig. 6 shows the forecast cement consumption up to 2015 with the most important sectors. In 2010, cement consumption for housing construction alone was 142 Mta or 67 % of the depicted cement consumption of 212 Mta. The infrastructure sector accounted for only 29 Mta or 14 % of the cement consumption. The commercial/industrial sector consumed 41 Mta or 19 % of the total quantity. For 2015 a consumption volume of 328 Mta is forecast. The proportion accounted for by housing construction is expected to decrease to 63 % but the absolute quantity consumed by this sector should increase to 208 Mta with an average annual growth rate of 7.9 %. The largest growth rate will be shown by infrastructure projects with 15.3 % growth and an increase in cement demand of 59 Mta, giving this sector a share of 18 %.
3 Cement production capacities and utilization
Another conspicuous point is that a large proportion of the cement production capacity is provided by separate grinding plants (Fig. 9). Around 52 of the 168 major plants are so-called split grinding plants. The high number of grinding plants is primarily explained by the country’s small number of limestone deposits, which are practically restricted to only nine clusters (Karnataka, Andhra Pradesh, Gujarat, Rajasthan, Meghalaya, Chattisgarh, Madya Pradesh and Himachal Pradeh). Another reason is the required clinker transportation to neighbouring regions and markets. Moreover, the amount of composite cements produced has drastically increased in recent years [1], so that new grinding capacities became necessary. According to data from the CMA, the overall quantity employed of fly ash and granulated slag rose from 8.1 Mta in FY 01 to 37.7 Mta in FY07. Analysis reveals that the quantity of granulated slag only increased in this period by 3.4 Mta, while the quantity of fly ash used rose by 25.6 Mta.
The development of capacity utilization is depicted in Figure 10. This illustrates the increasing disparity between cement production capacity and actual output that has led to a decline in the capacity utilization figure. While capacity increased at an annual average of 11.8 %, cement output only achieved an annual average growth of 8.1 %. As a consequence, the capacity utilization dropped from 89 % to 73 %. It is logical that this has resulted in significant declines in profits. In addition, India like other countries is having to cope with rising fuel and energy costs that can only be partially compensated for by improvements in efficiency or the utilization of waste heat [2,3]. As a consequence, the new capacities have been placed under great pressure on the part of investors and cement plant owners. This pressure can only be reduced by improving sales on achieving higher plant utilization figures.
4 TOP cement producers
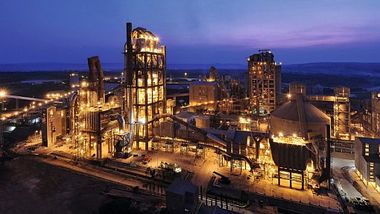
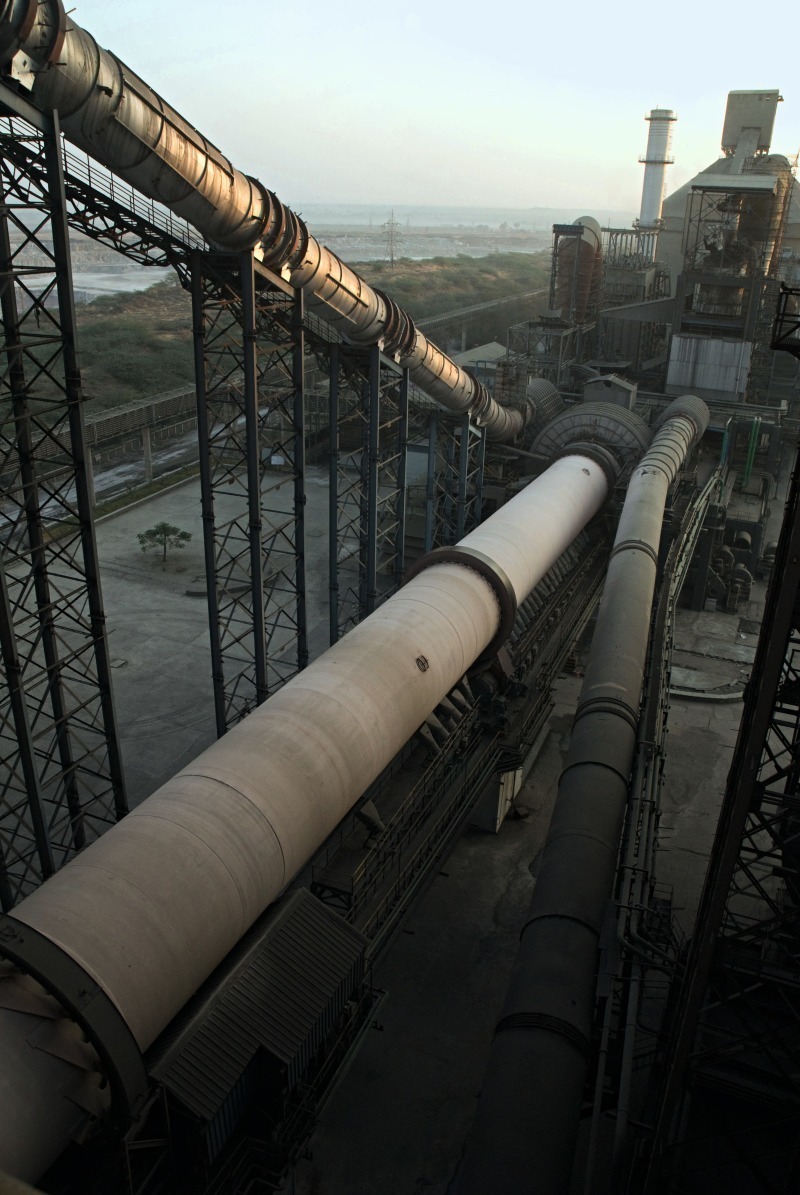
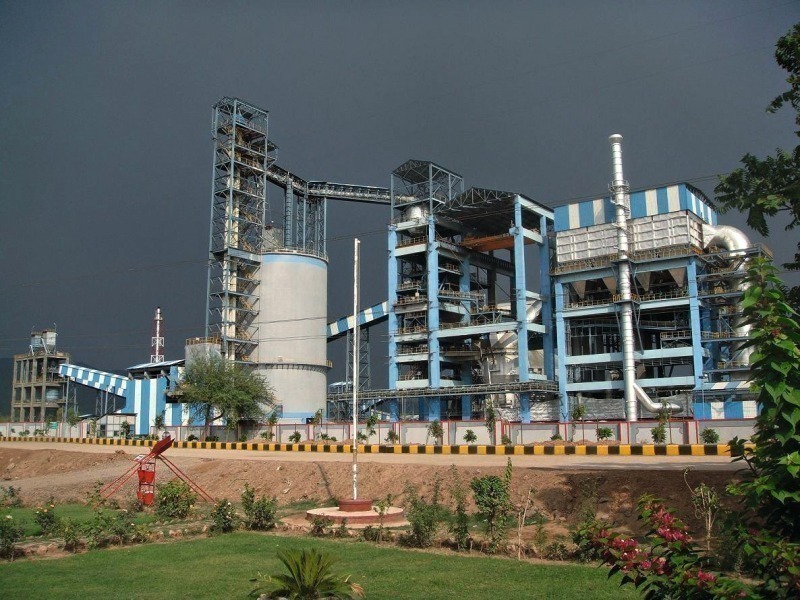
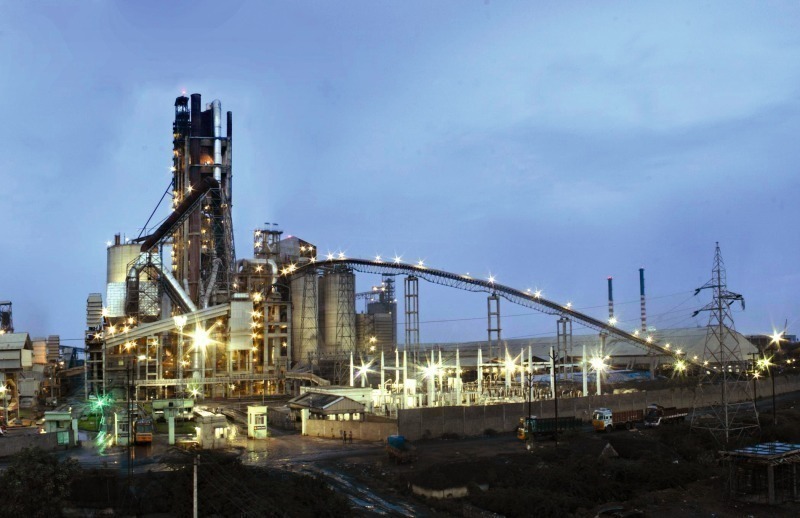
ACC Limited, like Ambuja Cement now a member of the Holcim Group, currently has a capacity of 30.0 Mta at nine integrated cement plants and seven grinding plants. The new 12 500 t/d line at the Wadi plant (Fig. 13) increased its cement production capacity by 5.0 Mta. In Chanda a new 7000 t/d clinker production line was put into operation. For Wadi, the separate grinding plants Thondebhavi, Kudithini and Vishakhapatan (Encore Cement) were built or acquired. ACC has so far not published any information about its future capacity expansion plans. Ambuja Cement is number 3 in the ranking with a capacity of 27.0 Mta at five integrated plants and eight separate grinding plants. The company’s latest new clinker production lines were brought on stream in Bhatapata and Rauri (Fig. 14) and grinding plants were started up in Bhatapara, Dadri, Nalagarh and Maratha. Also, the firm intends to construct a new 2.2 Mta plant in Nagaur, Rajasthan.
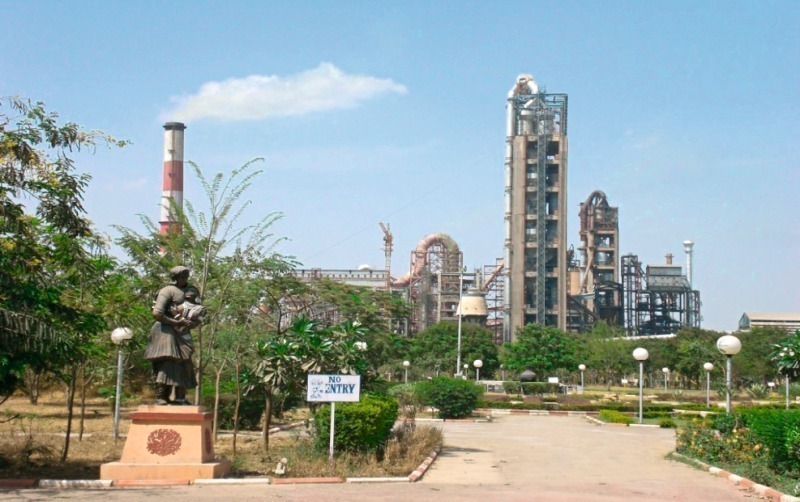
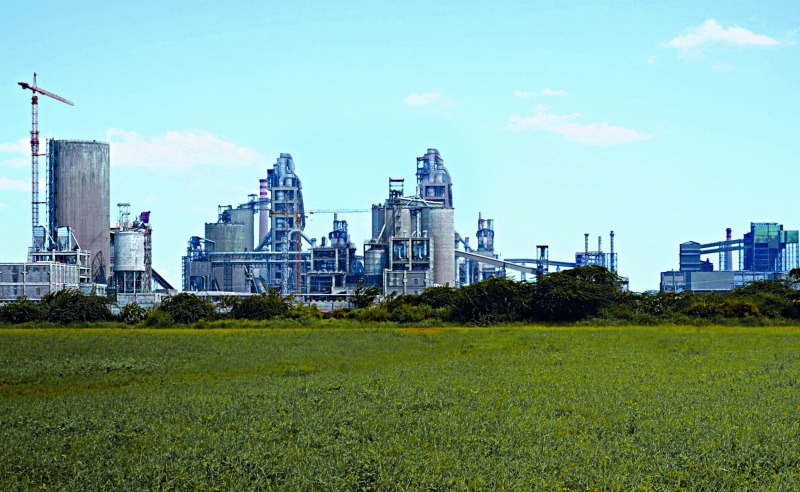
The company with the most dynamic growth is Jaypee Cement. In only four years, Jaypee has expanded its cement production capacity from 9.0 Mta to the current 26.2 Mta. By the end of the next fiscal year the company intends to have a capacity of 35.9 Mta. At present, Jaypee owns 6 integrated plants (Fig. 15) and 5 grinding plants. The most recent new additions were the clinker production lines at Jaypee Gujarat II and Wanakbori II and the Sikanderabad grinding plant. This year, two further grinding plants and 5 more clinker production lines are due to commence operations, among them the 5 Mta Balaji cement plant in the south of the country. Places 5 and 6 in the ranking are occupied by Shree Cement and Madras Cement with cement production capacities of 13.5 Mta and 12.3 Mta respectively. Shree Cement’s Ras plant (Fig. 16) is particularly impressive. Six identical lines are meanwhile producing cement at this site.
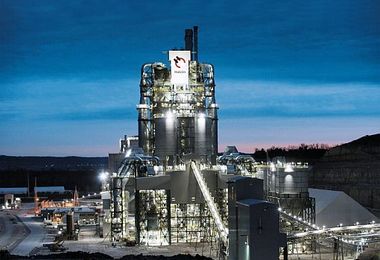
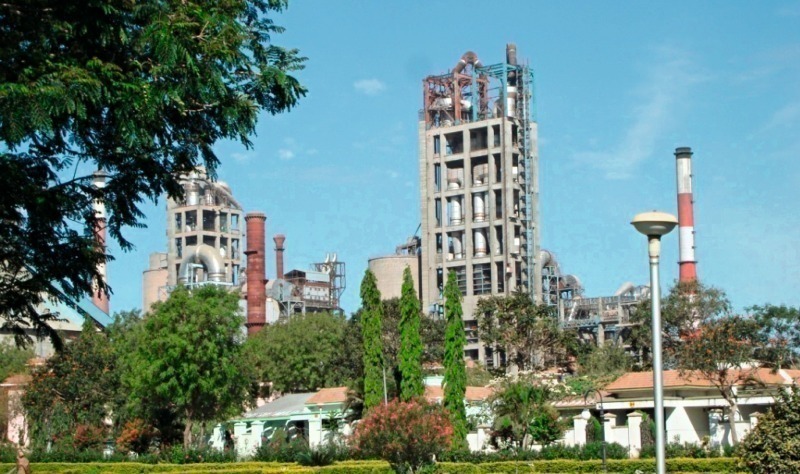
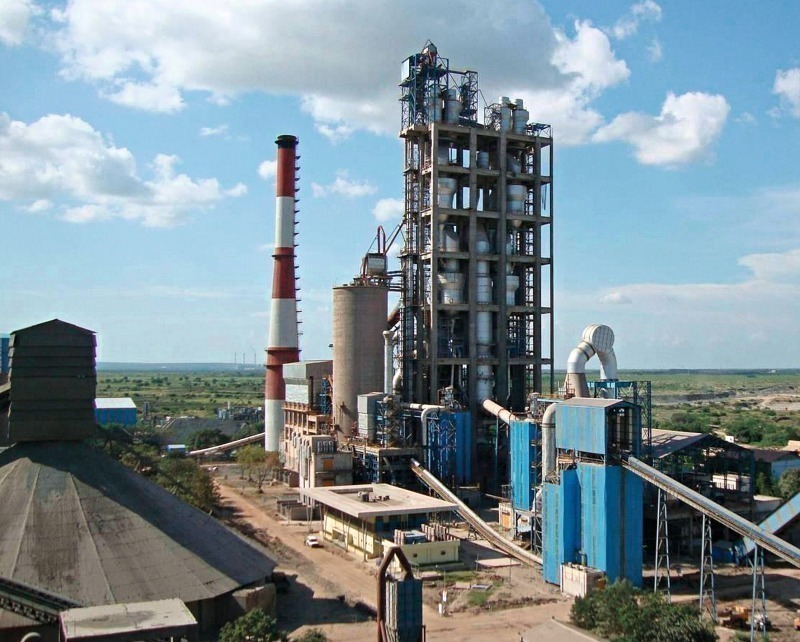
India’s TOP 10 cement producers also include Dalmia Cement with its capacity of 9.0 Mta at three integrated plants (Fig. 17), India Cements with 8.8 Mta, Century Cements (a member of the BK Birla Group) with 7.8 Mta and JK Cements with 7.5 Mta. Alongside Birla White, JK Cements is the largest white cement manufacturer in India. The list of other large cement producers includes foreign companies/shareholders like Lafarge, Italcementi (Fig. 18), Vicat, CRH and HeidelbergCement and also the Indian firms Binani Cement, Kesoram Industries, Cement Corp. of India, Chettinad Cement, Penna Cement and My Home Industries. Binani Cement is among the few Indian cement producing companies who have been active up to now outside their home country. Binani owns a 2.5 Mta cement factory in China and a 1.2 Mta grinding plant in Dubai.
5 Prospects
Überschrift Bezahlschranke (EN)
tab ZKG KOMBI EN
This is a trial offer for programming testing only. It does not entitle you to a valid subscription and is intended purely for testing purposes. Please do not follow this process.
This is a trial offer for programming testing only. It does not entitle you to a valid subscription and is intended purely for testing purposes. Please do not follow this process.
tab ZKG KOMBI Study test
This is a trial offer for programming testing only. It does not entitle you to a valid subscription and is intended purely for testing purposes. Please do not follow this process.
This is a trial offer for programming testing only. It does not entitle you to a valid subscription and is intended purely for testing purposes. Please do not follow this process.