Outlook on the Iranian cement industry
1 Introduction
The new Iranian year of 1388, which begins on 21.03.2009, promises to be an exciting one. For one thing, presidential elections are due to take place on 12.06.2009, and the result will set the political and economical direction of the country for the four years up to 2012. Moreover, the development of oil prices is critical for Iran’s economy. In the period 21.3. to 21.08.2008, high oil prices added US$ 43 billion to the national treasury. Experts assume that Iran’s oil economy goes into deficit at an oil price of US$ 58/barrel (US$/b), resulting in the danger of a national deficit, and forcing the government to tap the country’s financial reserves. At present, the oil price is below 50 US$/b. Analysts think it likely that by the 2nd half of 2009 the price will stagnate at 75 US$/b and that this situation will possibly continue until 2010. As a worst case scenario, a price stagnation at 50 US$/b is considered possible. It is clear that this development will have substantial consequences for government investments and investment aid for infrastructure projects, the construction industry and housing construction, and will thus directly affect Iran’s cement industry.
2 Economic development and resources
In recent years, Iran has experienced an impressive economic growth in spite of UN sanctions. Figure 1 shows the economic growth as well as the country’s surplus on current account. This reveals that the economic growth in 2007 was almost 6 %, while the current account surplus had grown to 10.4 % of Iran’s economic performance. These are excellent growth figures when one considers Iran’s restricted international economic relationships, particularly with the West. In fact, Iran was able to implement the most successful bilateral and international...
2 Economic development and resources
In recent years, Iran has experienced an impressive economic growth in spite of UN sanctions. Figure 1 shows the economic growth as well as the country’s surplus on current account. This reveals that the economic growth in 2007 was almost 6 %, while the current account surplus had grown to 10.4 % of Iran’s economic performance. These are excellent growth figures when one considers Iran’s restricted international economic relationships, particularly with the West. In fact, Iran was able to implement the most successful bilateral and international economic projects in the last two years. One of the central factors for this was the expansion of the country’s trade ties with China, which in 2007 ended Germany’s 30-year reign as main supplier. Alone in the first half of 2008, the Chinese volume of trade with Iran grew by 60 % compared to the preceding year. In addition, the trading hub of the UAE is playing a progressively greater role in the trade flow with Iran.
Iran is rich in resources. With its 138 billion barrels, the country possesses 11.2 % of the world’s assured oil reserves and is thus in 2nd place after Saudi Arabia. Moreover, Iran also has natural gas resources amounting to 27.6 trillion m3, i. e. 15.6 % of the world’s reserves, which again puts it in 2nd place, this time after Russia. There are also extensive deposits of minerals such as iron, copper and gold ore, as well as coal and limestone. The population of 71.2 million also provides a great potential; the quality of education and training in Iran is above average. However, the growth in liquidity due to the country’s oil income also has a negative side effect: the growing inflation. Figure 2 shows the trend of the rate of price increase in recent years compared to that of other countries in the region. Although Iran has the worst inflation, the entire Middle Eastern region is affected by a similar development.
A more precise analysis of the present situation reveals a somewhat different picture. The record income from the oil and gas business is partly used for an expensive subsidization of petrol prices. In spite of this, the rate of price increase in July 2008 reached the record level of 27.6 % (in towns) compared to the preceding year. In September, the inflation rate was said to have reached 29 %. The cost of foodstuffs allegedly even shot up by 50 %. In the winter months, gas exporter Iran will experience a shortfall of approx. 1/3 or 10 million m3 daily for its domestic gas needs. In view of all these difficulties, the head of the Iranian Central Bank has been changed twice within a relatively short period of time. A decision is due to be taken within the next few months on a planned monetary reform involving the introduction of a new currency. All these circumstances point to structural weaknesses in the country’s economy and to home-made problems.
3 An overview of the cement industry
After a relatively modest growth phase from 2003 until 2005, Iran’s cement industry has shown an excellent development (Fig. 3). From 2005 to 2007, cement production grew from 32.5 million t per year (Mta) to 41.0 Mta [1]. This corresponds to an increase of 8.5 Mta or 26.2 % in two years. In the same period of time, cement consumption leapt by 10.2 Mta from 31.0 Mta to 41.2 Mta, which is a rise of 32.9 % in two years. High export duties throttled the export rate in the last two years to practically zero. In 2007, only 0.3 Mta left the country after 1.8 Mta in 2005, and this low figure consisted mainly of white cement.
Imports have remained almost unchanged at a low level in recent years, which is due to the relatively low price level of below 50 US$/t [1]. The government has now accepted a price rise of approx. 20 % to 55–65 US$/t.
Figure 4 depicts the change in per capita cement consumption since 2003. There is a visible stagnation between 2003 and 2005 with practically constant consumption figures of around 450 kg. Since 2005, the per capita cement consumption has risen by 133 kg, with annual increase rates of 14.8 % and recently 15.7 %, to reach the current 579 kg. The population is increasing by 1.6 % annually. Municipal areas hold 71 % of the country‘s population. The largest cities are Tehran (7.1 m), Mashad (2.4 million) and Esfahan (1.6 million). 81 towns in Iran have a population in excess of 100,000 (all population data relate to 2006 and the 1385 Census). The country has a relatively low population density with 43 inhabitants per km2.
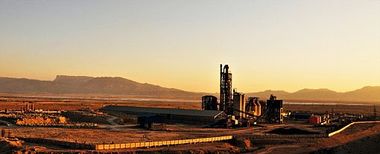
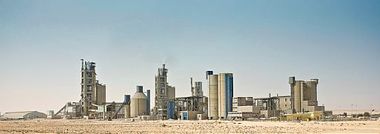
In 2007, there were 49 grey cement plants in Iran, with a total of 74 kiln lines and a cement production capacity of 50.6 Mta. There are also five white cement plants with six kiln lines and a production capacity of 0.91 Mta. Figure 5 and Table 1 show the shares of the most important players in the grey cement production capacity. At present there are seven cement groups and ten other producers, which are mainly in private ownership. The market leader is the Fars & Khuzestan Cement Company (FKCC) with a cement production capacity of 17.6 Mta and a market share of 34 %. FKCC owns the 17 grey cement plants of Abyek, Behbahan, Bojnourd, Doroud, Fars, Fars nov (Fig. 6), Ghaen*, Gharb, Khash, Khazar, Khuzestan, Kohkilouyeh*, Saveh Grey, Sharoud, Soufian*, Urumia* and Zanjan*, as well as the white cement plant of Neiriz White. The parent company of FKCC, the Social Security Investment Co. (Tamin Group) is the majority shareholder of the plants marked with an asterisk.
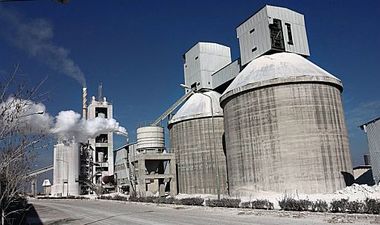
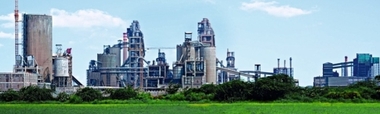
The second-placed company is Tehran Cement with a capacity of 6.6 Mta from a total of six plants. Tehran Cement owns modern production facilities (Fig. 7) with its plants Hegmatan, Ilam, Loshan, Safaeh, Tehran and THR 7th U.
Close on the heels of Tehran Cement follows Bank Melli Iran Investment Company (BMI), whose subsidiary CIDCO (Cement Investment and Development Company) is a majority shareholder in five cement plants with a total capacity of 6.5 Mta, representing a market share of 13 %, like that of Tehran Cement. Among the cement factories owned by BMI are Firouzkouh, Kerman, Mazandaran, Momtazan Kerman (Fig. 8) and Shomal. As the participation of individual shareholding companies in cement plants sometimes varies over the course of time, the situation is often complex and rather difficult to analyze. For instance, the current shareholding situation at Mazandaran Cement is: Shomal owns 25 %, Kerman Cement 20 %, FKCC 17 %, Sanat Madan 15 %, Tar & Toseaeh 9.8 % and others 13.2 %. BMI is the 100 % owner of Tar & Toseaeh and is also the majority shareholder of Shomal and Kerman.
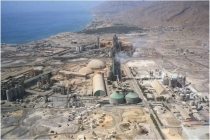
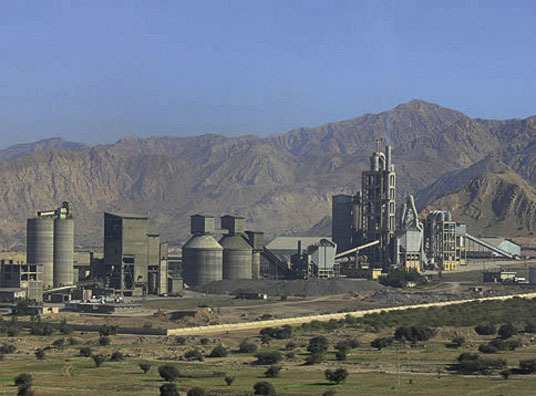
The further rankings are taken by Ghadir Investment, which is the majority shareholder of Sepahan Cement, Shargh (Fig. 9) and Kordestan, and thus has a cement production capacity of 5.3 Mta, and Ehdas Sanat with a capacity of 3.0 Mta at its three plants Darab, Dashtestan (Fig. 10) and Sharekord. Ehdas Sanat is the project development company in the Iranian cement industry. It builds cement factories not only in Iran, but also abroad (including Syria and Venezuela) and then sells the factories (Kash, Kordestan, Ardebil, Hegmatan 1+2 and Khuzestan). One of the beneficiaries has been Holcim, whose 49.9 % stake in the Espandar Investment Company gives it a participation in the 2.8 Mta production capacity of the Ardebil (Fig. 11), Ekbatan, Faraz Firouzkuh and Kavir Kashan plants and consequently a market share of 6 %. Up to now, Holcim is the only “global cement player” to have successfully positioned itself in Iran.
Omid Investment’s participation in Hormozgan Cement (Fig. 12) has up to now only involved one plant with a capacity of 1.8 Mta. The remaining cement producers are Abadeh Cement, Ardestan Cement (Fig. 13), Bohrouk Yazd Cement, Esfahan Cement, Estahban Cement, Karoon Cement, Lar Sabzevar Cement, Larestan Cement and Omran Anarak Cement and Zaveh Torbat Cement (Fig. 14). The five white cement plants in Iran are owned by three producers. FKCC operates the plants Neyriz White and Saveh White, accounting for a production capacity of 0.5 Mta. BMI owns the two plants Benvid White and Shomal White with a total capacity of 0.3 Mta. Urmia White has one white cement plant with a capacity of 0.2 Mta.
The average cement production cost of 45 US$/t is comparatively low and, in view of the rising prices, offers cement companies a good profit outlook. Figure 15 shows the distribution of the present production costs over the most important cost groups. Depreciation and financing costs make up almost half the average production costs with approx. 22 US$/t. Fuels and energy only cost 7 US$/t, representing 15.5 % of the total expense. This is due to the fact that prices are very favourable, with electricity costing less than 4 Cents/kW, oil 3 Cents/l and gas 2.5 Cents/m3 [2]. Costs for raw materials are also relatively low, at 3 US$/t.
4 Regional development
Up to now, figures relating to regional cement developments within Iran have been either non-existent or very scarce. For this reason, the 30 provinces of Iran have been grouped in the following into eight regions. Figure 16 shows the population densities of the regions, which vary from seven inhabitants/km2 in the “Central Plain” region to 233 inhabitants/km2 in Northern region, which includes the cities of Tehran and Karaj. It will be seen that the greatest population density exists in the north and west of the country. The largest populations are to be found in the Northern region with its 21.5 million inhabitants, followed by the “Central Mountain” region (16.2) and Northwest (10.1). Of over 150,000 building permits granted (excluding Tehran), almost 32 % were in the “Central Mountain” region. The fact that 18 % were granted in the sparsely populated Southwest region is explained by the reconstruction of buildings destroyed by the earthquake in that region (all figures for 2006).
Table 2 allocates the existing cement plants to the eight regions. It will be seen that there are grey cement plants in all the regions, while white cement plants are present in only three regions. The largest number of grey cement plants is to be found in the “Central Mountain”, North and Northwest regions. These three regions account for 63 % of all cement plants, 69 % of all kiln lines and 66 % of the country’s cement production capacity. The three regions “Central Plain”, South and Northeast have the smallest figures. Unfortunately, there are no accessible data relating to the regional cement consumption. For the purpose of estimation, figures from Vaseghi [3] were used. These contain production figures for 2006, but do not entirely correspond with the figures stated in Sect. 3. The data provided in Table 3 show that the cement plants in the regions have developed very differently in respect of output and capacity utilization.
5 Prospects up to 2012
During the coming years, Iran’s cement industry should be relatively resistant to global economic problems. However the expected fall in oil and gas income will hardly be conducive to a “high scenario”. On the basis of the 2007 figures, Figure 17 shows one possible scenario up to 2012. According to this, the cement consumption could rise in five years from 41.2 Mta to 96.4 Mta, i. e. significantly more than double. This scenario also anticipates that per-capita consumption will grow to 1,250 kg and that in the presidential election year the compound annual growth rate (CAGR) will climb to 25 % and then steadily decrease to 15 %.
63.4 Mta of new cement production capacity is planned for the period 2007 to 2012. This is made up of completely new cement plants (52.8 Mta) (Fig. 18), as well as new cement production lines in existing plants and the modernization of existing lines (10.6 Mta). Figure 19 shows the development of capacities with the expected capacity utilization. This assumes that Iran will export 3.0 Mta up to 2012. Given this consumption scenario, the capacity expansion that is taking place will lead to a surplus of cement in Iran and, due to the country’s lack of export possibilities, will probably result in significantly reduced capacity utilization figures. Better prospects can only be realistically expected under the precondition that the oil price again tops the 100 US$/b mark, which would permit more money to be pumped into the building and construction sector.
6 Conclusion
The Iranian cement industry is currently booming. According to hitherto unconfirmed reports, cement consumption in the first five months of the Iranian year 1387 (as from March 2008) rose by 21.5 % to 19.7 Mta. In the month of Mordad (22.7.–21.08.2008), it is stated that production output was 4.4 Mta which would represent an increase of 25.4 % over the preceding year. Presumably, there will be little change in this rapid growth of the cement industry in the coming years. It even appears realistic that cement consumption could more than double by 2012. The expectations of investors and cement producers, who have the intention of expanding cement production capacities to 107 Mta by 2012, are based on this forecast of a rapid increase in cement consumption. Moreover, the favourable production costs give rise to the expectation of significant exports. However, the problem is that cement production capacities are going to increase all over the region. Furthermore, there are appraisals which forecast a future decline in the cement trading volume [4].
Überschrift Bezahlschranke (EN)
tab ZKG KOMBI EN
This is a trial offer for programming testing only. It does not entitle you to a valid subscription and is intended purely for testing purposes. Please do not follow this process.
This is a trial offer for programming testing only. It does not entitle you to a valid subscription and is intended purely for testing purposes. Please do not follow this process.
tab ZKG KOMBI Study test
This is a trial offer for programming testing only. It does not entitle you to a valid subscription and is intended purely for testing purposes. Please do not follow this process.
This is a trial offer for programming testing only. It does not entitle you to a valid subscription and is intended purely for testing purposes. Please do not follow this process.