Ups and downs in the Middle East
 Source/Quelle: Bloomberg
 Source/Quelle: OneStone
 Source/Quelle: TCMA, OneStone
 Source/Quelle: TCMA
 Source/Quelle: OYAK
 Source/Quelle: OYAK
 Source/Quelle: HeidelbergCement
 Source/Quelle: Humbold Wedag
 Source/Quelle: Humbold Wedag
 Source/Quelle: OneStone
 Source/Quelle: Polysius
 Source/Quelle: CNBM
 Source/Quelle: Polysius
 Source/Quelle: OneStone
 Source/Quelle: Polysius
 Source/Quelle: FLSmidth
 Source/Quelle: irancement, OneStone
 Source/Quelle: Sepahan
 Source/Quelle: OneStone
 Source/Quelle: Humbold Wedag
 Source/Quelle: APCMA, OneStone
 Source/Quelle: Bestway
 Source/Quelle: Fauji Cement Company
Summary: Due to gigantic construction projects in the Gulf States, the cement industry in the region enjoyed high two-digit growth rates until the financial crisis occurred. Thanks to good capacity utilization figures, a high cement price level and favourable production costs, regional cement producers achieved profits of over 50 %. The cheap money available for the financing of investments triggered a massive expansion of cement production capacities. The problem of surplus capacity was ignored for a long time, but now that growth has in some cases come to a standstill, overcapacities are imminent. What are the current prospects for the cement industry in the region and for the most important countries of Turkey, Saudi Arabia, United Arab Emirates, Iran and Pakistan? This report provides a number of answers to these questions.
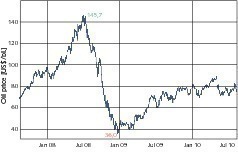
In political matters the Near and Middle East is often reduced to the Israeli-Palestinian conflict, the post-war reconstruction and terror bombing in Iraq, Iran’s nuclear programme, the war in Afghanistan and Islamic terrorism. From an economic viewpoint, the enormous oil wealth of the region dominates the headlines. Until summer 2008 the oil economy still seemed to be secure. Up to then, speculators had driven oil prices up to a record level in excess of US$ 145 per barrel (159 litres). Then came the US real estate crisis in summer 2008, which burgeoned into a worldwide...
In political matters the Near and Middle East is often reduced to the Israeli-Palestinian conflict, the post-war reconstruction and terror bombing in Iraq, Iran’s nuclear programme, the war in Afghanistan and Islamic terrorism. From an economic viewpoint, the enormous oil wealth of the region dominates the headlines. Until summer 2008 the oil economy still seemed to be secure. Up to then, speculators had driven oil prices up to a record level in excess of US$ 145 per barrel (159 litres). Then came the US real estate crisis in summer 2008, which burgeoned into a worldwide financial crisis during which Lehman Brothers had to file for bankruptcy in September 2008 and oil prices nosedived rapidly (Fig. 1). After banks wrote off financial assets worth billions of dollars, foreign investments involving hundreds of billions of petrodollars simply evaporated.
In the construction industry, the projects in Dubai were long regarded as the non plus ultra for records and unlimited growth. One symbol for this is the almost 830 m tall Burj Khalifa, the highest building in the world. In 2008, the United Arab Emirates (UAE) accounted for almost half of the Gulf States’ gigantic construction spending of US$ 2,500 bn. At the end of 2009, this sum was still at a level of approx. US$ 2,250 bn but the value of projects put on ice had risen significantly to around US$ 590 bn. In the Emirates alone, the value of suspended projects reached US$ 450 bn. Even state-owned enterprises such as Dubai World ran into trouble. However, for 2010 and subsequent years the prospects for growth have become rosier. Higher oil prices are again generating revenue for national treasuries and Saudi Arabia and the UAE have introduced infrastructure projects worth billions of dollars in order to reinvigorate the construction industry. These building projects range from roads, bridges, schools and universities up to airports and power stations.
This article defines the Middle East as the area stretching from Turkey through the Near East, the Arabian Peninsula with the Gulf States up to Iran, Afghanistan and Pakistan. This region is home to a population currently numbering approx. 500 million and expected to grow to approx. 540 m by 2013. In the region, the countries with the highest populations are Pakistan with 180.8 m inhabitants, Turkey (74.8 m), Iran (73.2 m), Iraq (30.0 m) and Saudi Arabia (28.7 m). The 20 m inhabitant mark is also exceeded in Afghanistan (28.4 m), Yemen (22.9 m) and Syria (21.9 m). The smallest countries in the region are Bahrain with 1.2 m inhabitants, Qatar (1.4 m), Kuwait (3.0 m), Oman (3.0 m) and Palestine (3.9 m). Israel and the Lebanon, which often dominate the political headlines, have just 7.6 m and 3.9 m inhabitants respectively.
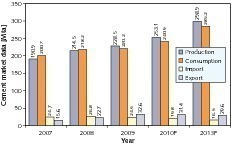
Figure 2 shows the development of cement demand in the region, extrapolated until 2013. From 2007 until 2008 cement consumption rose by 8.7 % to approx. 220 Mta. In 2009 cement consumption stagnated and the average per-capita consumption sank from 448 kg to 440 kg. Subsequent to this slump in cement consumption, it appears that an upswing of 9.4 % is possible in 2010. Up to 2013, an increase to 285 Mta or an average per-capita consumption of 531 kg is anticipated. The region is developing from a net importer into a net exporter of cement. Imports are set to drop by around 10 Mta in the period 2008 to 2013, while exports have already risen by about 14 Mta since 2007. The level of exports in 2013 will not be primarily governed by the high surplus capacities expected by that date, but rather by the worldwide changes in import needs and the regions to which cement can still be supplied.
According to [1], 195 cement factories and 33 grinding plants were in operation in the region in 2008, with a cement production capacity totalling 326 m tonnes per year (Mta). Furthermore, 122 new expansion projects are currently being implemented or are planned in the region. These projects would result in an additional cement production capacity of 180 Mta by 2013. Correspondingly, cement production capacity will increase to more than 500 Mta by 2013 if no existing inefficient capacities are shut down by that date. This would amount to an average annual rate of capacity increase of 8.9 %. Only a few of the world’s TOP10 cement producers are represented in the region so far. In 2008 these companies achieved a market share of only 9 % in the Middle East. As the leading company, Lafarge already has a capacity of 16.7 Mta (a 5.1 % market share).
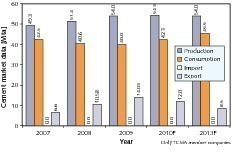
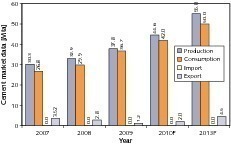
Cement consumption in Turkey remained approximately constant in 2009 at 40 Mta (Fig. 3). Cement output rose by almost 3.5 Mta, which is due to an increase in cement exports. For 2010 a slight decline in exports is feared, because important purchasers of Turkish exports are increasing their domestic production capacities. Local cement consumption is expected to rise by 5.8 % to 42.3 Mta. This will bring up the per-capita cement consumption from the last figure of 535 kg to 559 kg. Production will remain practically constant at 54 to 55 Mta. This constellation is not expected to change appreciably before 2013. Cement output will stay at today’s level of 54 Mta, with the emphasis shifting from exports to slightly higher domestic sales.
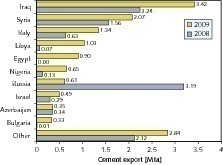
It is astonishing that Turkish cement producers managed to raise their cement exports by 3.5 Mta under the difficult market conditions in 2009. As illustrated by Figure 4, there were some drastic shifts in the importance of export destinations after exports to Russia slumped dramatically. The leading export destination is now Iraq with 3.4 Mta, followed by Syria (2.1 Mta) and Italy (1.3 Mta). Although Italy’s cement imports decreased significantly in recent years, Turkish exports made up 77 % of the imports in 2009. This is due to the relatively high shareholding of Italian companies in the Turkish cement industry. Turkey also increased its exports to Libya, Egypt and Nigeria.
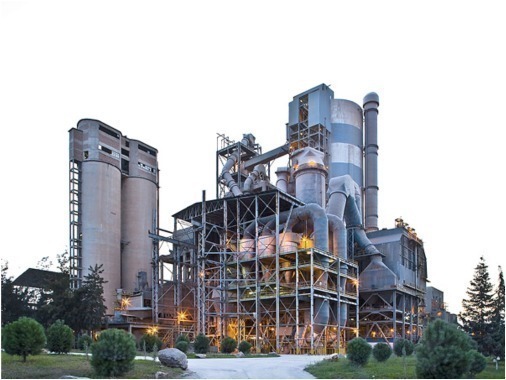
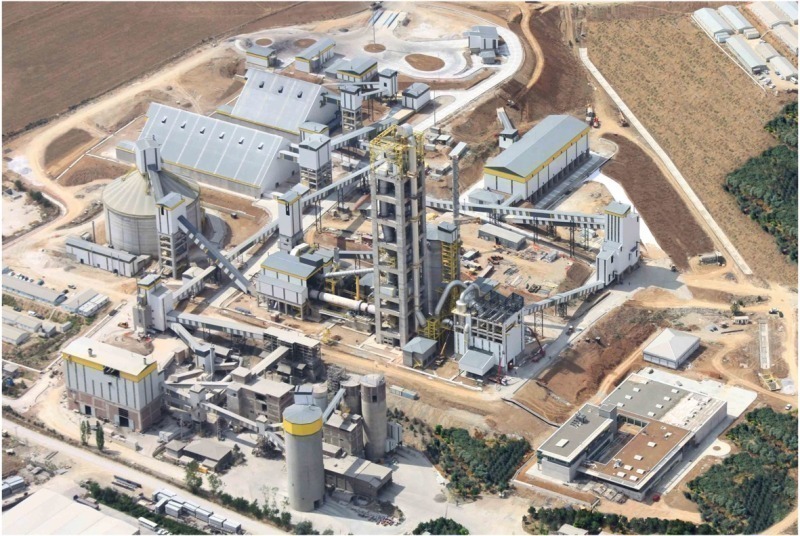
The Turkish cement industry is highly fragmented. Table 1 provides an overview of the most important companies, capacities and number of plants. More than 20 companies are active in the country. The TOP 10 only own 2/3 of Turkey’s cement production capacity. The last published capacity figure of 103.5 Mta is so high that with a total actual output of 60 Mta the average capacity utilization of the 42 integrated cement plants and 33 grinding plants is only 58.6 %. The leading company is the OYAK Group, the pension fund of the Turkish armed forces. OYAK owns a cement production capacity of 17.5 Mta. The Adana plant (Fig. 5) is the largest OYAK plant, with a capacity of 5.5 Mta. Ünye (Fig. 6) is the smallest with 2.6 Mta. By purchasing Aslan Cement from Lafarge, OYAK was able to establish itself for the first time in the Marmara region with a cement production capacity of 3.4 Mta.
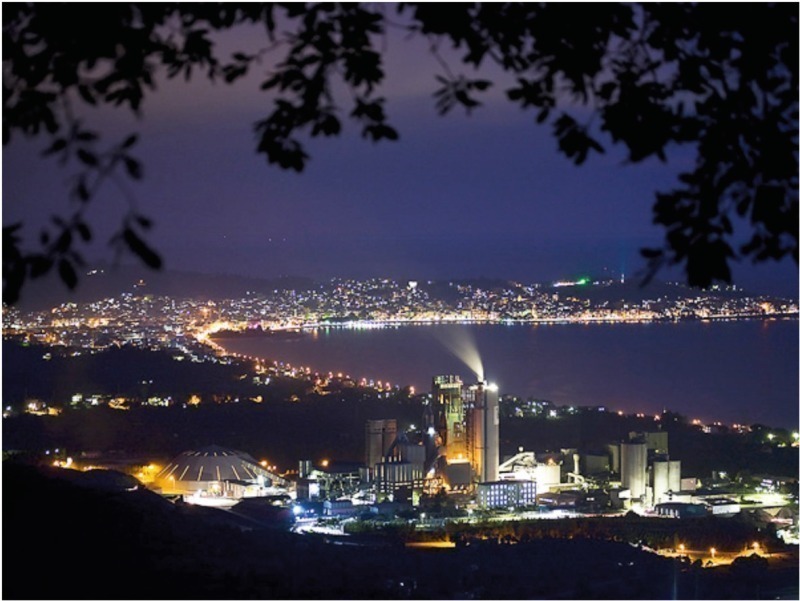
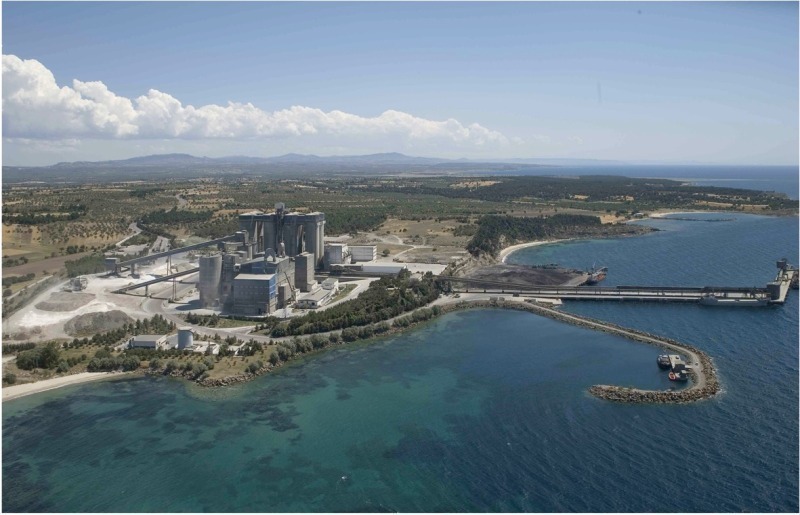
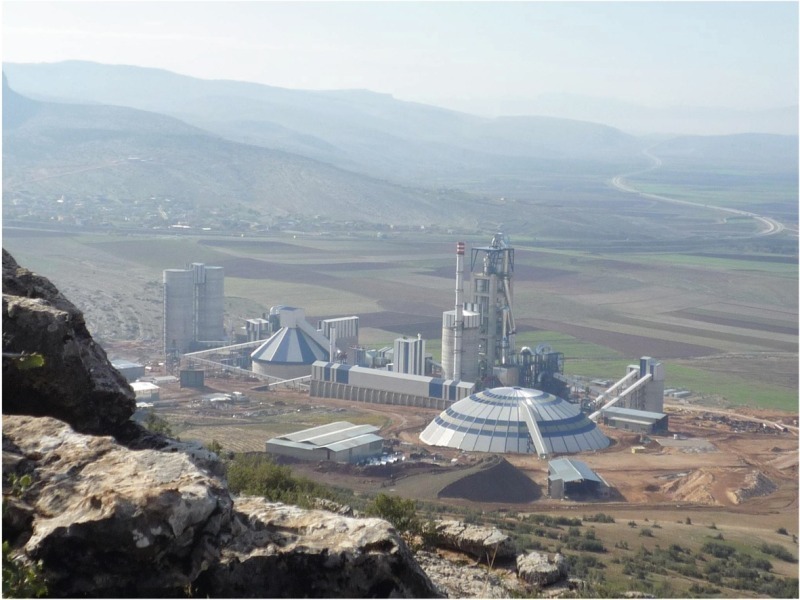
In the rankings OYAK is closely followed by Sabanci, who own Çimsa Çimento, and together with HeidelbergCement are the biggest shareholders of Akçansa. Sabanci/Akçansa own a cement production capacity of 15 Mta. Due to the extension of the Çanakkale terminal facilities (Fig. 7), Akçansa alone exported a quantity of 2.5 Mta of cement and clinker in 2009. A further 2 Mta were exported by Çimsa. Çimsa is one of the world’s leading producers of white cement. Among the other Turkish cement producing companies are Limak (6.4 Mta capacity), Nuh Çimento (5.8 Mta) and the Sanko Group (5.6 Mta). Sanko owns the brands Bartin and Çimco. Çimco recently successfully put the 3,800 tpd Kahramanmaras¸ plant (Fig. 8) into operation.
Apart from HeidelbergCement, the most important foreign companies include Cementir, Cimpor, Vicat and Italcementi. Lafarge has meanwhile withdrawn from the Turkish cement market. Cementir (5.4 Mta capacity) took over Çimentas in 2001, while Cimpor (4.8 Mta) purchased a stake in Ybitas. Ybitas recently commissioned the Hasanoglan plant (Fig. 9) near Ankara. Vicat (4.6 Mta) took over Konya in 1991 and Bas¸tas¸ Çimento in 1994. In 2008 Italcementi (4.6 Mta), the owner of Set Çimento, attempted to sell its Turkish assets to Sibirsky Cement and in part-exchange to receive shares in Sibirsky. However, this deal was subsequently dropped because no practicable modus operandi could be found.
Saudi Arabia‘s building and construction sector came through the global economic crisis almost unharmed. Indeed, the cement sector registered a peak year with an increase of almost 23 % in cement consumption (Fig. 10). This prompted the Saudi Arabian government to decree a selective ban on cement exports in order to safeguard domestic availability and curb the rise in cement prices. This ban did not include exports to Bahrain and also excluded the exports of one producer in the Northern Province. It had the effect of reducing export quantities from 3.5 Mta in 2007 to 1.2 Mta in 2009. Further two-digit cement consumption growth rates are forecast for the coming years. However, exports will become more and more difficult because of the increasing self-sufficiency of former importing countries.
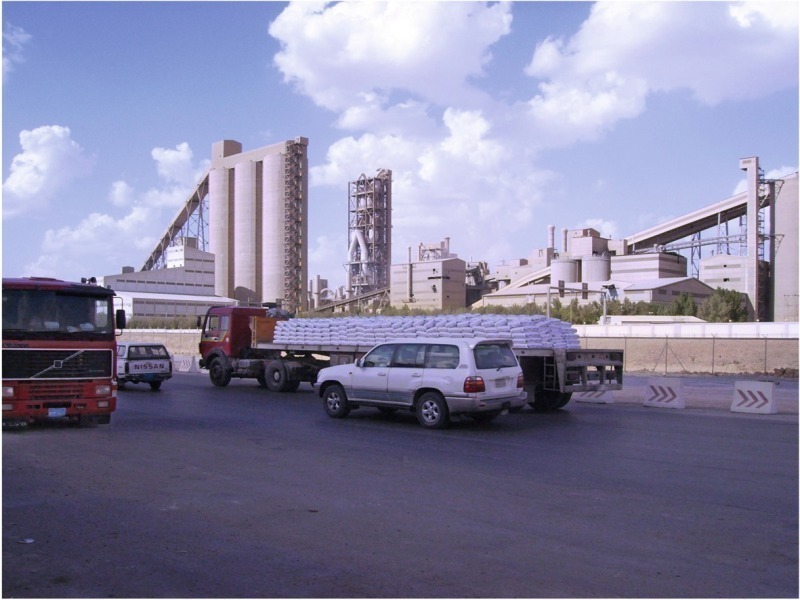
Table 2 shows the cement sales figures of the most important Saudi Arabian cement producers in the last two years. From 2008 to 2009, sales increased by 15 % from 32.9 Mta to 37.8 Mta. The market leader is Saudi Cement (8.6 Mta capacity in 2010) with its cement sales of 5.5 Mta in 2009. Place 2 in the rankings is taken by Yamama Cement (YSCC, 6.3 Mta capacity) with its cement sales of 5.2 Mta. This company put its seventh production line into operation and was able to raise its cement sales (Fig. 11) by over 18 % in 2009. An even greater sales volume increase of 32 % was achieved by Quassim Cement (QCC, 4.1 Mta capacity) with a record figure of 4.2 Mta. In contrast, Yanbu Cement (YCC, 4.4 Mta capacity) suffered a sales decline of – 8.7 %. The ups and downs of Saudi Arabian cement producers illustrate the regional inconsistency of the local cement markets.
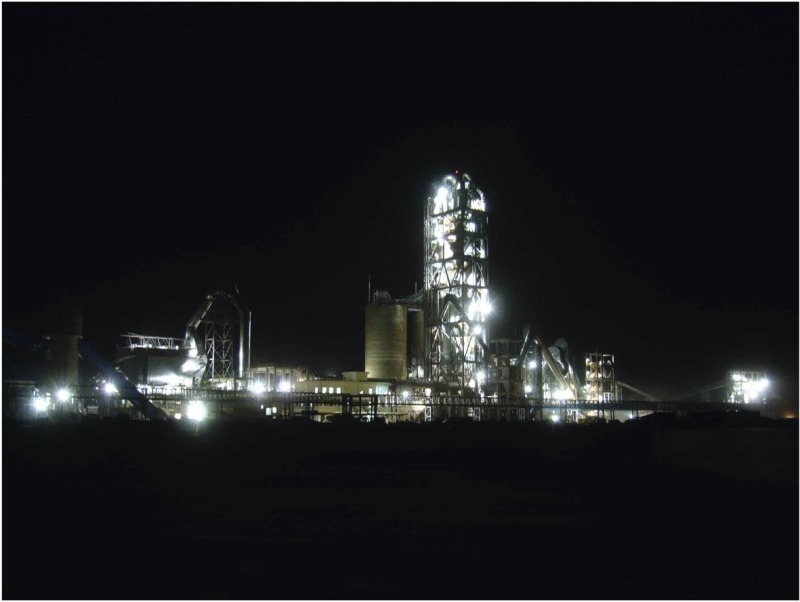
For instance: Northern Region Cement (NRCC, 1.7 Mta capacity) built a new cement plant (Fig. 12) and managed not only to satisfy local demand in the north, but also to export a portion of its cement output to Jordan and Iraq. In addition to the established cement producers (see Table 2), who own a cement production capacity of 37.5 Mta, there are now 5 newcomers to the market with a capacity of 11.5 Mta. These are NRCC, City Cement, Najran Cement, Riyadh Cement and Al Safwa Cement. The Al Safwa cement plant (Fig. 13), of which Lafarge and the Khayyat Group each own 50 %, started production at the beginning of the year. By purchasing Orascom, Lafarge gained strategic access to the Saudi Arabian cement market.
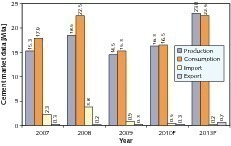
The construction slump, which resulted in a large number of suspended building projects, hit the United Arab Emirates’ (UAE) cement industry hard (Fig. 14). From 2008 to 2009 local cement consumption declined by 32 % to 15.3 Mta. Cement production sank to 14.5 Mta and exports dropped to 0.9 Mta after 3.8 Mta in the boom year. An optimistic view of the 2010 cement market sees a slight cement consumption improvement of 7– 8 %. However, it is not anticipated that the level of 2008 will be re-achieved until about 2013. In 2008 the UAE already had a cement production capacity of 31.3 Mta. Further cement production capacities that are currently being brought on line can be regarded as planning errors. In the boom year, forecasts assumed that production capacity would increase to 50.6 Mta by 2013 [1].
Table 3 provides an overview of the UAE’s cement production capacity in 2009. Up to now, over 20 cement producers are represented on the market with a production capacity of 33.7 Mta. Of the 20 cement plants in the country, 9 are pure grinding plants processing outsourced and usually imported clinker. Fujairah Cement is the number 1 on the market with a capacity of 4.6 Mta. At the beginning of this year, Fujairah started up a new 7,500 tpd kiln line (Fig. 15). Almost level with Fujairah is Union Cement with a capacity of 4.5 Mta. Among the newcomers to the market are Star Cement, which has up to now operated two grinding plants in Abu Dhabi and Ajman with a capacity of 2.35 Mta. The commissioning of Star Cement‘s new kiln plant in Ras Al Khaimah (Fig. 16) brings a further 2 Mta of cement production capacity onto the market. Arkan Building Materials could establish itself as the new No. 1 on the market when its 4.5 Mta plant comes on line in 2010.
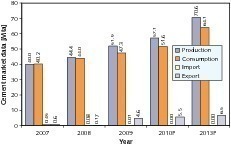
A detailed analysis of the Iranian cement industry was provided in [2]. The cement industry is still flourishing, although the cement consumption growth rate slowed down slightly in 2009 (Fig. 17). In contrast, the country’s exports showed a healthy rise to 4.6 Mta after export restrictions were lifted. This resulted in a large cement production increase from 44.4 Mta to 51.9 Mta, with 47.3 Mta being sold on the domestic market. For 2010, a further rise in cement output to 57.1 Mta is expected, with a possible export figure of 5.5 Mta and a domestic consumption of 51.6 Mta. The prospects up to 2013 mainly depend on the extent to which the present per-capita consumption (PCC) of almost 700 kg can be further increased. The projection presented here regards a rise in PCC to around 830 kg as realistic. This corresponds to a local cement consumption of over 64 Mta in 2013.
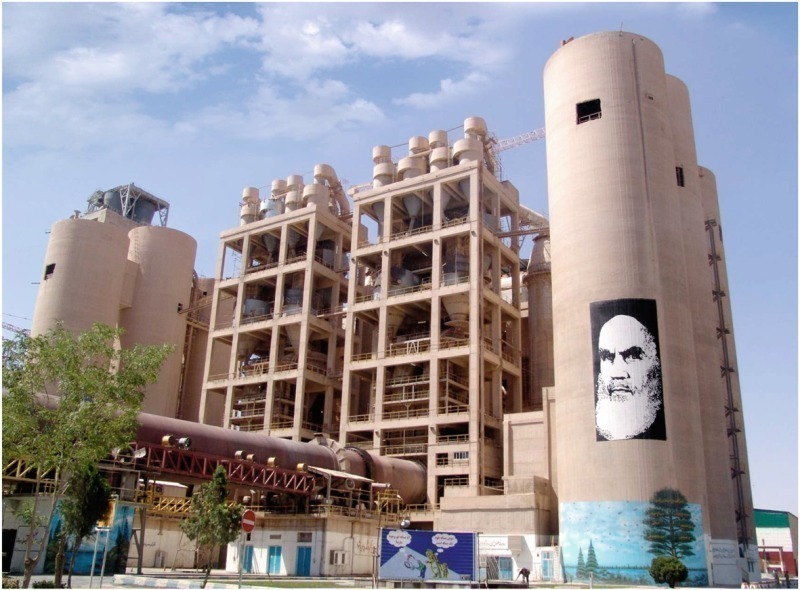
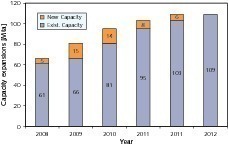
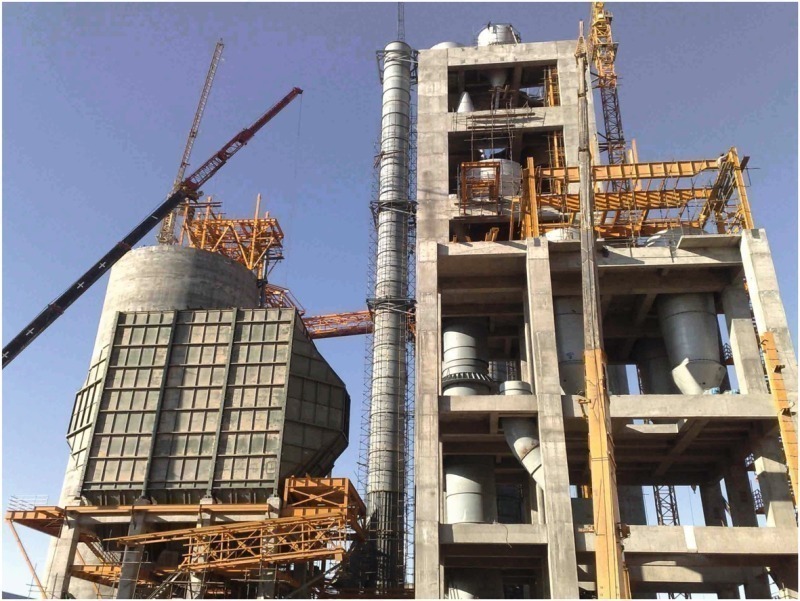
The cement market in Iran is highly fragmented. At present, the country has a cement production capacity of 66 Mta. The market leader is Fars & Khuzeshan Cement with a market share of around 33 %. The following rankings are occupied by Teheran Cement, Bank Melli Iran Investments and Sepahan Cement (Fig. 18), which each have a market share of 10-12 %. The percentage of private cement projects has increased enormously in recent years, when Iran’s cement production capacity was expanded strongly to 66 Mta. Figure 19 shows the forecast increase in cement production capacity to 109 Mta by 2013. New plants are increasingly employing the very latest production technol-
ogy. Such cutting-edge technology was previously supplied from Western Europe (Fig. 20), but nowadays Chinese companies are becoming powerful competitors. In the last 18 months alone, Chinese vendors have received 5 new orders, while their West European competitors have been hindered by EU sanctions.
After devastating floods, the country is currently experiencing a humanitarian catastrophe. About one fifth of Pakistan was under water and thousands of people have drowned or are threatened by hunger and disease. At first, national and inter-national aid was inadequate and did not arrive fast enough, as the scale of the disaster had been generally underestimated. Despite all the suffering and damage to infrastructure that has been reported, there are also a few positive items of news. One is that the country’s cement factories have remained practically undamaged. However, cement transportation to the affected areas is being hindered just as much as the aid convoys by the destruction to infrastructure such as bridges and roads. For the expected long process of reconstruction it is clear that Pakistan will need more cement than ever before.
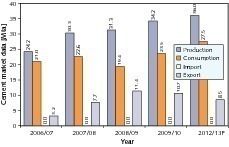
Figure 21 depicts the development of the cement market in Paki-stan. After a 14 % slump in cement consumption in 2008/09 (July-June), the completed business year 2009/10 brought a substantial upswing of more than 21 % to 23.5 Mta. The country’s two-digit export figures were maintained. 2010/11 will certainly go down in the country’s annals as a difficult year. It is to be hoped that Pakistan and its cement industry will have recovered by 2012/13, and that cement consumption will reach new heights. Exports will presumably decline because of the increasing self-sufficiency of former customer countries and the stiffer global competition.
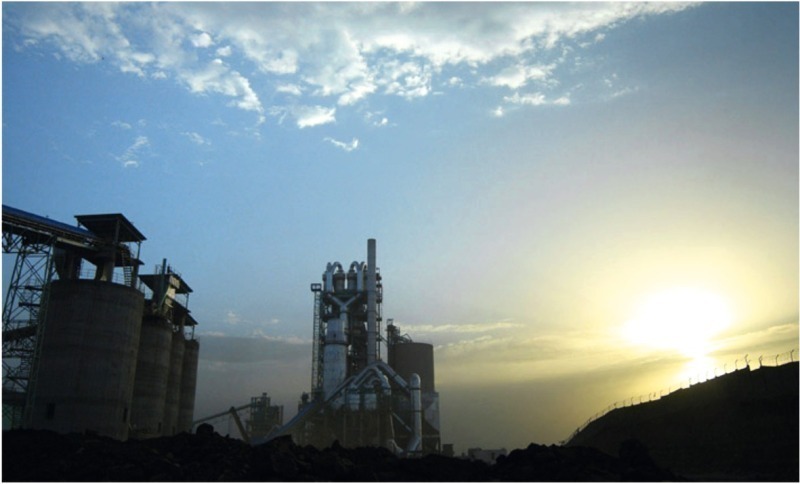
Table 4 shows the capacities of the leading cement producers in Pakistan. At present, the total installed capacity is 47 Mta. In the north of the country there are 19 plants with a capacity of 35.8 Mta, while the south boasts 10 plants with 8.9 Mta. Up to now, no producer owns more than two cement factories. The market leader is Lucky Cement with a capacity of 7.5 Mta and a market share of 16 %. Bestway Cement (Fig. 22) is in second place with 4.8 Mta and a market share of 10 %, ahead of D.G. Khan Cement (4.2 Mta) and Maple Leaf Cement (3.7 Mta). The subsequent rankings are occupied by companies with a capacity of 2–3, including Lafarge Pakistan. The remaining cement companies own a total of 14 factories and have 12.7 Mta capacity between them. Fauji Cement has one cement plant in Jhang Bahtar (Fig. 23) and will soon put a new 7200 tpd plant into operation.
After the ups and downs in the Middle East’s cement demand, the region’s cement producers are hoping for sustained growth. These hopes will certainly be fulfilled in the cement markets outside the Gulf region. However, it is difficult to make an accurate forecast for the Gulf region, which currently has the world’s highest per-capita cement consumption rates of over 3,000 kg. Production capacities are growing faster than the demand for cement, so that competitive pressure on the region’s producers is bound to increase. Moreover, exports are becoming far more difficult in the region and in markets outside it, such as Africa. Even there, new cement production capacities are largely keeping pace with the changing market requirements. It will be interesting to see what capacity utilization figures can be achieved in coming years with the cement plants in the region and whether the high profit margins of 50 %, for instance in Saudi Arabia, can be maintained.
Überschrift Bezahlschranke (EN)
tab ZKG KOMBI EN
This is a trial offer for programming testing only. It does not entitle you to a valid subscription and is intended purely for testing purposes. Please do not follow this process.
This is a trial offer for programming testing only. It does not entitle you to a valid subscription and is intended purely for testing purposes. Please do not follow this process.
tab ZKG KOMBI Study test
This is a trial offer for programming testing only. It does not entitle you to a valid subscription and is intended purely for testing purposes. Please do not follow this process.
This is a trial offer for programming testing only. It does not entitle you to a valid subscription and is intended purely for testing purposes. Please do not follow this process.