Outlook of the white cement industry
 OneStone Research
 OneStone Research
 OneStone Research
 OneStone Research
 OneStone Research
 OneStone Research
 Benvid White Cement
 JK White Cement
 Cementir Holding
 OneStone Research
 Cementir Holding
 Italcementi
 Lafarge-Holcim
 OneStone Research
 OneStone Research
 Cementir Holding
 Cementir Holding
 OneStone Research
 OneStone Research
 Lafarge-Holcim
The market for white cement is growing fast, faster than the market for grey cement. However, white cement is less of a commodity and the market characteristics are not only very specific but also very different to grey cement. This article presents some of the latest findings of a new market report, which is essential reading for companies already active in white cement and companies interested in investing in this sector.
1 Introduction
According to the new multi-client market report by OneStone Consulting the demand for white cement will grow by an average CAGR (compound annual growth rate) of 3.8 % between 2015 and 2020 [1]. This is actually higher than the antici-pated growth for grey cement. And interest in white cement is increasing. One reason is due to the higher sales prices and margins that can be achieved by white cement. Another is the premium nature of white cement in applications, which are driven by aesthetic and decorative aspects. Socio-cultural and marketing aspects also play an important role...
1 Introduction
According to the new multi-client market report by OneStone Consulting the demand for white cement will grow by an average CAGR (compound annual growth rate) of 3.8 % between 2015 and 2020 [1]. This is actually higher than the antici-pated growth for grey cement. And interest in white cement is increasing. One reason is due to the higher sales prices and margins that can be achieved by white cement. Another is the premium nature of white cement in applications, which are driven by aesthetic and decorative aspects. Socio-cultural and marketing aspects also play an important role in this niche market. But to be successful in this market all the factors from production to local demand, exports, imports, logistics and costs have to be considered.
The 2.35 billion US$ white cement market is undergoing continuous change. Some traditional markets saw a huge decline, whilst others are recovering. Export and import flows changed with new capacities and demand. New suppliers with the latest technology and better economies of scale are also entering the arena and ownership changes and mergers & acquisitions have an additional effect. The findings of the new market report are based on recent intensive research of all white cement manufacturers, their global and local production capacity from quarterly and annual reports, investor presentations as well as data from statistical reviews by associations, national statistics offices and analysts. Interviews with market experts have been used to obtain and verify the information, as well as to forecast future market development.
2 White cement market development
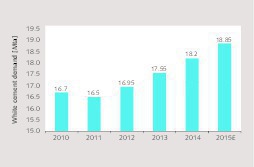
White cement is a Portland cement containing a minimum amount of iron oxide or other coloring oxides. Aluminum oxide required in the recipe of the clinker is mostly provided by kaolin, SiO2 by pure sand and oil/gas is generally used instead of coal as fuel. In 2000 the white cement market stood at 10 Mta. The market increased to 16.7 Mta by 2010 and then grew to 18.9 Mta by 2015. However, white cement is only a small fraction (< 0.5 %) of the global grey cement market. Figure 1 shows the global market development in the last few years.From 2010 to 2015 sector growth has been 2.5 %. After a decline in consumption of 1.2 % in 2011 the market has been growing in the last few years by up to 3.7 %. According to our model, global white cement production is almost equal to the global consumption, however there are significant differences from region to region.
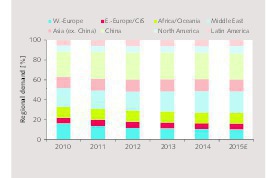
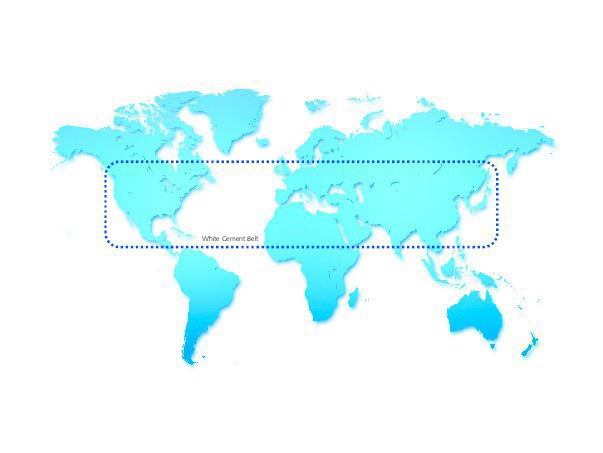
Development of the regional white cement consumption is outlined in Figure 2. China is the largest regional market with about 26 %, followed by the Middle East (21 %) and other Asia (excl. China) by 12 %. W.-Europe decreased from a global share of 16 % in 2010 to 10 % in 2015. The largest gains from 2010-2015 in absolute terms were in the Middle East, China and North America. The largest gains in the CAGR were by North America, the Middle East and other Asia. That white cement is different to grey cement can best be seen, when countries with the highest demand are analyzed. White cement has the highest coverage in the Northern Hemisphere in a belt from the 10th to 55th lateral north (Fig. 3). This is one of the reasons that demand does not move in line with grey cement and why comparisons with the grey cement market often fail.
3 Net trade, imports and exports
White cement production is not as widespread as grey cement. Accordingly a much larger amount is traded. In 2015 the cross-border trade will amount to 5.21 Mta, which is about 27.6 % of the white cement consumption. This is much higher than the trade of grey cement, which stands at about only 4.5 % of consumption. White cement is also transported over much longer distances than grey cement. While grey travels over an average distance of 190 km, the average distance for white cement is about 450 km. This is why the logistic aspects of white cement and cheaper rail and ship transports become more important. However, grey cement is supplied as a commodity in bulk form whilst white cement is almost entirely supplied to final customers in bags and big bags. Bulk white cement is used for exports and in transport to the distribution centers.
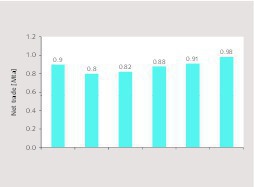
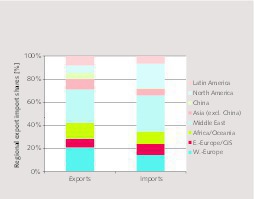
Global net trade has not changed very much in the last few years (Fig. 4). Net trade was 0.90 Mta in 2010, 0.80 Mta in 2011 and increased to 0.98 Mta in 2015. Net exporters are W.-Europe, Africa/Oceania, China, other Asia and Latin America. Net importers are E.-Europe, North America and the Middle East. Figure 5 gives an indication about the regional imports and exports in 2015.This year the Middle East will be responsible for nearly 32 % of global white cement imports and 29 % of exports. W.-Europe is responsible for nearly 14 % of the imports and 21% of the exports. North America is responsible for 21 % of the imports and 6 % of the exports. Africa/Oceania is responsible for almost 11 % of the imports and 14 % of the exports. All other regions, incl. China have a lower impact.
4 Major producers and their capacities
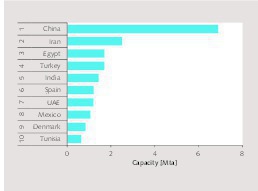
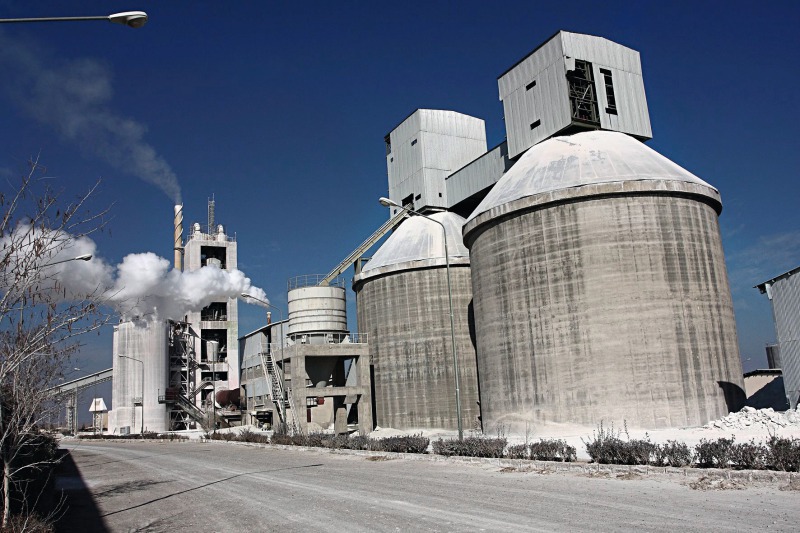
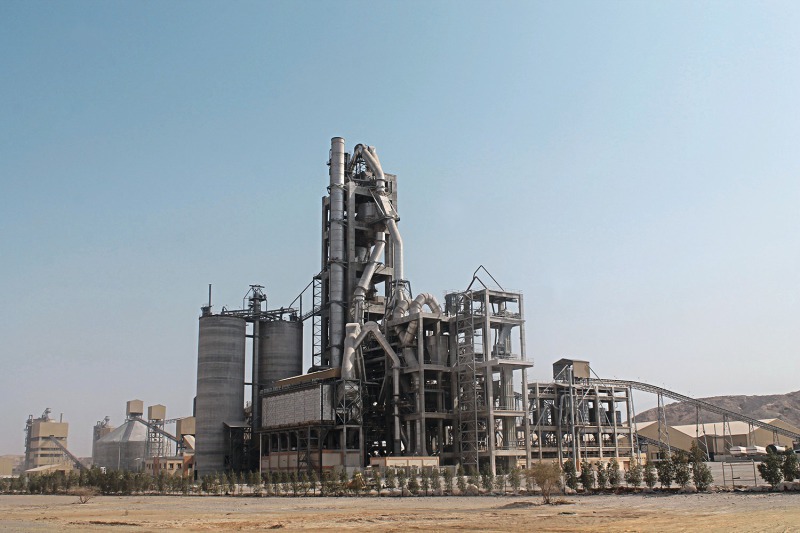
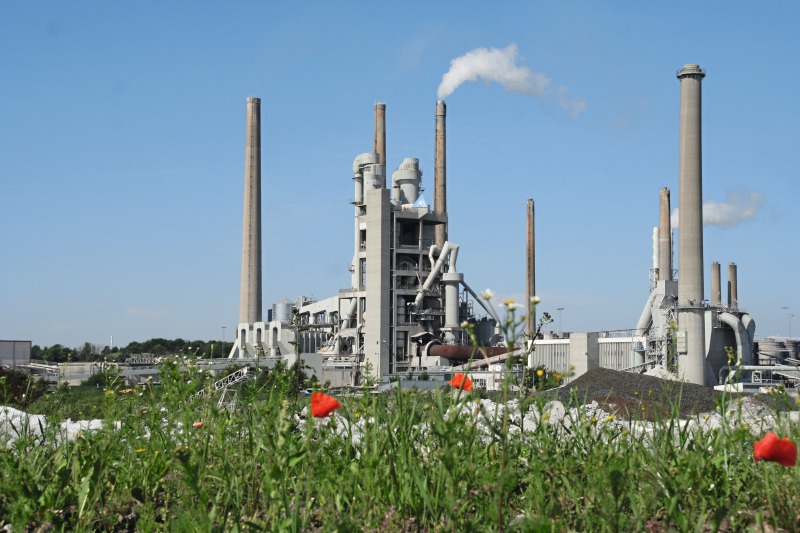
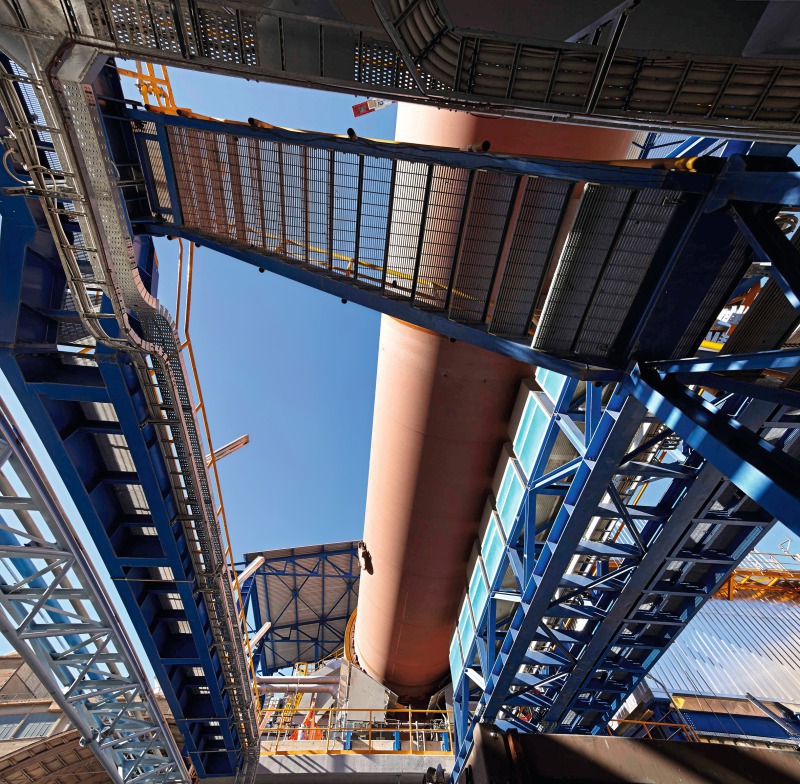
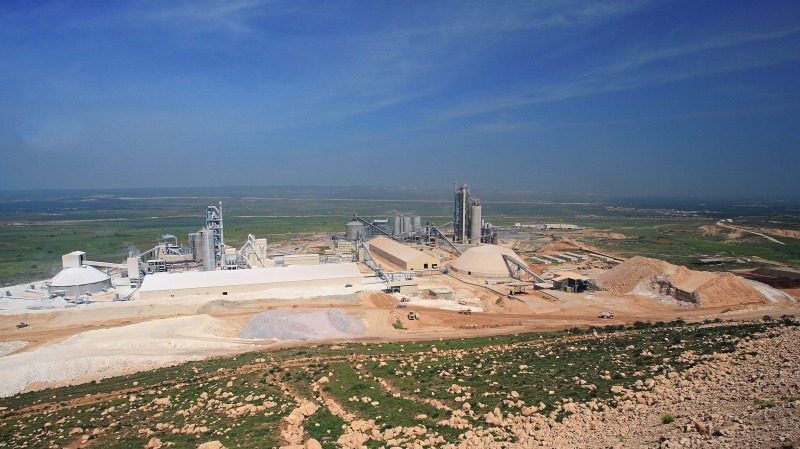
The global white cement capacity in Mid 2015 stood at 28.6 Mta. Of this 6.9 Mta or about 24 % of the global capacity is located in China (Fig. 6). Number 2 in ranking goes to Iran, where in the last few years new plants have become operational (Fig. 7) and other plants were converted from grey to white cement. Egypt, Turkey and India are the other emerging countries in the Top 5. It has to be noted that India’s manufacturing base already covers 5 producers, of which the Top 2 are responsible for about 83 % of the capacity. Spain is still in 6th place in the global ranking, although significant capacity has been closed down in the last few years. The final places in the Top 10 ranking are held by the UAE, Mexico, Denmark and Tunisia. Capacity in the UAE has recently increased due to another large plant (Fig. 8) becoming operational.
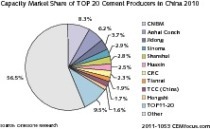
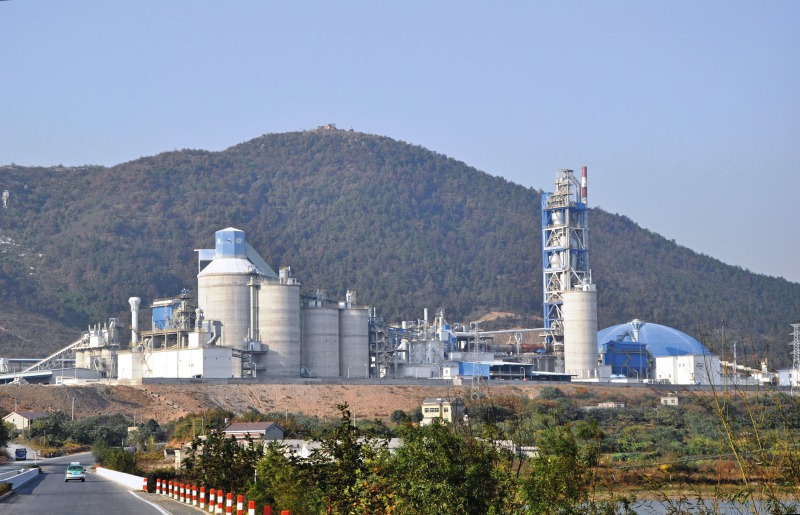
There are about 180 white cement plants operational worldwide, of which about 80 are located in China. According to the 2nd edition of the Global White Cement Report, the Chinese white cement manufacturing base dropped from more than 110 plants to 80, of which most plants have less than 0.1 Mta capacity [2]. According to our research the Top 10 producers in China, which include companies such as Aalborg Anqing (Fig. 9), Yingshan White Cement, Dongyuan Huike, China United (CNBM) and Guiping Mingyan, account for 55 % of the installed capacity. The largest number of plants outside China is in Iran and Mexico. 18 plants are located in W.-Europe, of which three are separate grinding plants and one is a dual plant, allowing the manufacturing of white and grey cement.
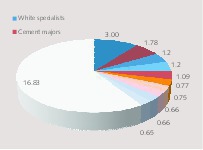
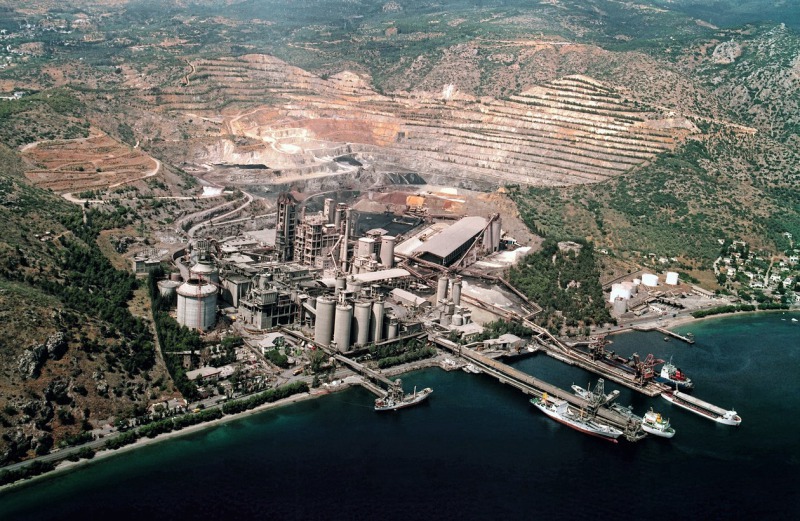
The ranking of the TOP white cement manufacturers has changed significantly in the last few years. This is as a result of new installations, ownership changes, mergers & acquisitions and last but not least plant closures. Figure 10 shows the actual Top 10 ranking with a split between white specialists and global and local majors. Nearly 57 % of this capacity is held by white specialists such as Aalborg (Cementir Holding) (Fig. 11), Çimsa, JK White, Sotacib and Yingshan White, while 43 % is by global and local majors including Cemex, FKCC Group, HeidelbergCement, Italcementi (Fig. 12) and Lafarge-Holcim (Fig. 13). The Top 20 ranking includes other white cement specialists such as Adana Cement, Birla White, Donyuan Huike, Federal White, RAK White and Royal White as well as local and global majors including Basel Cement, CRH, Ghadir Group and the Siam Cement Group.
5 Regional review (Other Asia)
In the new report, the white cement market is broken down into 8 world regions, including W.-Europe, E.-Europe/CIS, Africa/Oceania, N.-America, Latin America, the Middle East, China and other Asia. China is the largest regional market followed by the Middle East and other Asia. Other Asia includes the countries of South Asia with major markets in India, Pakistan and Bangladesh, South East Asia with Thailand, Indonesia, Malaysia and Vietnam as well as North East Asia with Japan, Taiwan and North and South Korea. Australia and New Zealand are covered in Africa/Oceania.
In other Asia 18 white cement manufactures with a combined cement capacity of almost 3.3 Mta from 18 plants have been identified. Most of this capacity is in India, Pakistan, Malaysia and Vietnam. Smaller capacities are in Thailand, Indonesia, South Korea, Japan and Bangladesh. In the other countries no plants are operational yet.
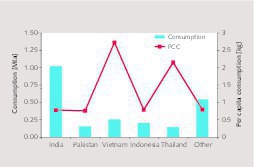
Other Asia is a net white cement exporter. The region is characterized by 0.31 Mta imports and 0.48 Mta exports in 2015. Figure 14 shows the major country markets in other Asia. India is the largest market and the country is responsible for more than 44 % of the region’s consumption. Vietnam has a market share of around 11 %, Indonesia of almost 9 %, Thailand and Pakistan of about 6 % each. The other countries of Japan, Taiwan, Singapore, N.-Korea, Bangladesh, Sri Lanka, Myanmar, Laos, Nepal have 23.5 % of the market between them. The countries are developing very differently. One of the highest growth areas is India, because up to now India has had a relatively low per capita white cement consumption (PCC) of about 0.8 kg. Highest PCC today is in Vietnam and Thailand with 2.7 and 2.2 kg, respectively. The average PCC in the region stands at only 0.9 kg.
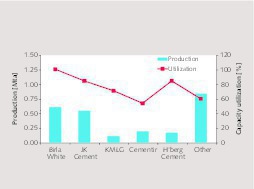
Major producers in 2015 in the region of other Asia at a company level are presented in Figure 15. Birla White (Ultratech) and JK White from India are the major producers, followed by Cementir (Malaysia), HeidelbergCement (Indonesia) and KMLP (Pakistan). The Top 5 produce 2/3 of the production in the region between them. 1/3 of the production is shared between 13 other white cement producers in the region, which also shows the relatively small market impact of these producers. However, they do have an impact on the cement prices in the region. The Top 2 Indian producers also have some of the highest capacity utilization rates. The average capacity utilization in the region is 75 %, which is relatively high when compared to Cementir and the other unlisted manufacturers in the region.
6 Benchmarks and economies of scale
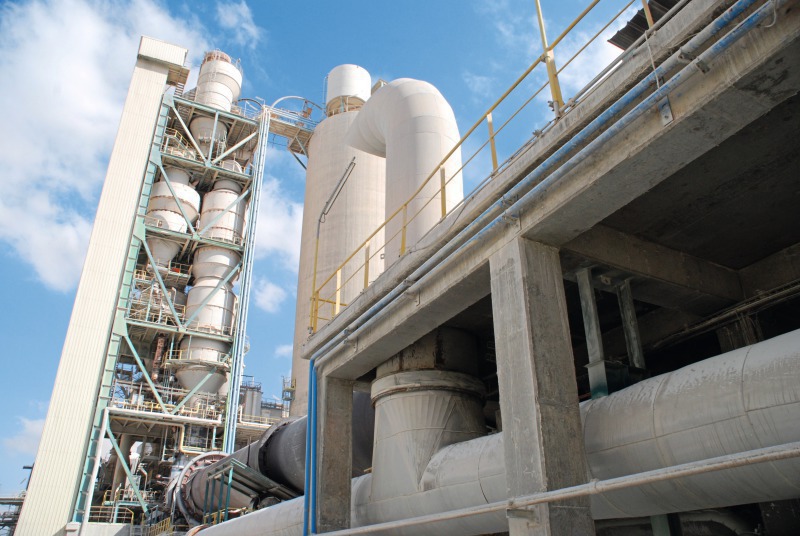
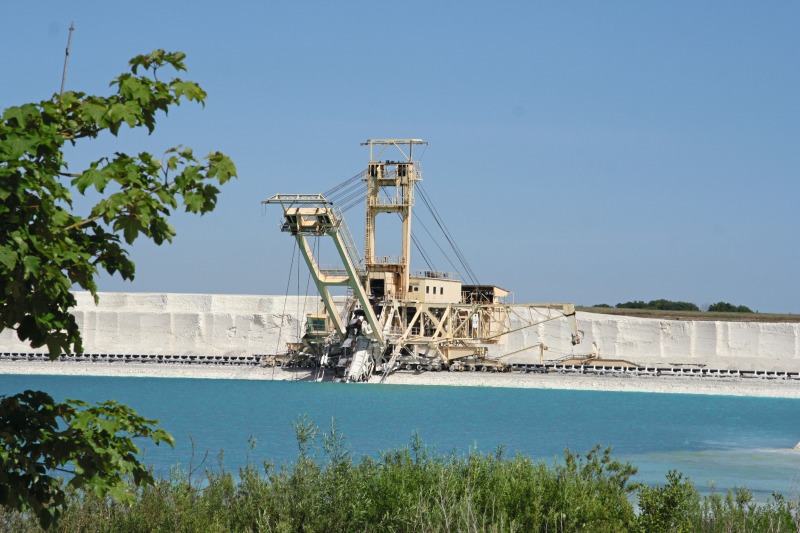
Sales prices for white cement are on an average two to three times higher than those for grey cement and generally well utilized white cement production achieves significantly higher margins than grey production. However, the largest operational white cement kilns (Fig. 16) only produce about 1200 to 2000 t/d, which is very small when compared to the largest grey cement kilns which exceed 10 000 t/d. Smaller kilns have a significantly higher fuel consumption. Another fact is that the raw materials for white cement (Fig. 17) are more costly. For these reasons and the fact that white cement manufacturing requires higher kiln temperatures and that the possible fuel and alternative fuel mix is much more limited suggests that the manufacturing costs for white cement can be at least 20-30 % higher than those for grey cement.
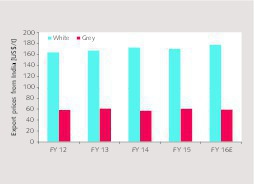
For benchmarking studies, an analysis of data by the leading white cement manufacturers and other producers has been performed. The data covers an analysis of the price development in local and export markets, the production and capacity utilization, development of revenues and margins, export shares and the comparison of the white and grey cement production of leading suppliers. Figure 18 gives an example for the export price development of a leading producer in India. Prices were calculated from Indian Rupees using a fixed US$ exchange rate in July 2015. White cement achieved prices above 175 US$/t, while grey cement traded at about 60 US$/t. The prices for white cement compared to grey cement showed a more positive development and were by a factor of 2.7 to 3.0 times higher.
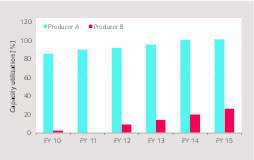
In general, white cement markets are not always comparable and often large discrepancies can be seen. One example about capacity utilization rates in the region of other Asia is shown in Figure 19. Producer A is from India with a white cement capacity of 0.6 Mta, producer B is from Pakistan with a capacity of 0.15 Mta. Producer A is able to achieve utilization rates close to 100 %, while producer B is struggling. From financial year 2010 to 2015 producer A improved its capacity utilization rate from 86 to 101 %. Producer B improved its utilization from close to zero to 26 %. Capacity utilization rates are driven by several factors: market demand, producer prices, distribution costs and infrastructure, product acceptance in the market as well as the marketing efforts of the producer. Quality and marketing issues are often not seen as crucial, but we believe that these factors have a large impact.
7 Outlook and trends
According to our projection the global demand for white cement will increase by a CAGR of 3.8 % from 18.9 Mta in 2015 to 22.7 Mta in 2020. Lowest growth will be in China and highest will be in the other Asia region, including India. However, whilst capacity will increase global trade is projected to decline. Between 2016 and 2017 more than ten projects have been identified which will increase capacity and probably due to the nature of the industry more projects can be expected. What is unknown at the moment is how many dual production lines will be erected, and what the planned and operational split between white and grey cement production will be. However, what is abundantly clear is that the market is full of opportunities.
8 Final remarks
The new multi-client market report “White Cement Outlook 2020” is available from the middle of November 2015. It contains the latest 2015 data, consists of about 120 pages, is written in executive style and looks at the industry in much more depth than this article. The market report is intended, amongst other things to help business development professionals, industry and trading analysts, financial investment advisors and other professionals and decision makers to identify the opportunities that this niche market sector offers. The report provides the evidence needed to justify investment in order to benefit from the sector.
Überschrift Bezahlschranke (EN)
tab ZKG KOMBI EN
This is a trial offer for programming testing only. It does not entitle you to a valid subscription and is intended purely for testing purposes. Please do not follow this process.
This is a trial offer for programming testing only. It does not entitle you to a valid subscription and is intended purely for testing purposes. Please do not follow this process.
tab ZKG KOMBI Study test
This is a trial offer for programming testing only. It does not entitle you to a valid subscription and is intended purely for testing purposes. Please do not follow this process.
This is a trial offer for programming testing only. It does not entitle you to a valid subscription and is intended purely for testing purposes. Please do not follow this process.