Indonesia at the crossroads
 Central Bank of Indonesia
 ASI, OneStone Research
 ASI, OneStone Research
 ASI, OneStone Research
 Semen Indonesia
 OneStone Research
 Semen Indonesia
 Semen Indonesia
 HeidelbergCement
 HeidelbergCement
 Holcim
 Lafarge
 Garuda Cement
 Semen Indonesia
 Semen Indonesia
 OneStone Research
 HeidelbergCement
Indonesia’s cement growth rate cooled down to just 5.5 % last year after double-digit growth rates for the two previous years. Now for the next few years a 6 % annual increase in the demand for cement is projected. With this reduced expectation plans for new plants to increase cement capacity have been adjusted. In this article the latest projections are given.
1 Introduction
After the presidential election in July this year, there are high expectations that Joko Widobo, Indonesia’s most popular politician and his Democratic Party of Struggle (PDI-P) in coalition with the People’s Conscience Party (Hanura), National Democratic Party and National Awakening Party will be able to bring the country back to sustainable growth. At the end of the second term of former president Susilo Bambang Yudhoyono, who had been in power since 2004, Indonesia’s economic growth had flagged, investments decreased, inflation and current account deficit increased and a lack...
1 Introduction
After the presidential election in July this year, there are high expectations that Joko Widobo, Indonesia’s most popular politician and his Democratic Party of Struggle (PDI-P) in coalition with the People’s Conscience Party (Hanura), National Democratic Party and National Awakening Party will be able to bring the country back to sustainable growth. At the end of the second term of former president Susilo Bambang Yudhoyono, who had been in power since 2004, Indonesia’s economic growth had flagged, investments decreased, inflation and current account deficit increased and a lack of reforms became more evident, while infrastructure remained the worst of any major country in Asia. Due to the current lack of adequate infrastructure, logistic costs absorb on average over 20 % of companies expenditure.
Joko Widobo started his political career as the mayor of Solo, a small city in central Java. He became Governor of Jakarta in September 2012, where using a hands-on approach he was able to fix problems with traffic jams, seasonal flooding, which is still a big challenge in many parts of Indonesia, and poor housing. He was able to get infrastructure projects moving in the capital and the commencement of the metro train system, which had been delayed for years, suggests that he is a pragmatic leader who will get things done in his five year Presidency. In the campaign Joko Widobo argued that he will push infrastructure projects and overhauls needed to deliver the country into a new economic area, without detailing a plan.
2 GDP growth, construction and
infrastructure spending
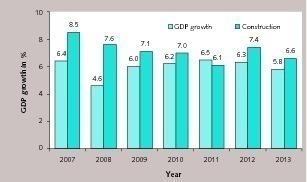
Indonesia’s GDP growth rate is slowing down. The Central Bank of Indonesia expects the economy to grow 5.15 % this year, a down from last year’s 5.8 % expansion. In the latest April 2014 World Economy Outlook (WEO) the International Monetary Fund (IMF) is projecting a slowdown to 5.4 % this year and a slight increase to 5.8 % next year. Figure 1 shows the GDP development in comparison to the growth in construction over the last few years. With the exception of 2011 the construction growth rate has always been significantly higher than the GDP growth rate although up to 2009 the difference was much higher than in the last few years. For 2014 construction growth outlook is more than 7 %.
According to IHS Global Insight, Indonesia is the 4th largest spender on construction in Asia. In 2013 the country’s spending was U$ 267 billion, after China (U$ 1.78 trillion), Japan (U$ 742 billion), India (U$ 427 billion), but overtaking South Korea (US$ 154 billion) and well ahead of ASEAN countries (Thailand US$ 33 billion, Malaysia US$ 32 billion, the Philippines US$ 25 billion, Singapore US$ 24 billion and Vietnam US$ 16 billion).
Indonesia’s annual construction spending growth for 2014-2019 is forecast by IHS to be 5.2 %, compared to 7.3 % for China, 7.0 % for India, 6.8 % for Vietnam, 6.4 % for Bangladesh and 4.5 % for Thailand. It should be noted that construction spending in Asia already accounts for 44 % of the total global construction spending of 2013, an increase of 4 % since 2012.
Inadequate infrastructure has long been identified as an obstacle to higher economic growth in Indonesia. The Ministry of National Development Planning (Bappenas) estimates that from 2015 to 2020 Indonesia will need to invest IDR 7.2 trillion (US$ 600 billion) in infrastructure. Today, the country only spends 5 % of GDP on infrastructure, down from 9.5 % before the Asian crisis. However, Indonesia’s shortfall in adequate ports, transportation and energy infrastructure, water sanitation and waste management are more of an opportunity than an obstacle for economic development. According to Bappenas, an investment of IDR 2.0 trillion (US$ 167 billion) is needed for the construction of roads and bridges and IDR 1.6 trillion for energy infrastructure.
Due to a lack of public funding, a large amount of infrastructure investment needs to come from the private sector. Through the Masterplan of Acceleration and Expansion of Indonesia’s Economic Development (MP3EI), introduced in 2011, the government intends to tackle the infrastructure problems through public-private partnerships (PPPs) [1]. However, there are no promising results yet. Up to now the government disbursed only a fraction of what it earmarked for PPPs in infrastructure spending. The private sector is not eager to participate in PPP schemes. Bureaucracy, legal uncertainty, lack of transparency and land acquisition are the most notorious obstacles for the investments, although government guarantees for PPPs are provided by an Infrastructure Guarantee Fund.
3 Cement production and consumption
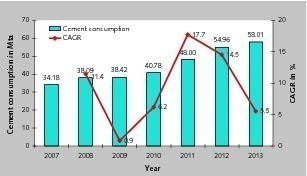
The demand for Indonesian cement has slowed and may not achieve the 2014 target. In the first half of the year, the country’s domestic cement sales totaled 28.9 million tons (Mta), which is a 4 % increase year-on-year (YoY), while the target set by the ASI (Indonesia Cement Association) was 6 %. However, the decline in cement growth is not a surprise, when the decline in GDP growth and investments are taken into account. Figure 2 shows the development of the cement demand in recent years. From 2007 to 2013 Indonesia increased its cement consumption by almost 70 % from 34.2 Mta to 58.0 Mta. The per capita cement consumption increased in this period from 148 kg to 230 kg, which is still largely behind the global average of about 560 kg, but is still fueling the prospects of the cement industry.
The largest growth rates in the demand for cement in Indonesia were achieved in 2011 with 17.7 % and 2012 with 14.5 %. In 2013 the growth rate declined to 5.5 %. Due to the decline major cement producers adjusted their demand growth projections from 9-10 % (June 2013) to 6 % in 2014. From January to June 2014 the demand for cement grew most rapidly in Jakarta, West and East Java. Largest decline was in Banten, Nusa Tenggara and Papua-Maluku. Factors that caused the slowdown are seen in the flooding of large territories in January/February of the year, new rules that limited prosperity ownership and last but not least the legislative and presidential elections in April and July. It was stated that due to the elections many construction projects were postponed.
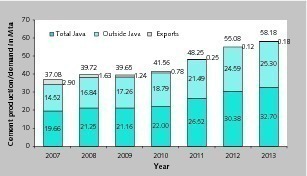
Figure 3 provides information about the development of cement production. This rose from 37.1 Mta in 2007 to 58.2 Mta in 2013. Most of the domestic cement production is used on the main island of Java. In 2007, 53 % of the cement produced went to satisfy demand in Java, while 39 % went to other islands in the Indonesian archipelago and 8 % was exported. In 2013, Java consumed 56 % of the cement produced, while 43 % went to the other islands and exports only accounted for 0.3 %. Cement consumption outside of Java increased disproportionately over this period of time, although the absolute growth in the demand for cement from 2007 to 2013 in Java and outside Java was 13.0 Mta and 10.8 Mta respectively which is not so very different.
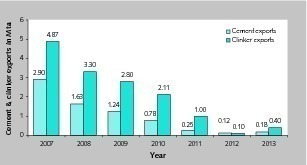
Exports of cement and clinker have fallen dramatically over the last few years (Fig. 4). While cement and clinker exports still amounted to 2.90 and 4.87 Mta respectively in 2007, by 2013 they were only 0.18 and 0.40 Mta respectively, showing a slight recovery from even lower 2012 export volumes. But in the 1st Q of 2014 cement exports again declined by 19.6 % YoY to just 0.069 Mta. The main reasons for the decline in exports over the last few years were increasing domestic demand and very high capacity utilization rates of all Indonesian market participants. Other factors were lower price exports from Vietnam and Pakistan, which made Indonesian exports less attractive.
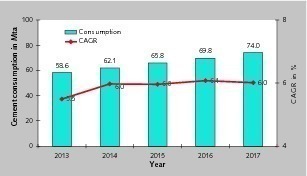
A projection of the demand for cement by 2017 was made by Semen Indonesia (Fig. 5). The projection is based on a CAGR of 6.0 %. Accordingly cement demand will grow from 58.6 Mta in 2013 to 62.1 Mta in 2014 and finally 74.0 Mta in 2017. In June 2013 still a CAGR of 9 % in the cement consumption from 2013 to 2017 was projected, which would have resulted in a cement demand of 85.3 Mta by 2017.
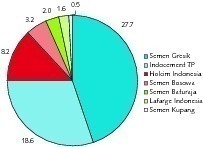
4 Indonesia’s cement producers
At the end of 2013 there were seven cement producers with a combined cement capacity of 61.8 Mta. However, all signs point to rapid expansion, and a number of newcomers will enter the market in the coming years. The undisputed market leader is PT Semen Indonesia (formerly PT Semen Gresik) with a current cement production capacity of 27.7 Mta and a market share of 44.8 % (Table 1, Fig. 6). The company is 51 % owned by the government and is a holding company for state-owned cement producers Semen Tonasa and Semen Padang. The group operates three integrated cement plants, one grinding plant, eleven sea ports for cement and clinker transshipment, 21 large packing plants and 30 warehouses in all areas of Java, Bali, Sumatra, Kalimantan, Sulawesi and Papua.
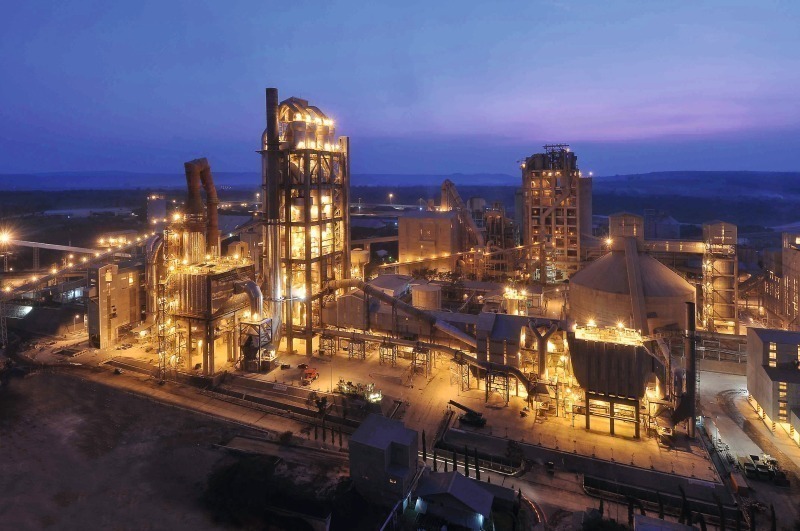
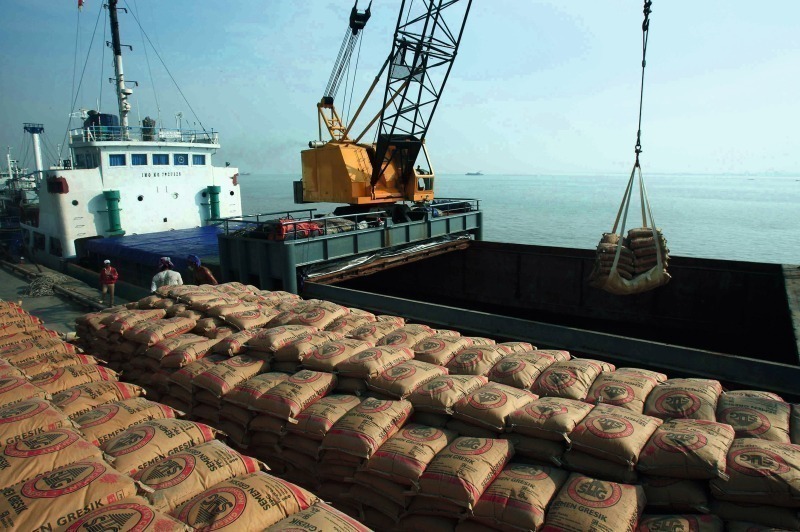
The largest cement plant of Semen Indonesia is Semen Gresik in East Java with a capacity of 14.0 Mta and four kiln lines, followed by Semen Tonasa in South Sulawesi with 7.3 Mta from four kiln lines and Semen Padang in West Sumatra who also have four kiln lines and a capacity of 6.4 Mta. In 2012 the 8000 tpd clinker production line Tuban IV (Fig. 7) as well as Semen Tonasa’s 8000 tpd line V were inaugurated. Semen Padang started the construction of Indarung VI on a site outside Padang in 2013. The 3.0 Mta cement plant will be operational in 4th Q 2015. Semen Gresik is constructing a 3.0 Mta cement plant in Rembang, Central Java. The project is scheduled for completion by 2nd Q 2016, so that Semen Indonesia will have expanded its cement capacity to more than 39 Mta by 2016. Cement transshipment (Fig. 8) is one of the most important factors for high capacity utilization.
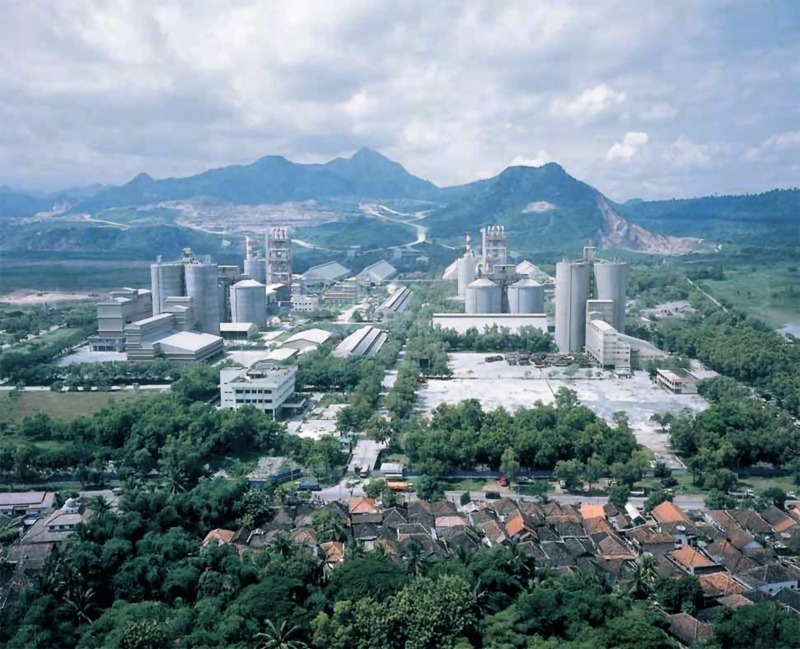
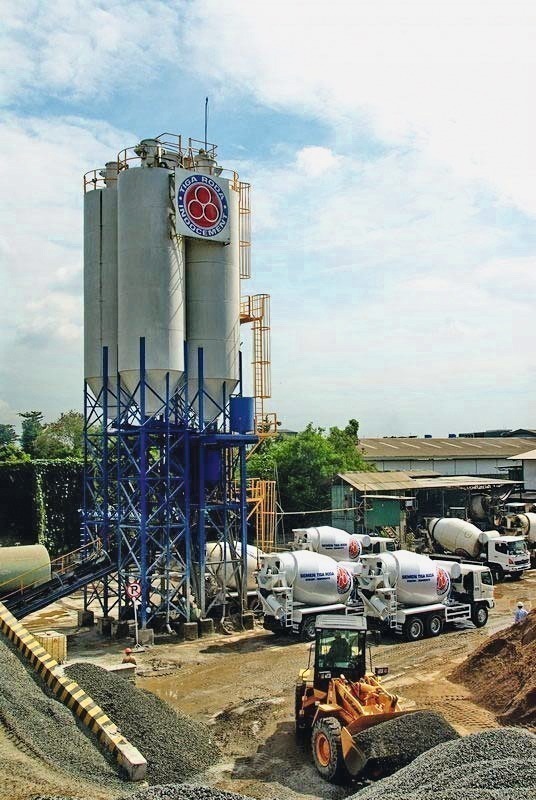
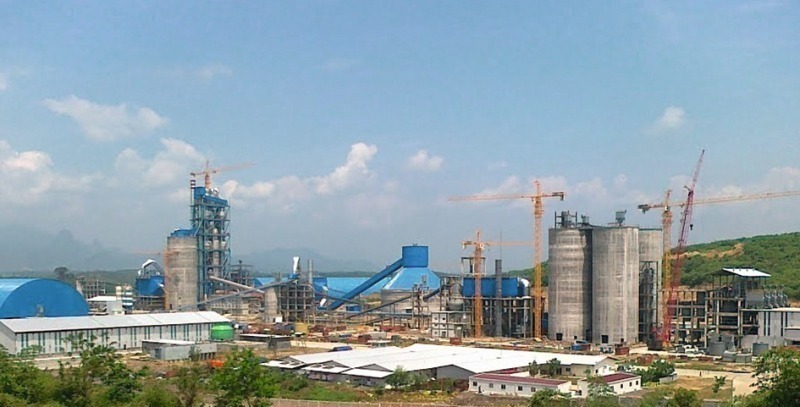
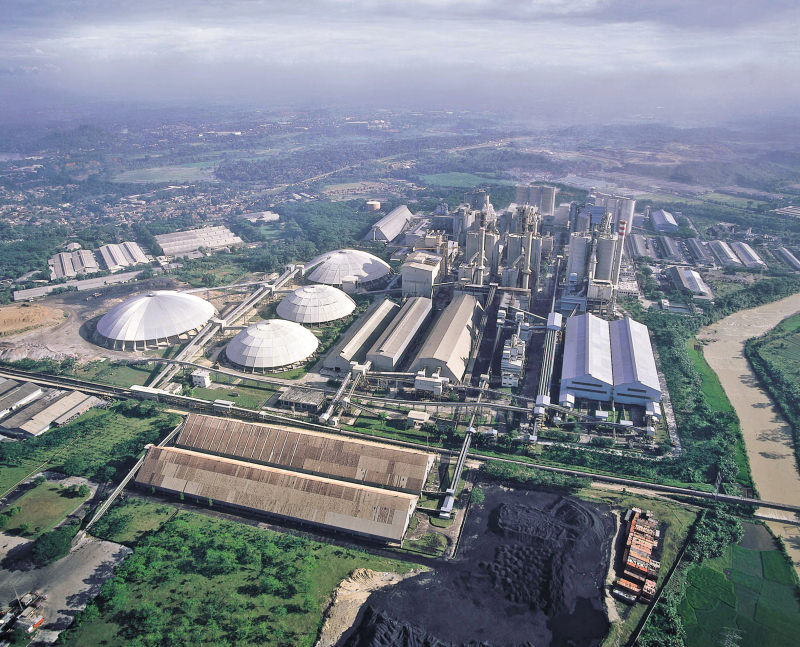
The 2nd largest cement producer in Indonesia is Indocement Tunggal Prakasa, which is a member of the HeidelbergCement Group. Indocement has a combined cement capacity of 18.6 Mta at its Citeureup (11.9 Mta), Palimanan Cirebon (4.1 Mta) and Tarjun (2.6 Mta, Fig. 9) cement plants. Citeureup has nine kiln lines and close to 12 Mta cement capacity in one of the largest integrated cement complexes in the world. A new vertical roller mill has been installed, which added 1.9 Mta cement capacity and the construction of a new 4.4 Mta cement plant started. The company divides its business into three main segments, which include cement, RMC (Fig. 10) and aggregates. Nevertheless cement sales account for about 85 % of the revenue. In 2013 Indocement produced 17.8 Mta cement (96 % capacity utilization) and sold 18.2 Mta. About 0.2 Mta, were imported and exported.
Holcim Indonesia takes 3rd place in the rankings with an 8.2 Mta capacity from two integrated plants in Cilacap (2.8 Mta) and Naragang (4.7 Mta) and the Ciwandan grinding plant (0.7 Mta). In June 2014 Tuban 1 (Fig. 11) in East Java was inaugurated. The new plant has 1.7 Mta cement capacity and increases Holcim’s Indonesian capacity by 20 %. In early 2015 Tuban 2 will become operational with another 1.7 Mta capacity. The investment completes the company’s footprint for Java, which has included timely investments in logistics and channel capacity for domestic markets as a whole. In East Java, the company is expecting to double its market share from 9 % to 18 %. Tuban is one of the biggest investments Holcim has ever made. It cost the company US$ 800 million to construct the two new production facilities.
Semen Bosowa Maros currently has a cement capacity of 3.6 Mta at its integrated plant in Maros (2.4 Mta, South Sulawesi) and a grinding plant in Batam (1.2 Mta), 20 km south of Singapore. The company is going to install a second clinker line in Maros, which will boost the cement capacity by 3.0 Mta. Commissioning of the plant is scheduled for September 2014. In 2012 a contract for two 5500 tdp clinker plants was signed with a Chinese ECP contractor but at the moment it is more likely that only one new line will become operational.
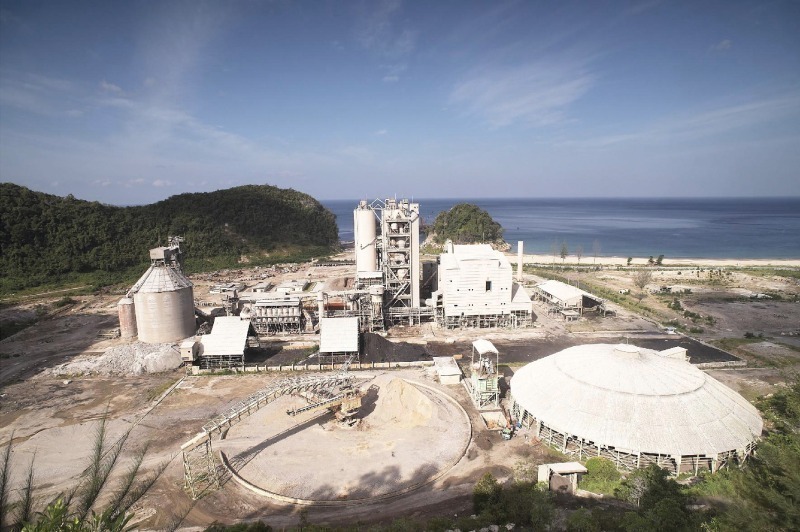
5th place in the ranking is taken by Semen Baturaja (Persero), who set up a cement mill with 0.75 Mta capacity in 2013. The two other cement producers in Indonesia are Lafarge Indonesia, who have one integrated 1.6 Mta plant (Fig. 12) at Aceh, in the North of Sumatra and Semen Kupang (0.5 Mta), who were taken over by the Ganda Group of Singapore.
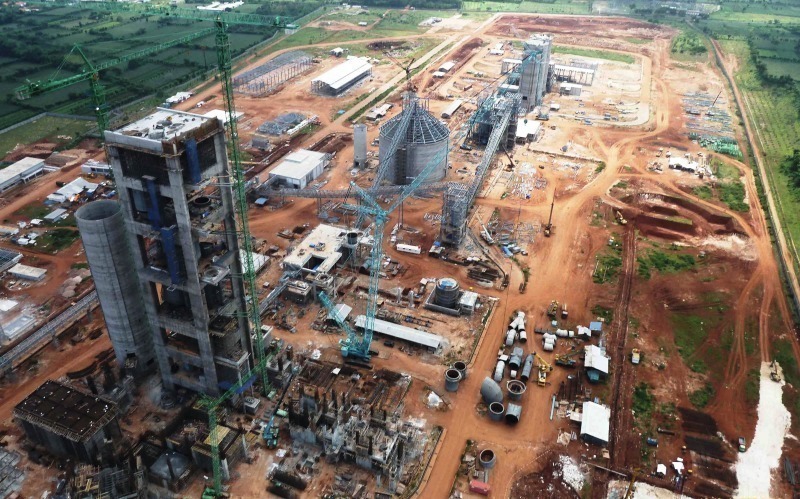
The Ganda Group is one of many newcomers to Indonesia, who want to take part in Indonesia’s cement boom. The Ganda Group, through its subsidiary PT Cemindo Gemilang will install a 10 000 tpd plant in Banten. In June 2014 about 60 % of the construction was completed. Siam Cement is another investor, that will install a 1.8 Mta greenfield cement plant in West Java. The other three projects in progress are a 1.4 Mta greenfield plant by Anhui Conch Cement and two other 1.5 Mta greenfield plants by Semen Panasia in Central Java and by Jui Shin Indonesia (Fig. 13) in West Java. Apart from these projects a number of other announcements were made, such as a 2.4 Mta plant by Chinese CNBM, a 4.5 Mta plant by Ultratech from India and a 3.3 Mta cement plant by Semen Barru. But none of these projects are likely to be completed in the next few years.
5 Prognosis of new cement and clinker capacity
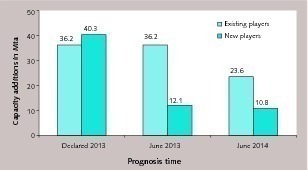
There are a number of sources such as Semen Indonesia, who provide estimates about the additional cement capacity in Indonesia in the coming years. In 2013 the prognosis was that the cement capacity could almost double between 2013 and 2017 (Fig. 14). The existing players announced 36.2 Mta, while 40.3 Mta were announced by newcomers, including the Ganda Group. In June 2013 Semen Indonesia reduced their forecast of the newcomer’s cement capacity to only 12.1 Mta. This was further reduced to 10.8 Mta by June 2014. With the decline in the demand for cement and the decline in growth rates from more than 10 % to 6 % the forecast for additional cement production facilities for existing players by June 2014 was reduced to 23.6 Mta. In total from 2013 to 2017 34.4 Mta of new cement capacity will be installed, which is 56 % of the existing capacity.
Figure 15 shows how the cement capacity will grow by 2017 according to Semen Indonesia. The existing cement capacity in 2013 was estimated with 68 Mta. 3.5 Mta was added in 2013, leading to 71.5 in 2014. Largest additions will be in 2014 with 10.7 Mta and in 2015 with 15.6 Mta, by 2016 a cement capacity of almost 98 Mta will be achieved. With the prognosis of 23.6 Mta by existing players and 10.8 Mta by newcomers before 2017 Indonesia’s cement capacity will increase to 102.4 Mta.
OneStone Consulting identified 18 new cement projects in Indonesia, which are at this moment planned to be installed by 2017 and which will bring 36.1 Mta of new cement capacity and 25.2 Mta of new clinker capacity. The projects comprise new grinding plants as well as greenfield and brownfield cement plants (Table 2). The largest projects will be those of Cemindo Gemilang (Semen Merah Putih), with a 3.2 Mta new clinker capacity in the Banten province, the Indarung and Rembang projects by Semen Indonesia with 2.5 Mta clinker capacity each, and the 3.2 Mta clinker capacity project by Indocement in Citeurop.
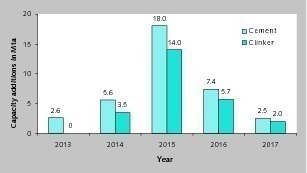
According to the timetable of these projects most of the capacity will be operational in 2015 (Fig. 16). In 2013 the addition of 2.6 Mta cements capacity was achieved by two grinding projects. In 2014 four projects will become operational. Holcim Tuban 1, Jui Shin (Garuda Cement) and Anhui Conch (PT Conch Cement) were successfully commissioned adding 3.5 Mta of new clinker and 5.6 Mta of new cement capacity. In 2015 about nine projects could become operational with 14 Mta of clinker and 18 Mta of cement capacity. At present only three more projects will be finished between 2016 and 2017.
6 Outlook
The outlook for Indonesia’s cement industry is not as promising as it was one year ago. The economy and the construction industry have cooled down to more moderate growth rates and the outlook for the cement industry is more moderate with 6.0 % growth rates in the coming years. The number of cement capacity addition projects has been adjusted, postponed or cancelled, so that with the most feasible projects the risk of large overcapacity issues is not so high. Nevertheless the current very high capacity utilization rates of 94-95 % will not be achieved in the next few years.
Überschrift Bezahlschranke (EN)
tab ZKG KOMBI EN
This is a trial offer for programming testing only. It does not entitle you to a valid subscription and is intended purely for testing purposes. Please do not follow this process.
This is a trial offer for programming testing only. It does not entitle you to a valid subscription and is intended purely for testing purposes. Please do not follow this process.
tab ZKG KOMBI Study test
This is a trial offer for programming testing only. It does not entitle you to a valid subscription and is intended purely for testing purposes. Please do not follow this process.
This is a trial offer for programming testing only. It does not entitle you to a valid subscription and is intended purely for testing purposes. Please do not follow this process.