Improving the thermal insulation properties of thin-bed mortar|Part II: Effects of selected admixtures and combinations thereof on material properties, in particular pore-size distribution, thermal conductivity and compressive strength


![22 CaCO3 contents [wt.%] of a modified thin-bed mortar specimen containing 10 vol.% fumed silica compared with a thin-bed mortar zero sample after 2, 7, 14, 21 and 28 days of hardening, hydrated in air and in exclusion of CO2 (N2)](https://www.zkg-online.info/imgs/1/3/4/1/2/1/9/Materials_Krcmar2_Figure_22-7c19d6633df659c3.jpeg)


The thermal properties of thin-bed mortar can be optimized with the aid of special admixtures. Adding fumed silica, for example, reduces the thermal conductivity. The combined addition of fumed silica and expanded aluminosilicate also yields thermal optimization of thin bed mortar. Both thusly modified thin-bed mortars meet the requirements of compressive strength class M 10. The higher the pore volume ratio, the more successfully thermal conductivity can be reduced.
1 Introduction and objectives
The main objective of the subject research work was to develop a new type of thin-bed mortar characterized by reduced thermal conductivity with no loss of compressive strength. In Part I of this report [1], a series of solitarily added admixtures were screened. Thin-bed mortar components with grain sizes ≥ 125 µm were proportionately substituted by selected admixtures, and the material engineering parameters of cured thin-bed mortar samples were experimentally determined. Fumed silica, expanded perlite and expanded aluminosilicate were identified as very suitable...
1 Introduction and objectives
The main objective of the subject research work was to develop a new type of thin-bed mortar characterized by reduced thermal conductivity with no loss of compressive strength. In Part I of this report [1], a series of solitarily added admixtures were screened. Thin-bed mortar components with grain sizes ≥ 125 µm were proportionately substituted by selected admixtures, and the material engineering parameters of cured thin-bed mortar samples were experimentally determined. Fumed silica, expanded perlite and expanded aluminosilicate were identified as very suitable admixtures. Now, in Part II of the subject research project, it was investigated how increasing additions of the favored admixtures, both solitarily and in combinations, affect the material properties of the thin-bed mortar system.
2 State of the art
Several aspects of this topic have already been investigated in earlier works. This includes modified cements, lightweight concretes and mortar products [2-6]. These papers described in general how different admixtures impact individual material parameters such as compressive strength, thermal conductivity and bulk density. The present investigations, however, deal with correlating material parameters of thin-bed mortar by addition of admixtures and are therefore new in that sense. The studies conducted in the first part of this research work [1] showed that thin-bed mortar can be thermally optimized by the targeted use of special admixtures. For example, the addition of 10 vol.% fumed silica reduced the thermal conductivity of the mortar from λ10, dry = 0.21 to 0.17 W/(m·K), or 19 %. Not only was the compressive strength class M 10 maintained, but the 28-day compressive strength even increased by nearly 16 %, from βD = 10.3 to 11.9 MPa. A 10 vol.% addition of expanded perlite improved the compressive strength by 99 %, from βD = 10.3 to 20.5 MPa. Also, a 10 vol.% dose of expanded aluminosilicate lowered the thermal conductivity of the thin-bed mortar from λ10, dry = 0.21 to 0.18 W/(m·K), or 14 %.
3 Experiments
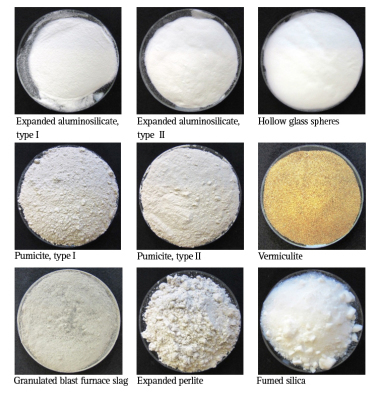
The employed starting material, obtained from a well-known manufacturer, was thin-bed mortar with a thermal conductivity of λ10, dry = 0.21 W/(m·K) and compressive strength classed as M 10, i.e., the same as already used in Part I of this work. The mortar was separated by screening into the appropriate fractions, and the coarse screen fractions ≥ 125 µm were proportionately replaced with powdered admixtures of “fumed silica”, “expanded perlite” and “expanded aluminosilicate”, both solitarily and in combinations. Figures 2 through 8 are photographs and micrographs of the selected admixtures. The formulations were calculated according to the concrete volume method [1]. The thin-bed mortar zero samples were produced in accordance with the manufacturer’s specifications with a water-mortar ratio of 0.58. The other mixture series required appropriate variation of the water-mortar ratio, always with care taken to the “capping” property of the thin-bed mortar [7]. Following 7- and 28-day storage, respectively, of the thin-bed mortar samples, their material-engineering parameters were determined, including their dynamic modulus of elasticity (Young’s modulus), three-point bending/compressive strength, dry bulk density and thermal conductivity, λ10, dry. Also investigated was the influence of pore size and pore-size distribution. The tests were performed by way of mercury porosimetry, gas adsorption and gas pycnometry, supplemented by radiological, thermographic and scanning electronic microscopic examinations (XRF/XRD, TG and SEM).
In order to clarify which reactions or clinker phases could be responsible for the gain in the compressive strength of thin-bed mortar on addition of fumed silica, comparative X-ray analyses were carried out. The results of XRD analyses of thin-bed mortar zero samples with a water-mortar ratio of 0.58 were compared with those of XRD analyses of mortar mixtures containing 10 vol.% fumed silica and exhibiting a water-mortar ratio of 1.00 after ageing times of 2, 7, 14, 21 and 28 days. The fact that parallel samples were cured in CO2 exclusion on the one hand and in normal, ambient air on the other was of particular importance. In the case of CO2 exclusion, the thin-bed mortar samples were aged in a desiccator that was first evacuated and then flooded with nitrogen (Figure 1). The corresponding parallel samples were stored under normal laboratory atmospheric conditions [8]. The investigations involved multiple determinations.
The fumed silica images show agglomerates of various size (Figures 3 and 4). The expanded perlite is composed of snowflake-like agglomerates (Figures 5 and 6), while the expanded aluminosilicate consists of separate spherical grains (Figures 7 and 8).
4 Preliminary examination of starting products
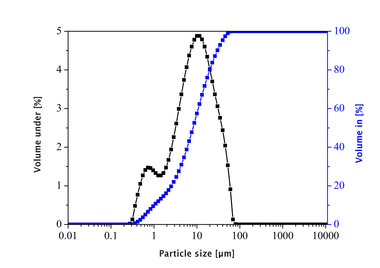
The unsifted dry mortar powder and selected admixtures were examined in terms of the following parameters: particle size (d50 value), particle density, specific surface area (BET, cf. Table 1), radiographic examination (XRF and XRD; Table 2, Figures 9 and 10) and porosity analysis (Table 3, Figures 12 and 13).
The fumed silica displayed a comparatively large BET surface area of 181.68 m2/g and, at 10.06 µm, the lowest d50 value. Both results are indicative of the admixture’s elevated reactivity. XRF analysis (Table 2) showed that the employed admixtures have different SiO2 and Al2O3 contents. Nearly 100 % of the silica consisted of amorphous silicon dioxide. The compositions of the expanded perlite and of the expanded aluminosilicate were mutually similar. Their compositions, comprising some 75 wt.% silica, approximately 13 wt.% alumina and mutually similar contents of sodium, potassium and iron oxide, differed significantly from the composition of fumed silica.
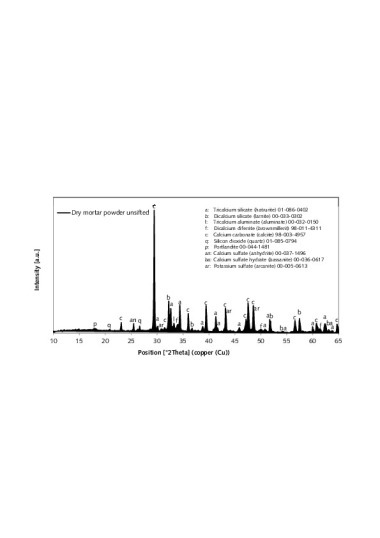
Typical Portland cement clinker phases were identified in the XRD analysis of the unsifted thin-bed mortar powder (C3S, C2S, C3A, C2(A,F)) (Figure 9) [9]. Those phases are marked accordingly with a respective “a”, “b”, “l” or “f”. Calcite (c) and quartz (q) were also detected. The sulphate carriers in the unsifted thin-bed mortar powder were anhydrite (an), bassanite (ba) and arcanite (ar).
XRD analysis of the admixtures (Figure 10) identified the fumed silica as consisting of two SiO2 modifications – tridymite and α-quartz [10]. Corresponding investigation of the expanded perlite revealed soda-lime feldspar and α-quartz as the crystalline phases. The exact composition, however, could not be determined due to the low intensities. Alkali feldspars were identified in the expanded aluminosilicate [11]. The XRD traces of all three admixtures showed significant elevation of the substrate in the range between 15 and 35 °2J (X-ray amorphous fraction).
The evaluation range of pore analysis via mercury porosimetry (Table 3) extends from the upper measuring limit of the macro-pores (205 µm) to the range of meso-pores between 50 and 2 nm. The gauged powders contained no micro-pores with diameters below 2 nm. The specific pore volume was proportionally converted to three pore-size ranges (Table 3, column 3). The most common pore diameter (modal value) and the mean pore diameter (median value) refer to the entire pore range (205 µm to 20 nm). Figures 12 and 13 show the cumulative and specific pore volumes as functions of pore diameter. Figure 11 shows a prepared powder sample prior to mercury intrusion.
The investigations showed the unsifted dry mortar powder to have a lower specific total pore volume (0.75 cm3/g) than that of the admixtures (Table 3). The fumed silica had the highest pore volume (14.70 cm3/g) and displayed a conspicuous pore diameter of dP = 25 nm in the meso-pore region, along with a high proportion of pores with diameters exceeding 4 µm and extending to the upper measuring limit of 205 µm (Figure 13). The broad distribution of pore diameters is plausible, considering the differences in size of the agglomerated particles (Figures 3 and 4). The specific pore volumes of the expanded perlite and expanded aluminosilicate came to 4.85 and 6.82 cm3/g, respectively. The expanded perlite displayed a monomodal pore size distribution (Figure 13) with an average diameter of dP = 8.01 µm. The mean pore diameter of the aluminosilicate was established at dP = 5.73 µm. Neither the perlite nor the aluminosilicate had any (or only very few) pores smaller than 50 nm (Table 3, column 3).
5 Preparation of thin-bed mortar samples by the
concrete volume calculation method
The thin-bed mortar mixtures were prepared with increasing contents of admixtures, both individually and in combinations, and samples for use in determining the material parameters were prepared from them. The thin-bed mortar formulations containing admixtures were calculated according to the concrete volume calculation method, in the process of which the coarse fraction of the basic mixture with a grain size of xi ≥ 125 µm was always substituted proportionately, either by individual admixtures or by combinations thereof, in amounts ranging between 5 and 15 vol.%. The fines fraction, however, remained unaltered, since it constitutes the binder fraction of mortar and therefore contributes significantly to strength evolution [12]. The water-mortar ratio of the thin-bed mortar zero samples began at 0.58 (producer data) and was gradually increased with each rise in admixture addition.
Due to the large BET surface area of the fumed silica (181.68 m²/g), additional water was required for producing the thin-bed mortar containing 10 vol.% admixture. Consequently, in this case, the water-mortar ratio was 1.00. The preparation of 2 l of thin-bed mortar containing 10 vol.% fumed silica according to the concrete volume calculation method involved substitution of 10 vol.% of the coarse fraction xi ≥ 125 µm of the zero sample (Table 4).
6 Findings
After the thin-bed mortar had had time to cure, the individual values were experimentally determined and the material parameters dynamic modulus of elasticity, three-point flexural strength and compressive strength were calculated after 7 and 28 days, respectively. The BET surface area, thermal conductivity λ10, dry and dry bulk density were determined after 28 days. Table 5 compares those findings with the corresponding mean values of the thin-bed mortar zero sample.
6.1 Specific surface area (BET)
The thoroughly hardened zero sample of thin-bed mortar displayed a specific surface area (BET) of 17.34 m2/g on average. The addition of 10 vol.% fumed silica caused the BET surface area to rise to a maximum of 64.52 m2/g at a water-mortar ratio of 1.10. Increasing the water-mortar ratio to 1.20, 1.40 and 1.65, respectively, resulted in decreasing BET surface areas of the mortar mixtures, though they did remain significantly higher in comparison with the zero sample. In reaction to 5, 10 and 15 vol.% addition of expanded perlite in association with water-mortar ratios of 0.73, 0.87 and 1.00, respectively, the BET surface areas dropped off in comparison with the zero sample. The combined addition of fumed silica and expanded perlite caused the BET surface areas to rise from 17.34 to 51.99 m2/g for all mixing ratios and water-mortar ratios increasing from 0.58 to 1.70. The combined addition of fumed silica and expanded aluminosilicate (5 vol.% each) yielded larger BET surface areas for all water-mortar ratios as compared to the zero sample.
6.2 Dynamic modulus of elasticity
The dynamic modulus of elasticity of the thin-bed mortar zero sample amounted to 5.3 and 4.4 GPa on average after 7 and 28 days, respectively. On addition of 10 vol.% fumed silica and increasing water-mortar ratios, the elastic modulus values dropped off in comparison with those of the zero sample after 7 and 28 days. The water-mortar ratio 1.00 induced a minor increase in the elastic modulus from 4.4 to 4.5 GPa after 28 days. Admixtures of 5 to 15 vol.% expanded perlite in combination with increasing water-mortar ratios also yielded elastic moduli below the zero-sample values. In the case of the combinatorial series involving fumed silica together with expanded perlite in doses of 5 vol.% each and a water-mortar ratio of 0.70, the elastic modulus rose to 6.6 GPa after 7 days, falling to 6.3 GPa after 28 days. The modulus of elasticity registered for a mortar mixture with the same combination of admixtures and a water-mortar ratio of 0.80 amounted to 4.9 GPa after 7 days, i.e., lower than that of the zero sample (5.3 GPa). After 28 days, however, the modulus of elasticity was found to have increased from 4.4 GPa to 4.8 GPa in comparison with the zero sample. The E-moduli of the mortar mixtures with water-mortar ratios of 1.00 and 1.22 remained below those of the zero sample after 7 and 28 days, respectively. Addition of 7.5 vol.% fumed silica and expanded perlite together in combination with water-mortar ratios of 1.35, 1.53 and 1.70 yielded lower E-moduli after both 7 days and 28 days, as compared to the zero sample. In the combinatorial series with 5 vol.% each of fumed silica and expanded aluminosilicate, the elastic moduli rose to 5.8 and 5.1 GPa, respectively, after 28 days in mixtures with water-mortar ratios of 0.70 and 0.80. The E-moduli of the mixtures with water-mortar ratios of 0.90, 1.00, 1.10 and 1.20 remained below the values of the zero sample.
6.3 Three-point flexural strength
At 7 days, the thin-bed mortar zero samples displayed an average three-point flexural strength value of βB = 1.3 MPa, rising to βB = 2.5 MPa at 28 days. The series of mixtures containing fumed silica shows that increasing the water-mortar ratio caused a decrease in flexural strength both at 7 days and at 28 days. Addition of expanded perlite invariably enhanced the 7-day flexural strength, no matter how much was added or which water-mortar ratio was used. For an addition of 5 or 10 vol.%, the 28-day flexural strength rose to 3.0 and 2.7 GPa, respectively, in comparison with the zero sample. At 28 days, a 15 vol.% admixture produced lower flexural strength (βB = 1.9 MPa). The combined addition of fumed silica and expanded perlite also yielded lower values for various water-mortar ratios. Indeed, the only water-mortar ratios to yield slightly better results at 7 days were 0.70 and 0.80. At 28 days, no mixing ratio produced flexural strength values superior to those of the zero sample. No combination of fumed silica and expanded aluminosilicate enabled an improvement in flexural strength to beyond that of the zero sample.
6.4 Compressive strength and thermal conductivity
After setting times of 7 and 28 days, the thin-bed mortar zero sample displayed respective compressive strength levels of 8.0 and 10.3 MPa, and the average thermal conductivity at 28 days amounted to λ10, dry = 0.21 W/(m·K), hence meeting the manufacturer’s specifications (Figure 14).
At a water-mortar ratio of 1.00, the addition of 10 vol.% fumed silica yielded a constant compressive strength at 28 days, while the mortar’s thermal conductivity dropped to λ10, dry = 0.15 W/(m·K) (Table 5). This corresponds to a 28.6 % improvement in thermal insulation properties. On addition of expanded perlite, it was noted that a gradual increase in dosage from 5 to 15 vol.% in tandem with appropriate changes in the water-mortar ratio led to decreasing compressive strength.
The addition of 5 vol.% expanded perlite produced an initial gain in thermal conductivity, while higher dosages induced a loss (Table 5).
The tests conducted on combined mixtures containing both fumed silica and expanded perlite were found to lower the thermal conductivity of nearly every mortar mixture in comparison with that of the zero sample. At the same time, however, the compressive strength proved lower at both 7 days and 28 days (Table 5). Nevertheless, the mortar mixture containing 5 vol.% each of silica and perlite and having a water-mortar ratio of 0.80 can be regarded as a promising combination, because it was seen to lower the thermal conductivity by 9.5 %, to λ10, dry = 0.19 W/(m·K). The corresponding compressive strength at 28 days amounted to βB = 9.0 MPa, or 12.6 % below that of the zero samples (10.3 MPa).
Finally, with regard to the combinatorial mixtures of fumed silica and expanded aluminosilicate, the same connection between compressive strength and thermal conductivity was observed as for most of the mortar mixtures, that is, the desired decrease in thermal conductivity goes hand in hand with an undesirable decrease in compressive strength (Table 5). The only exception to this observation was the combinatorial mixture containing 5 vol.% each with a water-mortar ratio of 0.80. With that mixing ratio, the thermal conductivity can be reduced from λ10, dry = 0.21 W/(m·K) (zero sample) to λ10, dry = 0.18 W/(m·K), or 14.3 %. The corresponding 28-day compressive strength, at βB = 10.0 MPa, was in compliance with compressive strength class M 10 requirements.
6.5 Porosity analysis of thin-bed mortar samples
In order to better understand the results obtained, in particular with regard to the observed changes in the compressive strength and thermal conductivity of the modified thin-bed mortar mixtures (Figure 14), porosity analyses were performed by means of mercury porosimetry, gas adsorption and gas pycnometry. The tests were carried out on set and hardened mortar after a curing period of 28 days (Table 6). The cumulative and specific pore volumes of the hardened thin-bed mortar samples are charted out as functions of pore diameter in the diagrams of Figures 15 and 16. The thin-bed mortar zero sample displayed a specific total pore volume of 0.70 cm3/g, while the most common and mean pore diameters amounted to 2.73 and 1.36 µm, respectively, and the particle density came to 2.08 g/cm3 (Table 6). The porosity analysis documents the fact that the solitary inclusion of 10 vol.% fumed silica and a water-mortar ratio of 1.00 produced no overall change in pore volume. The most frequent and mean pore diameters in the sample mortar amounted to 0.44 µm and 0.29 µm, respectively. Compared to the zero sample, however, the meso-pore fraction (50 to 2 nm) was higher by 626 %. That resulted in a lowering of the thermal conductivity from λ10, dry = 0.21 to 0.15 W/(m·K), or 28.6 %.
The combined addition of 5 vol.% each fumed silica and expanded perlite – at a water-mortar ratio of 0.80 – decreased the specific total pore volume to Vq = 0.61 cm3/g and reduced the thermal conductivity to λ10, dry = 0.19 W/(m·K). Again, the reduction can be attributed to a 204 % increase in the volume of meso-pores. The most frequent and average pore diameters were 0.36 and 0.34 µm, respectively.
Regarding the combined admixture of fumed silica and expanded aluminosilicate at the rate of 5 vol.% with a water-mortar ratio of 0.80, the total pore volume declined from 0.70 cm3/g (zero sample) to 0.65 cm3/g. The meso-pore volume was seen to increase by 291 % - again attributable to the particular influence of fumed silica. That led to a reduction in thermal conductivity from λ10, dry = 0.21 to 0.18 W/(m·K), or 14.3 %. The most frequent and average pore diameters in this case amounted to 0.39 and 0.30 µm, respectively.
Mercury porosimetry analysis showed that the modified thin-bed mortar samples were characterized, all in all, by finer capillary pores in the meso-pore range between 5 and 0.01 µm as compared to the zero sample, and that they contained comparatively few air pores in the range between 1000 and 5 µm (Figures 15 and 16).
Calculation of the meso-pore/macro-pore volume ratio for the diameter range between 1000 and 100 nm points to a clear correlation between the thermal conductivity and the corresponding compressive strength of the thin-bed mortar samples (Figure 16, Table 6):
Pore volume ratio = ⇥(1)
A pore volume ratio of 0.09 was calculated for the thin-bed mortar zero sample (Table 6, column 8). The most successful thin-bed mortar mixture, with 10 vol.% fumed silica and a water-mortar ratio of 1.00, displayed the highest pore volume ratio (0.47) of all mixture series tested. The addition of 5 vol.% each fumed silica and expanded perlite yielded a pore volume ratio of 0.17, while a dosage of 5 vol.% each of fumed silica and expanded aluminosilicate generated a pore volume ratio of 0.23. This study shows that increasing pore volume ratios and, hence, increasing meso-pore volumes reduce the thermal conductivity of thin-bed mortar while retaining its compressive strength. Table 6 shows the porosity and compressive strength data of the modified thin-bed mortar, as calculated according to equation 2 [13], in comparison with the zero sample:
Φ = · 100 %⇥(2)
Φ: porosity [%]
Vq: specific total pore volume [cm3/g]
ρS: particle density [g/cm3]
This study establishes that the cured thin-bed mortar zero sample had a porosity of 59.1 %, a compressive strength of 10.3 MPa and a thermal conductivity of λ10, dry = 0.21 W/(m·K) after 28 days of ageing. The modified mortar samples exhibited either the same or a lower specific pore volume, reduced thermal conductivity and relatively constant compressive strength (Table 6).
The porosity analysis of the finer meso-pore range between 75 and 5 nm was performed according to the gas adsorption method with nitrogen, as it was not accessible via mercury intrusion. The cumulative pore volumes of the modified mortar samples with admixtures of 10 vol.% each are shown in Figure 17 in comparison with the thin-bed mortar zero sample in dependence on pore diameter.
The thin-bed mortar zero sample with a water-mortar ratio of 0.58 had a specific pore volume of 0.059 cm3/g in the porosity range between 75 and 5 nm. Adding 10 vol.% fumed silica to a mixture with a water-mortar ratio of 1.00 caused the specific pore volume in the meso-pore region below 50 nm to increase to 0.261 cm3/g. The specific pore volumes of the combined mortar mixtures containing 5 vol.% each of fumed silica and expanded aluminosilicate or expanded perlite amounted to 0.180 and 0.169 cm3/g, respectively. The test results of gas adsorption analysis corroborate the results of mercury porosimetry.
6.6 X-ray analysis (XRD)
Samples hydrated both under CO2 exclusion and in a laboratory air atmosphere were subjected to XRD analysis [14]. For the presentation of the XRD findings, the range between 25 and 35 °2J was considered (Figure 18). The clinker phases most commonly found in cement were detected in the samples [1, 15]. The corresponding reflections carry the designations “a”, “b” and “l”. Calcite (c) and quartz (q) were also found in the samples, along with the hydration products ettringite (e) and portlandite (p).
6.6.1 Portlandite degradation
The hydration of thin-bed mortar samples always involves the formation of calcium hydroxide (portlandite), as proven by the corresponding reflections (Figure 18). The addition of 10 vol.% fumed silica to the thin-bed mortar matrix can be assumed to allow a chemical reaction between the portlandite and the SiO2. The portlandite is gradually degraded with increasing hardening time, as confirmed by a gradual decrease in reflections after hardening times of 2, 7, 14, 21 and 28 days. Presumably, this is due to the degradation of portlandite as described in the literature, which results in the formation of additional hardenable compounds (C-S-H phases [12, 16]).
Comparing the X-ray diffractograms of the thin-bed mortar zero samples (Figure 18), the portlandite intensities resulting from hydration under CO2 exclusion in the desiccator are seen to be slightly higher (after 7 and 14 days) to significantly higher (after 21 and 28 days) than those resulting from hydration in ambient air. This behavior can be attributed to the difference in relative humidity between nearly 100 % in the desiccator and approximately 60 % in an air atmosphere. During hydration under CO2 exclusion in a desiccator, comparatively more reactive water is available than during hydration in room air.
The sample containing 10 vol.% silica is seen to display the same behavior as the zero samples, but, by way of comparison, the portlandite intensities (“p” at 34.1 °2J) are seen to have increased only slightly after 14, 21 and 28 days. These mildly elevated reflections may possibly be attributable to the presence of “unconsumed” calcium hydroxide, since the amorphous silicon dioxide content of the silica reacted wholly with the calcium hydroxide within the first 14 days (Figure 18, right). The mortar samples hydrated under CO2 exclusion also display lower intensities of the main clinker phases alite, belite and aluminate, hence indicating more thorough consumption of those phases. Accordingly, it may be assumed that complete hydration or undisturbed, complete pozzolanic reaction of the fumed silica with the calcium hydroxide takes place in exclusion of CO2. In a laboratory atmosphere, however, where relative humidity is comparatively low, either hydration remains incomplete or the pozzolanic reaction and carbonation are disturbed.
6.6.2 Portlandite degradation via carbonation
The thin-bed mortar samples hydrated in a labora-tory atmosphere (Figure 18, left) displayed constant or increasing calcite intensities in the course of hydration. Presumably, this induces the degradation of portlandite and simultaneous formation of calcite. In contrast to that, the hydration of thin-bed mortar under CO2 exclusion in a desiccator revealed a more differentiated situation. Thanks to the experimental setup in which samples were aged in the desiccator (initially evacuated and then flooded with N2 at atmospheric pressure), it was possible to completely prevent carbonation of the samples caused by CO2 in the air. Consequently, no “additional” CO2 was transferred from the air to the thin-bed mortar. This effect is most obvious in the thin-bed mortar zero sample (Figure 18, right), where the calcite intensities are lower. The silica-containing thin-bed mortar sample displayed the same calcite intensities under CO2 exclusion as in a laboratory atmosphere. One reason for this could be the higher water-mortar ratio of 1.00, which may possibly promote spontaneous carbonation in the course of sample preparation and XRD analysis.
6.7 Thermogravimetric analysis (TG) of portlandite degradation
In order to quantify the results of XRD analysis, thermogravimetric examinations were performed analogously (Figures 19 and 20). Figure 19 depicts the loss of mass of a thin-bed mortar zero sample (water-mortar ratio 0.58) and of a thin-bed mortar sample containing 10 vol.% fumed silica (water-mortar ratio 1.00) at sample ages of 2, 7, 14, 21 and 28 days, all of which were hydrated in laboratory air. By way of comparison, the mass loss is shown in dependence on the temperature of the thin-bed mortar samples hydrated in an N2 atmosphere under CO2 exclusion (Figure 20).
For purposes of evaluation, the mass losses of the thin-bed mortar samples within certain temperature ranges (Figures 19 and 20, Table 7) were compared with each other. Between room temperature and 390 °C, the hydrate phases ettringite, tetracalcium aluminate hydrate or calcium silicate-hydrate were continuously dehydrated to varying degrees in all mortar samples [12, 17, 18]. At temperatures beyond 390 °C, the portlandite gave off water to form calcium oxide (Figures 19 and 20, Table 7, column 10/11). For all mortar samples, dehydration was complete at 460 °C.
In the case of samples containing silica, there was also a pronounced loss of water in the temperature range up to 120 °C. This can be attributed to the elevated water-mortar ratio of 1.00. The decarbonation of CaCO3 (Figures 19 and 20, Table 7, column 14/15) formed by carbonation of Ca(OH2) or CaO and CO2 commenced at temperatures between 640 and 715 °C [19].
6.7.1 Portlandite degradation
Substituting 10 vol.% of the coarse fraction (≥ 125 µm) of the thin-bed mortar matrix with fumed silica (water-mortar ratios 1.00) enabled the SiO2 to react chemically with the available portlandite (Figure 21, Table 7, column 10/11). Comparison of the portlandite masses calculated according to (3) [20] in the thin-bed mortar zero sample shows that higher portlandite masses were present in the thin-bed mortar during hydration for 2 to 28 days under CO2 exclusion than during hydration in ambient air (Figure 21).
mCH = • mH = • mH = 4.11 • mH
[wt.%]⇥(3)
where: nx =
mCH: mass of Ca(OH)2 [wt.%]
MCH: molar mass of Ca(OH)2 = 74.093 [g/mol]
MH: molar mass of H2O = 18.015 [g/mol]
mH: mass H2O / loss of mass [wt.%]
nx: amount of substance [mol]
After a setting time of 28 days, the zero sample hardened under CO2 exclusion exhibited a portland-ite mass of 4.33 mg, corresponding to 13,53 wt.% (Figure 21, Table 7), while the zero sample hardened in laboratory air for the same length of time had a portlandite mass of 3.29 mg, corresponding to 10.28 wt.%. Again, the formation of different portlandite masses can be traced to differences in relative humidity. For example, the samples hardened under CO2 exclusion in the desiccator contained more water for hydration, so comparatively more portlandite could be produced.
Initially, i.e., after 2 and 7 days, the samples containing silica exhibited comparable amounts of portlandite. After setting times of 2 and 7 days under CO2 exclusion, portlandite masses of 5.59 and 6,00 wt.% were determined, i.e., only slightly more than that resulting from hydration with CO2 exposure, which yielded portlandite masses of 5.14 and 5.88 wt.% (Figure 21, Table 7, column 10/11). After hydration periods of 14, 21 and 28 days, no more calcium hydroxide was consumed in the absence of CO2; the average portlandite mass was 6 wt.%. It may be assumed that hardening of the thin-bed mortar under CO2 exclusion promotes an undisturbed pozzolanic reaction between the fumed silica and the calcium hydroxide.
Conversely, hardening in a laboratory air atmosphere leads to a disturbed pozzolanic reaction between the fumed silica and the calcium hydroxide and to weak carbonation due to the insufficient supply of water. Thus, as the mortar hardened in air, the detected mass of portlandite increased further to 6.83, 7.77 and 8.02 wt.%, respectively, after 14, 21 and 28 days, and the attendant pozzolanic reaction was comparatively weak. In sum, it can be said that, within a setting time of 28 days under CO2 exclusion, portlandite degradation amounting to 13,53 wt.% of the zero sample took place, compared to 5.96 wt.% of the modified sample, for a difference of 56 %. When the setting process took place in air instead, the portlandite degradation occurring during the same setting period ran from 10.28 wt.% to 8.02 wt.%, that is 22 % (Figure 21, Table 7, column 10).
6.7.2 Carbonation/decarbonation
The thin-bed mortar zero sample was found to have lost 1.65 wt.% CO2 at the end of a 28-day setting time in the range of temperatures between 640 and 715 °C. This corresponds to a calcium carbonate mass of 1.20 mg or 3.75 wt.% (Figure 22, Table 7, column 14/15, equation 4 [20]). When the thin-bed mortar zero sample was hydrated under CO2 exclusion, the amount of CO2 loss was 0.50 wt.%, and the CaCO3 mass amounted to 0.36 mg, or 1.14 wt.%.
mCc = • mc = • mc = 2.27 • mc
[wt.%]⇥(4)
mCc: mass of CaCO3 [wt.%]
MCc: molar mass of CaCO3 = 100.0869 [g/mol]
Mc: molar mass of CO2 = 44.0100 [g/mol]
mc: mass of CO2 / loss of mass [wt.%]
In comparison with the zero sample, decarbonation of the sample containing silica was also more pronounced in air (5.00 wt.%) than under CO2 exclusion (0.73 wt.%). Figure 22 documents the fact that, for all mortar samples, both carbonation and decarbonation are less pronounced in the absence of CO2. The exact opposite is true with air exposure, namely comparatively more carbonate forms as a function of time.
6.8 Scanning electronic microscopy (SEM)
Figure 23 shows a typical fracture face of a thin-bed mortar sample in 1000-x (left) and 5000-x magnification (right) after a setting time of precisely 28 days in air. Hydration products in the form of ettringite needles, C-S-H phases and portlandite are discernible.
In Figure 23, acicular ettringite is seen in the accompaniment of hexagonal portlandite plates. The very fine ettringite needles reached lengths of roughly 1 to 3 µm and were found in association with the C-S-H phases and the portlandite.
Figure 24 shows the fracture face of a typical thin-bed mortar sample with 10 vol.% fumed silica in 1000-x (left) and 5000-x magnification (right) after a setting time of 28 days in air. The 5000-x SEM image (right) exhibits a dense “lawn” of additionally formed, strength-enhancing C-S-H phases in intimate association with ettringite needles. The formation of additional C-S-H phases can be attributed to the pozzolanic reaction between calcium hydroxide (portlandite) and the amorphous silicon dioxide of fumed silica.
7 Summary
The work presented demonstrates that the substitution of coarse fractions above 125 µm of the subject thin-bed mortar with selected admixtures promotes thermal optimization with no loss of compressive strength.
The targeted substitution of coarse mortar fractions with 10 vol.% fumed silica reduced the thermal conductivity from λ10, dry = 0.21 to 0.15 W/(m·K), or 28.6 %. This reduction can be attributed to a 626 % gain in pore volume in the meso-pore range between 50 and 2 nm. At the same time, the observed compressive strength values of modified specimens remained within the targeted compressive strength class M 10. This unusual effect can be ascribed to the pozzolanic reactivity of fumed silica with portlandite, attended by additional formation of C-S-H phases. XRD analysis qualitatively demonstrated that the portlandite intensities in mortar containing 10 vol.% fumed silica remained lower over the entire hydration period than those observed for the zero sample containing no fumed silica. By way of thermographic investigations, a portlandite content of 10.28 wt.% was determined in the thin-bed mortar zero sample. The addition of 10 vol.% fumed silica led to a pozzolanic reaction inducing portlandite degradation to 8.02 wt.%, or 22 %. The corresponding SEM images confirm the results of XRD and TG analysis.
When the coarse fractions above 125 µm were replaced with a combined admixture of 5 vol.% fumed silica and 5 vol.% expanded perlite, the thermal conductivity of the thin-bed mortar declined by 9.5 %, from λ10, dry = 0.21 to 0.19 W/(m·K). Once again, the reduction in thermal conductivity can be attributed to a 204 % increase in the volume of meso-pores. This time, however, the compressive strength did not remain within the desired compressive strength class M 10.
The combined admixture of 5 vol.% each fumed silica and expanded aluminosilicate also yielded thermal optimization of the thin-bed mortar from λ10, dry = 0.21 to 0.18 W/(m·K), or 14.3 %. This effect was due to a 291 % gain in meso-pore volume caused by the addition of fumed silica. The thus modified thin-bed mortar met the requirements of compressive strength class M 10.
Calculation of the pore volume ratios involving meso-pore volumes below 50 nm and macro-pore volumes ranging between 1000 and 100 nm yielded an unambiguous correlation: the higher the pore-volume ratio, the more successfully the thermal conductivity is reduced.
8 Prospect
Monolithic walls masoned with appropriately modified thin-bed mortar can be expected to display superior thermal insulation properties. Additional investigations are currently ongoing to determine whether this effect applies to plastering and rendering mortar, as well. Also, test walls consisting of highly insulative bricks masoned with modified thin-bed mortar are planned for test purposes. A thin-bed mortar exhibiting normal thermal conductivity of the order of λ10, dry = 0.21 W/(m·K) and the newly developed thin-bed mortar with λ10, dry = 0.15 W/(m·K) will again serve for purposes of comparison.
Überschrift Bezahlschranke (EN)
tab ZKG KOMBI EN
This is a trial offer for programming testing only. It does not entitle you to a valid subscription and is intended purely for testing purposes. Please do not follow this process.
This is a trial offer for programming testing only. It does not entitle you to a valid subscription and is intended purely for testing purposes. Please do not follow this process.
tab ZKG KOMBI Study test
This is a trial offer for programming testing only. It does not entitle you to a valid subscription and is intended purely for testing purposes. Please do not follow this process.
This is a trial offer for programming testing only. It does not entitle you to a valid subscription and is intended purely for testing purposes. Please do not follow this process.