Improving the thermal insulation properties of thin-bed mortar
Part I: Impact evaluations of various admixtures on material engineering parameters


Monolithic walls erected with an appropriately modified thin-bed mortar should show superior thermal insulation properties. Admixing 10 vol.% fumed silica proved to reduce by 19% the thermal conductivity of a typical thin-bed mortar belonging to compressive strength class M 10. Simultaneously, it also improved the mortar’s compressive strength by nearly 16 %. The investigations also showed that an admixture of expanded perlite can increase the compressive strength by 99 %.
1 Introduction
Thin-bed cement mortar is often used for masoning up such precision-ground, monolithic wall-building materials as bricks, autoclaved aerated concrete units (Ytong), or building blocks of pumicite, expanded clay or sandy limestone [1–3]. The corresponding material engineering parameters are governed by the applicable DIN specifications [4–7], which prescribe, for example, a compressive strength level of βD ≥ 10.0 MPa for class-M 10 mortar after 28 days of curing [8].
According to one market analysis, the thermal conductivity of products in this mortar category has been stagnating...
1 Introduction
Thin-bed cement mortar is often used for masoning up such precision-ground, monolithic wall-building materials as bricks, autoclaved aerated concrete units (Ytong), or building blocks of pumicite, expanded clay or sandy limestone [1–3]. The corresponding material engineering parameters are governed by the applicable DIN specifications [4–7], which prescribe, for example, a compressive strength level of βD ≥ 10.0 MPa for class-M 10 mortar after 28 days of curing [8].
According to one market analysis, the thermal conductivity of products in this mortar category has been stagnating at λ10, dry = 0.21 W/(m K) for many years [9]. However, a number of today’s highly insulative wall-building materials exhibit drastically lower equivalent thermal conductivity levels. The equivalent thermal conductivity of expanded-clay masonry units, for example, or of highly insulative, high-precision clay masonry units, amounts to only λequiv. = 0.07 W/(m K). A value comparison shows that mortar joints act as a thermal bridge in the wall system, even in the case of thin-bed mortar joints with a thickness of only 1 to 3 mm.
The work described below deals with the thermotechnical optimization of thin-bed mortar.
2 Objectives
The main objective of the subject research work was to develop a thin-bed mortar characterized by reduced thermal conductivity with no loss of compressive strength. A typical thin-bed mortar with a thermal conductivity value of λ10, dry = 0.21 W/(m K) served as the baseline material. In order to reduce the thermal conductivity of the mortar system, innovative pulverulent admixtures were introduced and their effects on the material engineering properties of the thin-bed mortar investigated. Some aspects of this subject matter have already been discussed in previous works dealing with modified cements, lightweight concretes and mortar products [9–16]. Those studies describe in general terms how different admixtures impact individual material parameters such as compressive strength, thermal conductivity and apparent density. As presented here, the investigations of correlating material parameters go beyond that knowledge level and are of a whole new nature. Each thin-bed mortar was prepared as specified by the manufacturer and tested under the same set of conditions [17, 18]. In a number of test series, the water/mortar ratio was subject to variation. The material properties, including the dynamic modulus of elasticity [19], the three-point flexural and compressive strength [8], the dry bulk density [20] and the thermal conductivity λ10, dry [21], were determined after curing periods of 7 and 28 days, respectively. Also examined were the effects of pore size, pore size distribution and total porosity on the material properties. The investigations were carried out by means of mercury porosimetry [22] and gas pycnometry [23], with radiological, thermographic and scanning electronic microscopic examinations (XRF/XRD, TG and SEM) in supplementation of the test series. For the purposes of admixture screening, the formulations were calculated according to the concrete volume calculation method.
3 Experiments
A commercially available thin-bed mortar from a well-known manufacturer served as starting material, and the material engineering properties of the zero samples were experimentally determined. In order to reduce the thermal conductivity, the pulverulent admixtures aluminosilicate types I and II, hollow glass spheres, pumicite types I and II, perlite, silica, vermiculite and granulated blast-furnace slag were added to the mortar system in fractions of 10 vol.% each. Photos of the individual admixtures are shown in Figure 1.
Table 1 lists the particle sizes (d50 values), particle densities and specific surface areas (BET) of the employed admixtures. The particle sizes were determined by laser diffraction [24]. All measurements were carried out according to the wet dispersion method and evaluated according to the Fraunhofer method [25]. The particle densities were determined by means of gas pycnometry, and the specific surface areas were measured and evaluated according to the BET method [26].
3.1 Admixture screening via concrete volume calculation
For the purposes of admixture screening, the formulations were determined by the concrete volume calculation method according to equation 1 [27]:
⇥(1)
VT total volume of fresh mortar ⇥[l]
VM volume of dry mortar ⇥[l]
VW volume of water ⇥[l]
VA volume of air (pores) ⇥[%]
VZ volume of admixture x ⇥[l]
VX volume of admixture x + 1 ⇥[l]
mM mass of dry mortar ⇥[g]
mW mass of water ⇥[g]
mZ mass of admixture x ⇥[g]
mX mass of admixture x + 1 ⇥[g]
ρM particle density of dry mortar ⇥[g/cm3]
ρW particle density of water ⇥[g/cm3]
ρZ particle density of admixture x ⇥[g/cm3]
ρX particle density of admixture x + 1 ⇥[g/cm3]
First, a sieve analysis of the fine and coarse fractions of the mortar mix in the mortar bag was necessary [28, 29]. Mesh widths of 63, 90, 125, 250 and 500 µm were used for the analysis, and the maximum grain size of the mortar was 1000 µm.
After screening, the particle density of the respective oversize was determined by helium-gas pycnometry. The volume fractions were determined by weighing the void fractions, and measuring the porosity of the fresh thin-bed mortar [30] enabled preparation of a mortar sample consisting of the exact same individual fractions (Table 2). Table 2 shows the experimentally determined mass ratios for a typical bag of thin-bed mortar. The observed particle densities and mass ratios enable calculation of the volume fractions. The thin-bed mortar in the tested bag contained 20% air voids.
The preparation of mortar samples required that the mass and volume fractions first be converted to a base of 1.00 kg and then referenced either to the target volume in liters [l] or to the individual masses in grams [g] of the fractions. The water quantity derives from the factor 0.58 (water/mortar ratio of the zero samples). In Table 2, the target volume is exemplified for one liter of fresh mortar. Due to the large specific surface area (BET) of the fumed silica, 181.68 m²/g (Table 1), 10 vol.% additional water was required. The water absorption of the silica amounted to 1350 %.
For the mortar mixes modified by way of concrete volume calculation, the coarse fraction, xi ≥ 125 µm, of the base mix was always proportionally substituted and replaced with selected admixtures (Table 1). The fines fraction, however, remained unaltered, because it serves as the mortar’s binder fraction, hence contributing significantly to strength development [31].
4 Findings
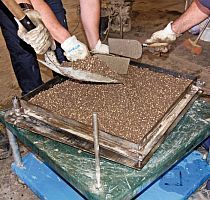
The water/mortar ratio used in the preparation of all thin-bed mortar mixes was adjusted within a single spread ranging between 0.56 and 0.62. The mix containing fumed silica required a higher water/mortar ratio, since this admixture has an extremely high water absorption capacity (1350 %). Compared to the zero sample, all fresh mortars displayed closely comparable working properties. The admixtures to the thin-bed mortar mixtures amounted to 10 vol.% each, and in each case samples were prepared for determining the material engineering properties of each mix. After curing, the specific surface area (BET), the modulus of elasticity and the three-point flexural and compressive strengths were determined after 7 and 28 days, respectively, while the thermal conductivity λ10, dry and the dry bulk density were determined after 28 days (Table 3).
4.1 Specific surface area (BET)
The thoroughly hardened zero samples of thin-bed mortar had a specific surface area (BET) of 17.34 m2/g on average. Each dosed admixture with the exception of fumed silica reduced the specific surface area of the mortar. The addition of 10 vol.% fumed silica increased the specific surface area from 17.34 to 18.02 m2/g.
4.2 Dynamic modulus of elasticity
The moduli of elasticity of the zero samples of thin-bed mortar averaged out to between 5.3 and 4.4 GPa after 7 and 28 days, respectively. The moduli of elasticity generally decreased over the curing period of 7 to 28 days. When type-II expanded aluminosilicate was admixed, the resultant modulus of elasticity was found to be lower than that of the zero sample after 28 days. The highest moduli of elasticity resulted from the admixture of 10 vol.% expanded perlite. After a curing time of seven days, the modulus of elasticity of the zero samples had increased from 5.3 to 7.7 GPa and was found to be 7.5 GPa after 28 days of curing.
4.3 Three-point flexural strength
The flexural strength of the zero samples displayed a mean value of βB = 1.3 MPa after 7 days, followed by 2.5 MPa after 28 days. The highest flexural strength values were achieved by adding expanded perlite, i.e., βB = 1.9 MPa after 7 days and βB = 5.6 MPa after 28 days. At the end of the 28-day curing period, the gain amounted to 195 %. When type-I and –II aluminosilicates were admixed, the 7-day flexural strength values were lower in comparison with that of the zero sample. Conversely, the 28-day levels were higher than that of the zero sample. Compared to the zero sample, admixtures of hollow glass spheres and fumed silica yielded lower flexural strength values, i.e., 2.3 and 2.0 MPa, respectively, after 28 days.
4.4 Compressive strength and thermal conductivity
Figure 3 shows the measured compressive strength βc and thermal conductivity λ10, dry values as functions of the respective admixture. The illustration also recounts the evolution of strength in the mortar mixes after 7 and 28 days.
The zero samples of thin-bed mortar reached an average compressive strength of 8.0 MPa after 7 days and 10.3 MPa after 28 days, and a thermal conductivity of λ10, dry = 0.21 W/(m K) after 28 days. In each case, a 10 vol.% dose of admixture increased the compressive strength of the mortar, the sole exceptions being the addition of hollow glass spheres and type-II expanded aluminosilicate. The admixtures expanded perlite and fumed silica proved to be of particular interest. The addition of expanded perlite improved the 28-day compressive strength from 10.3 to 20.5 MPa, or 99 %. Unfortunately, however, this did not reduce but instead increased the thermal conductivity from λ10, dry = 0.21 to 0.25 W/(m K). Admixing fumed silica definitely succeeded in reducing the thermal conductivity. In that case, the thermal conductivity was lowered from λ10, dry = 0.21 to 0.17 W/(m K), or 19 %. Simultaneously, the compressive strength increased by 15.5 %, from 10.3 to 11.9 MPa.
4.5 Porosity analysis
In order to better explain the findings with regard to changes in compressive strength and thermal conductivity, as shown in Figure 3, the modified mortar mixes were subjected to porosity analysis by means of mercury porosimetry. The tests were conducted on hydrated, hardened mortar after a curing time of 28 days. The results of porosity analysis, along with the particle densities determined with an He-gas pycnometer, are listed in Tables 4.1 and 4.2.
The evaluation range of porosity analysis in Tables 4.1 and 4.2 extends from the upper measuring limit of macroporosity (210 µm) to the mesoporous range between 50 and 2 nm. The tested mortar specimens contained no micropores with diameters below 2 nm. The 4 µm limit marks the transition from low-pressure to high-pressure measuring (Figures 4.1, 4.2, 6.1 and 6.2) [22]. The specific pore volume was prorated among the three pore-size ranges (column 6). The most frequent pore diameter (mode) and the mean pore diameter (median) pertain to the entire range of porosity (210 µm to 20 nm).
The zero sample of thin-bed mortar had a specific total pore volume of 0.70 cm3/g. The pore diameter mode/average was situated at 2.73 / 1.36 µm, and the particle density was 2.08 g/cm3 (Table 4.1). On admixture of type-I expanded aluminosilicate, type-I pumicite, vermiculite and granulated blast furnace slag, the pore volume diminished, hence enhancing the strength of the mortar (Figure 3) beyond that of the zero sample. The addition of hollow glass spheres marginally increased the pore volume. The same effect was observed with regard to compressive strength, which decreased from 10.3 to 9.6 MPa, as compared to the zero sample. Normally, a reduction in specific pore volume produces a gain in compressive strength. With regard to the two characteristic pore diameters (mode and median), both were found to drop below those of the zero sample when the respective admixture was added (Table 4.1).
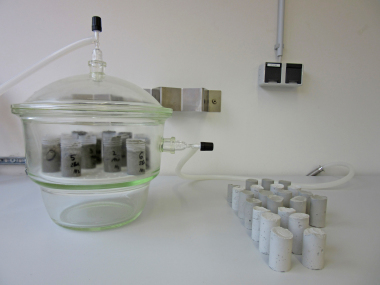
Figures 4.1 and 4.2 also show the cumulative and specific pore volumes and pore diameters in chart form. Figure 5 shows a measuring cell filled with fragmented thin-bed mortar prior to mercury intrusion.
In Table 4.2, it is apparent that the addition of type-II pumicite, expanded perlite and fumed silica reduced the specific pore volumes and porosities (Figure 7). In the case of expanded perlite, the pore volume decreased significantly from 0.70 to 0.51 cm3/g. In turn, the strength increased by 99 %. Unfortunately, this was accompanied by a 19 % increase in thermal conductivity, from λ10, dry = 0.21 to 0.25 W/(m K) (Figure 3).
A 10 vol.% admixture of fumed silica reduced the total pore volume from 0.70 to 0.60 cm3/g, but increased the mesoporosity by 244 % (Table 4.2; column 6; Figures 6.1 and 6.2). The reduction in thermal conductivity of the thin-bed mortar system can therefore be attributed to the gain in mesoporosity. In a comparison of curves of the thin-bed mortar zero samples and of the sample containing 10 vol.% fumed silica, that fact is demonstrated by the steeper rise of the curve for the silica-containing sample, beginning at 50 nm (Figure 6.1). Mercury was seen to increasingly fill the mesopores.
The addition of type-II expanded aluminosilicate further reduced the thermal conductivity from λ10, dry = 0.21 to 0.18 W/(m K). Unlike the silica-containing sample, however, there was no increase in mesoporosity, and the volume of macropores in the range above 4 µm was seen to remain unchanged all the way up to the measuring limit of 210 µm (Table 4.2, column 6).
Also of particular interest is the nearly identical median value of the thin-bed mortar samples containing perlite and silica, where dp = 0.3 µm (Table 4.2). The curves of both modified thin-bed mortar samples show a particularly high peak at that pore diameter, as compared to the zero sample (Figure 6.2).
Figure 7 shows the porosities calculated according to (2) [32] together with the compressive strength of the thin-bed mortar containing different dosages of admixture:
⇥ (2)
Φ porosity⇥[%]
Vq specific total pore volume ⇥ [cm3/g]
ρS particle density ⇥ [g/cm3]
The porosity of the thin-bed mortar zero sample was 59.1 %. The decrease in specific pore volume/porosity yields a gain in compressive strength. On addition of 10 vol.% expanded perlite, the porosity dropped to 49.4 %, hence producing a 99 % gain in strength.
4.6 X-ray diffractometry and X-ray fluorescence analysis
The radiographic determinations performed in connection with this study were carried out on a θ-θ X-ray diffractometer. Prior to each measurement, the samples to be examined were pulverized by hand in a mortar at sample ages ranging between 2 and 28 days. Subsequent sample preparation was performed according to the backloading method.
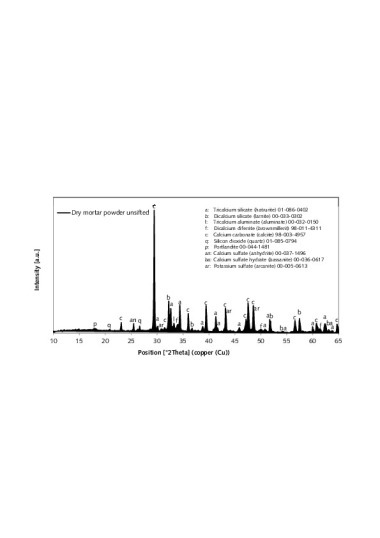
Quantitative element determination was performed by means of wavelength dispersive X-ray fluorescence analysis (XRF). In preparation for determination of loss on ignition (LOI), the samples were heated to 950°C and held there for one hour. The fused tablets consisted of 8 g Li2B4O7 and 1 g of the annealed sample. Figure 8 shows the X-ray images of the thin-bed mortar zero sample and of the mortar samples containing expanded perlite, type-II expanded aluminosilicate and fumed silica at sample ages of 2, 7 and 28 days. The range between 5 and 50 °2θ was considered in each case.
Table 5 shows the results of X-ray fluorescence analysis (XRF) [33] of the unsifted dry mortar powders and the respective sieve residues.
The main clinker phases C3S, C2S, C3A and C2(A,F) were identified in the zero sample of thin-bed mortar as well as in the mortar samples containing perlite, aluminosilicate and fumed silica [34]. In Figure 8, the samples are marked with “a, b, l and f”. The hydration products detected in the samples were portlandite (p), ettringite (e) and semi-carbonate (h). The thin-bed mortar zero sample and all three admixture-modified mortar samples also contained calcite (c) and quartz (q), both of which were already contained in the original mixture (Table 5). The addition of fumed silica, type-II expanded aluminosilicate and/or expanded perlite in the course of cement hydration can be assumed to trigger the reaction known as portlandite degradation between the dissolved calcium hydroxide and the said pozzolanas, resulting in formation of additional hardening compounds (calcium silicate hydrate and calcium aluminate hydrate; equations 3 and 4) [31, 35]:
m Ca(OH)2 + n SiO2 + o H2O
→ x CaO · y SiO2 · z H2O⇥(3)
m Ca(OH)2 + n Al2O3 + o H2O → x CaO · y Al2O3 · z H2O⇥(4)
Considering the X-ray diffractograms of the mortar samples containing admixtures of fumed silica at ages 2, 7 and 28 days (Figure 8), a temporarily increasing degradation of the portlandite is observed at 18.0 and 34.1 °2θ as compared to the thin-bed mortar zero sample. Hence, a pozzolanic reaction can be assumed to have taken place. By way of contrast, only minor reactions or none at all are triggered by the admixtures perlite and type-II aluminosilicate. The portlandite intensities are similar or comparable to those of the zero sample. Therefore it can be concluded that portlandite decomposition involving expanded perlite or type-II aluminosilicate (3) and (4), respectively, also occurs, but, due to the lower level of pozzolanic reactivity, to a lesser degree than in the case of reaction with fumed silica (3). Further examination of the silica-containing samples reveals that, after 2, 7 and 28 days, the main intensities of the clinker phases alite and belite, as well as of aluminate, are less pronounced than those of the thin-mortar zero sample. Therefore it can be deduced that, during the setting process and in the presence of fumed silica, the formation of C-S-H phases is accelerated. Air atmosphere induces stabilization of the ettringite and the associated conversion to semi- and monocarbonate [31, 35]. As seen in Figure 8, only the silica-containing mortar samples display comparatively higher semi-carbonate intensities after 2, 7 and 28 days. In the presence of CO2 and in contact with air (CO2), the portlandite undergoes diffusion-controlled carbonation to form calcite (eq. 5) [31, 35]:
Ca(OH)2 + CO2 → CaCO3 + H2O⇥(5)
In Figure 8, all mortar samples are seen to have increasing or constant calcite intensities during hydration. In the case of samples containing fumed silica, somewhat higher intensities were observed, possibly due to the carbonation of portlandite. The two mortar samples modified by addition of perlite and aluminosilicate showed slightly lower calcite intensifies after 2, 7 and 28 days, as compared to those of a thin-bed mortar zero sample.
4.7 Thermal analysis by thermogravimetry (TG)
For the purpose of quantifying the possible occurrence of portlandite degradation in the modified thin-bed mortar samples from Figure 8, the samples were subjected to thermogravimetric analysis [36, 37] (Figure 9). That table surveys the thermogravimetrically determined reduction in the mass of the thin-bed mortar zero sample in comparison with the corresponding mass losses of mortar samples containing admixtures of expanded perlite, type-II expanded aluminosilicate and fused silica. In the course of a 28-day curing period, various changes in mass and water losses were observed via TG examination (Figure 9, Table 6). In the range between room temperature and 390° C, water is gradually eliminated from the hydrate phases ettringite, tetracalcium aluminate hydrate and calcium silicate hydrate in all mortar samples but to varying degrees [38, 39]. At temperatures beyond 390 °C, the calcium hydroxide sheds its water accordingly (6) [31]. For all mortar samples, that process is completed at 460° C. The silica-containing sample experiences a pronounced loss of water in the temperature range up to 120 °C. That fact can be attributed to the correspondingly high water/mortar ratio of 0.86.
Ca(OH)2 → CaO + H2O⇥(6)
Within the range of temperatures between 390 and 460° C, the thin-bed mortar zero sample loses 3.17 wt.% water, corresponding to a portlandite mass of 13.04 wt.%, or 4.17 mg, after a curing time of 28 days. This calculation was made according to (7) [40]:
⇥(7)
where:
mCH mass Ca(OH)2 [wt. %]
MCH molar mass Ca(OH)2 = 74.093 [g/mol]
MH molar mass H2O = 18.015 [g/mol]
mH mass H2O / loss of mass [wt.%]
nx molar quantity [mole]
TG analysis of the zero sample showed that, following heat treatment at 1000 °C, it had a residual solid fraction of 79.01 % (Table 6, column 4). The loss of weight was mainly attributable to the elimination of water and CO2. Admixing perlite, type-II aluminosilicate and fumed silica produced different residues from heat treatment. The sample containing silica, for example, had the smallest amount of residue, at 74.98 %. In addition, all three employed admixtures cause different extents of portlandite decomposition. The admixture of type-II expanded aluminosilicate reduced the mass of portlandite from 13.04 to 11.89 wt.% in the temperature range between 390 and 460° C (Table 6; column 9). This corresponds to 9 % decomposition in comparison with the zero sample. At 19 %, the admixture of perlite even resulted in 10 % more portlandite degradation than did the type-II aluminosilicate. Finally, the silica-containing sample resulted in the most pronounced degree of portlandite decomposition (55 %).
A corresponding process of decarbonization took place in the 635 - 690° C temperature range (8). The decomposition of CaCO3 was caused by carbonation of the calcium hydroxide with CO2 [41]:
CaCO3 → CaO + CO2⇥(8)
The zero sample lost 0.85 wt.% carbon dioxide, corresponding to a calcium carbonate mass of 1.93 wt.%, or 0.62 mg ([9]; Table 6, column 13 / 14) [40]:
⇥(9)
mCc mass CaCO3 [wt. %]
MCc molar mass CaCO3 = 100.0869 [g/mol]
Mc molar mass CO2 = 44.0100 [g/mol]
mc mass CO2 / loss of mass [wt.%]
The employed admixtures caused varying degrees of carbonation in comparison with the zero sample. The sample containing perlite had a calcium carbonate mass of 0.52 mg, which, after 28 days, was lower than that of the zero sample. In the case of admixture type-II aluminosilicate and fumed silica, the observed calcium carbonate masses of 0.57 and 0.58 mg, respectively, were also lower in the tested samples.
4.8 Scanning electron microscopic (SEM) analysis
The following scanning electronic micrographs of thin-bed mortar mixes containing 10 vol.% fumed silica or 10 vol.% expanded perlite were made at a sample age of 28 days in comparison with the thin-bed mortar zero sample. Special attention was paid to monitoring ettringite and portlandite and identifying C-S-H phases, surface structure and porosity.
Figure 10 through Figure 15 show fracture faces of thin-bed mortar in 50x, 500x and 1000x magnification. Figures 10 to 12 each show the thin-bed mortar surface in 50x magnification. The zero sample exhibits a very porous matrix with voids of different shape and size together with fractured glass spheres included as lightweight aggregate in the original mix (Figure 10). The thin-bed mortar sample containing 10 vol.% silica has a comparatively dense matrix and therefore appears quite compact (Figure 11). Here, too, embedded glass spheres are to be seen. Compared to the zero sample (Figure 10), the fracture face of the sample containing perlite (Figure 12) also displays a denser matrix with smaller pores.
In a 500-fold enlargement of the zero-sample surface (Figure 13) the hydration product calcium hydroxide [Ca(OH)2] can be identified. This compound often appears in the form of tabular portlandite, preferentially inside of the voids in the mortar matrix. In addition, some ettringite growth and C-S-H phases can be seen around the edges of pores and along fracture faces.
No portlandite is to be seen in the 1000-fold magnification of the silica-containing sample (Figure 14), but widely distributed C-S-H phases resulting from pozzolanic reaction of the calcium hydroxide with the fused silica in the zero sample are apparent.
Regarding the perlite-containing sample, portlandite and isolated C-S-H phases were found in the fracture face (Figure 15). This would indicate that the pozzolanic reaction in this case was much weaker than in the silica-containing sample (Figure 14).
5 Summary and discussion
The work presented shows that the thermal properties and strength of thin-bed mortar can be optimized by introduction of appropriate admixtures. By means of concrete volume calculation with selective substitution of coarse mortar fractions ≥ 125 µm with 10 vol.% fused silica, the thermal conductivity of the zero sample was successfully reduced from λ10, dry = 0.21 to 0.17 W/(m K), i.e., by 19 %. At the same time, the mortar’s strength was increased by 15.5 %, from 10.3 to 11.9 MPa. This effect can be traced to the pozzolanic reactivity of the fumed silica. XRD analysis enabled qualitative demonstration of portlandite degradation. The relevant intensities remained below those of the zero sample and decreased in the course of hydration. Thermographic analysis, in turn, enabled quantitative determination of portlandite degradation amounting to 55 % over a curing time of 28 days. The corresponding SEM micrographs confirm the results of XRD and TG analysis, i.e., no portlandite was detected on the face of the silica-containing sample. The reduction in thermal conductivity achieved by admixture of fumed silica is attributable to a 244 % gain in mesoporosity within the pore size range between 50 and 2 nm. It can be generally postulated, that an increase in the volume of finer pores tends to lower the thermal conductivity of the material. Monolithic walls built using appropriately modified thin-bed mortar can therefore be expected to display comparatively superior thermal insulation properties.
The 28-day compressive strength can be increased from 10.3 to 20.5 MPa, or by 99 % compared to that of the zero sample, by adding 10 vol.% expanded perlite. This effect is due to a comparatively low water/mortar ratio of 0.57 in combination with the low porosity 49.4 % of the thin-bed mortar.
Both starting products used displayed a high degree of fineness (d50 value of expanded perlite = 25.65 µm; d50 value of fumed silica = 10.06 µm). Fumed silica is characterized by a high proportion of reactive, amorphous silicon dioxide. Also of particular interest are the nearly identical median values – both approx. 0.3 µm – of the pores found in the thin-mortar samples containing perlite and silica.
The main effect of the admixture type-II aluminosilicate was to reduce the thermal conductivity of the thin-bed mortar from λ10, dry = 0.21 to 0.18 W/(m K). In comparison with the silica-laced thin-bed mortar specimen, no increase in meso-porosity was observed. Instead, the pore volume situated above 4 µm and extending to the upper measuring limit of 210 µm was seen to remain constant.
6 Prospect
Further investigations will focus on ascertaining the effects of combined admixtures composed of fumed silica, expanded perlite and/or type-II expanded aluminosilicate on the thin-bed mortar system. To that end, experiments involving different quantities of admixtures and different water/mortar ratios are planned.
Überschrift Bezahlschranke (EN)
tab ZKG KOMBI EN
This is a trial offer for programming testing only. It does not entitle you to a valid subscription and is intended purely for testing purposes. Please do not follow this process.
This is a trial offer for programming testing only. It does not entitle you to a valid subscription and is intended purely for testing purposes. Please do not follow this process.
tab ZKG KOMBI Study test
This is a trial offer for programming testing only. It does not entitle you to a valid subscription and is intended purely for testing purposes. Please do not follow this process.
This is a trial offer for programming testing only. It does not entitle you to a valid subscription and is intended purely for testing purposes. Please do not follow this process.