Effects of fumed silica on material
engineering parameters of external
rendering, with special emphasis on thermal conductivity and compressive strength


A 5 vol.% addition of fumed silica is seen to reduce the thermal conductivity of a CS IV plinth render by nearly 29 %, from λ10, dry = 0.45 to 0.32 W/(m·K). At the same time, the compressive strength improved by 49 %, from 10.0 to 14.9 MPa. The higher the pore volume ratio, the more successfully the thermal conductivity can be reduced. The gain in compressive strength can be attributed to portlandite decomposition, i.e., to the pozzolanic reaction between the calcium hydroxide and the fumed silica.
1 Introduction and objectives
The main prerequisite for energy-efficient operation of residential and non-residential buildings is that they are appropriately insulated against heat loss. While modern, highly insulative wall building materials can always be used for new buildings, the walls of existing structures require a subsequent energy efficiency upgrade. The thermal resistance of the walls can be improved by installing (additional) interior or exterior thermal insulation and/or by applying plaster and render with superior thermal insulation properties. Highly insulative render contains a...
1 Introduction and objectives
The main prerequisite for energy-efficient operation of residential and non-residential buildings is that they are appropriately insulated against heat loss. While modern, highly insulative wall building materials can always be used for new buildings, the walls of existing structures require a subsequent energy efficiency upgrade. The thermal resistance of the walls can be improved by installing (additional) interior or exterior thermal insulation and/or by applying plaster and render with superior thermal insulation properties. Highly insulative render contains a large share of lightweight components such as expanded polystyrene (EPS) that reduce thermal conductivity but also impair the render’s compressive strength. This effect is attributable to the low particle density of the lightweight components, which exerts a direct influence on the compressive strength of the render. Often, the material in question is insulation grade render belonging to compressive strength class CS I, with βD = 0.5 MPa and thermal conductivities of the order of λ10, dry = 0.07 W/(m·K) at 28 days [1-6]. The objective of the work presented here was to research and develop a new type of render (plinth render) characterized by reduced thermal conductivity and unaltered or improved compressive strength.
2 State of the art
Current research by Schmidt et al. (2018) demonstrates that the use of special additives makes it possible to optimize the thermal properties of thin-bed mortar. The admixture of fumed silica, for example, was seen to reduce the thermal conductivity of mortar from λ10, dry = 0.21 to 0.15 W/(m·K), or nearly 29 %. The thin-bed mortar thus modified satisfied the requirements of compressive strength class M 10, displaying βD = 10.0 MPa after a setting time of 28 days. This effect was attributed to micro-porosification with fumed silica in conjunction with simultaneous decomposition of portlandite together with formation of compressive strength-enhancing C-S-H phases. The present work is intended to investigate whether the same effect can be achieved not only for thin-bed mortar but for rendering mortar as well [7-9].
3 Experiments
The employed starting material (zero sample) was a commercially available cementitious plinth/wet-room render from a well-known producer for both interior and exterior application as undercoat or finishing render. According to the producer data, this render has a thermal conductivity of λ10, dry = 0.45 W/(m·K) and a compressive strength amounting to βD ≥ 6.0 MPa and belongs to mortar group P III. The first step was to determine the material engineering parameters of zero samples made of this rendering material with a water-mortar ratio of 0.18 [10]. The render was then sifted into appropriate fractions, and the coarse-screen fractions ≥ 125 µm proportionally substituted with the powdered additive “fumed silica”. The formulations were calculated according to the material space method [7, 8]. For producing the mixture series with fumed silica, it was necessary to vary the water-mortar ratio appropriately, always ensuring good workability of the fresh rendering mortar. After 7 and 28 days in storage, the rendering mortar samples thus prepared were tested to determine their material engineering parameters, including dynamic modulus of elasticity, three-point bending tensile and compressive strength, dry bulk density and thermal conductivity, λ10, dry. The pore sizes, pore size distribution, total porosity and particle density were also investigated. Finally, both chemical and mineralogical analyses were performed.
4 Preliminary examination of the rendering mortar
zero sample and fumed silica
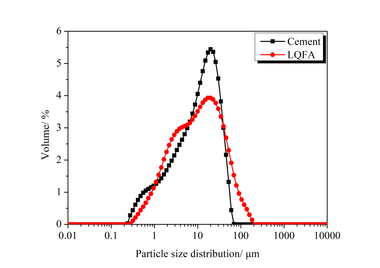
First, the unsifted, powdered rendering mortar and the fumed silica were analyzed in terms of the parameters particle size (d50 value), particle density, BET surface area (Table 1), chemical and mineralogical composition (XRF/XRD) and pore sizes (Tables 1 to 3 and Figures 1 to 4).
The unsifted rendering mortar powder displayed a d50 = 36.56 µm, a particle density of ρF = 2.77 g/cm3 and a specific surface area (BET) of aS = 1.68 m2/g. The d50 value of the fumed silica, at 10.06 µm, was much lower, and the BET surface area, at 181.68 m2/g, was comparatively large. Both values can be indicative of elevated reactivity on the part of the fumed silica. Chemical analysis of the unsifted, powdered rendering mortar showed it to contain 53.39 wt.% CaO and 8.20 wt.% SiO2 plus small amounts of Al2O3 and MgO. The conspicuously high annealing loss of 33.08 wt.%, together with the high CaO content, can be attributed to a large proportion of powdered limestone in the original mixture (Figure 1, calcium carbonate, c). Practically all (~ 100 wt.%) of the admixed fumed silica, consisted of amorphous silicon dioxide (Table 2). XRD analysis of the unsifted, powdered rendering mortar identified typical Portland cement clinker phases (C3S, C2S, C3A, C2(A,F)) (Figure 1) [11]. Those phases are marked accordingly with “a, b, l and f”. Some calcite (c) and quartz (q) were also detected. The sulfate carriers in the unsifted, powdered rendering mortar were determined as anhydrite (an), bassanite (ba) and arcanite (ar). Due to the rapid reaction of free CaO in the cement fraction of the rendering mortar with humidity, it displayed a low concentration of portlandite (p).
X-ray analysis of the fumed silica (Figure 2) showed it to consist of the SiO2 modifications tridymite and α-quartz [12]. The XRD diagram illustrates a significant elevation of the substrate in the range between 15 and 35 °2J (X-ray amorphous fraction).
The evaluation range of pore analysis via mercury porosimetry (Table 3) extends from the upper measuring limit to the macropores (205 µm) to the range of mesopores between 50 and 2 nm. Neither the unsifted rendering mortar nor the fumed silica displayed any microporosity with diameters below 2 nm. The specific pore volume was proportionally converted to three pore-size ranges (Table 3, column 3). The most common pore diameter (modal value) and the mean pore diameter (median value) refer to the entire porosity range (205 µm to 20 nm). Figures 4 and 5 show the cumulative and specific pore volumes as functions of pore diameter.
Investigations showed the unsifted, powdered rendering mortar to have a total specific pore volume of 0.22 cm3/g (Table 3). The fumed silica had a comparatively high total specific pore volume of 14.70 cm3/g and displayed conspicuous pore diameter of dP = 25 nm in the mesopore region, along with a high proportion of pores with diameters exceeding 4 µm and extending up to the upper measuring limit of 205 µm (Figure 4). This relatively broad distribution of pore diameters is plausible, considering the differences in size of the silica agglomerates.
5 Preparation of modified rendering mortar sam-
ples by the concrete volume calculation method
The modified rendering mortar formulations were calculated according to the concrete volume calculation method, in the process of which the coarse fraction of the basic mixture with a grain size of xi ≥ 125 µm was always substituted proportionally with fumed silica [7, 8]. The fines fraction, however, remained unaltered, since it constitutes the binder fraction of the mortar and therefore contributes significantly to strength evolution [13]. The water-mortar ratio of the rendering mortar zero sample began at 0.18 (producer data) and was gradually increased with each rise in fumed silica content, ending at 0.73. This was necessitated by the fact that, due to the large BET surface area of the fumed silica (181.68 m²/g), additional water was needed for mixing the mortar. The water-mortar ratios of the rendering mortar mixtures were adapted appropriately, and the mixtures then laced with 5 vol.% fumed silica, hence enabling preparation of mortar samples for use in determining the material-technological parameters.
6 Findings
The rendering mortar samples were left to harden for 7 and 28 days, followed by experimental determination of their material parameters, i.e., dynamic modulus of elasticity, three-point flexural strength and compressive strength. The BET surface areas, thermal conductivity λ10, dry and dry bulk density were determined after 28 days. Table 4 compares those findings with the corresponding mean values of the rendering mortar zero samples.
6.1 Specific surface area (BET)
The thoroughly hardened zero sample of rendering mortar displayed a specific surface area (BET) of 8.97 m2/g on average. The addition of 5 vol.% fumed silica invariably caused the BET surface area to increase, no matter what the water-mortar ratio. The maximum BET, occurring for a water-mortar ratio of 0.33, amounted to 21.44 m2/g. The BET registered for a water-mortar ratio of 0.53 came to 20.58 m2/g. Further increases in the water-mortar ratio to 0.63 and 0.73, respectively, caused the BET surface areas to drop off but still remain higher than those of the zero sample.
6.2 Dynamic modulus of elasticity
The dynamic modulus of elasticity of the rendering mortar zero sample amounted to 8.8 and 8.1 GPa on average after 7 and 28 days, respectively. On addition of 5 vol.% fumed silica coupled with increasing water-mortar ratios, the elastic modulus values dropped off in comparison with those of the zero sample after 7 and 28 days - with the exception of the two mixtures with water-mortar ratios of 0.33 and 0.36. In those two cases, the elastic modulus determined after 7 and 28 days, respectively, was higher than that of the zero sample.
6.3 Three-point flexural strength
At 7 days, the rendering mortar zero samples displayed an average three-point flexural strength value of βB = 2.2 MPa, rising to βB = 2.5 MPa at 28 days. The addition of 5 vol.% fumed silica, attended by increasing water-mortar ratios, led to steadily decreasing flexural strength levels after both 7 and 28 days.
6.4 Compressive strength, thermal conductivity and dry bulk density
After setting times of 7 and 28 days, the rendering mortar zero sample displayed a mean compressive strength of 6.6 and 10.0 MPa, respectively, and, at 28 days, thermal conductivity amounting to λ10, dry = 0.45 W/(m·K), hence meeting the manufacturer’s specifications. At a water-mortar ratio of 0.33, the addition of 5 vol.% fumed silica yielded a 49 % gain in compressive strength, to 14.9 MPa, at 28 days, while the thermal conductivity dropped off by 28.8 %, to λ10, dry = 0.32 W/(m·K) (Table 4). In the case of the rendering mortar mixture containing 5 vol.% fumed silica at a water-mortar ratio of 0.43, it was also possible to achieve the specified compressive strength class CS IV with βD = 6.0 MPa while reducing the thermal conductivity by 33.3 %, to λ10, dry= 0.30 W/(m·K). Figure 5 is a graphic depiction of the correlating compressive strength values after 7 and 28 days together with the coefficients of thermal conductivity, λ10, dry, after 28 days as functions of the water-mortar ratio. On average, the rendering mortar zero sample displayed a dry bulk density of ρR = 1.45 g/cm3. With increasing water-mortar ratio, the dry bulk density gradually decreased to ρR = 0.91 g/cm3.
6.5 Porosity analysis
In order to better understand the findings with regard to changes in compressive strength and thermal conductivity, as shown in Figure 5, the modified rendering mortar mixtures were subjected to porosity analysis by means of mercury porosimetry, gas adsorption and gas pycnometry. The tests were conducted on hardened rendering mortar after a curing time of 28 days (Table 5). The cumulative and specific pore volumes of the hardened rendering mortar samples are shown in Figures 6 and 7 as functions of pore diameter. The rendering mortar zero sample displayed a specific overall pore volume of 0.23 cm3/g. Thus, the most common/mean pore diameter amounted to 0.32/1.44 µm, and the particle density came to 2.64 g/cm3 (Table 5). The porosity analysis revealed that the solitary inclusion of 5 vol.% fumed silica at a water-mortar ratio of 0.33 induced no change in pore volume. The most common/mean pore diameter in the mortar sample amounted to 0.04/0.06 µm. In comparison with the zero sample of the mesopore fraction extending from 50 to 2 nm, it was higher by 377 %. That resulted in a lowering of the thermal conductivity from λ10, dry = 0.45 to 0.32 W/(m·K), or 28.8 %. As the porosity analysis shows, the rendering mortar samples fortified with 5 vol.% fumed silica had comparatively finer capillary porosity in the mesopore range between 5 µm and 10 nm, in addition to relatively few air voids in the range between 1 mm and 5 µm (Figures 6 and 7). Calculating the ratio of mesopore volume to macropore volume within the pore size range from 1000 to 100 nm in accordance with equation 1 points to a clear correlation between the pore-volume ratio and the thermal conductivity of the rendering mortar specimens (Figure 7, Table 5):
⇥ (1)
A pore volume ratio of 0.27 was calculated for the rendering mortar zero sample (Table 5, column 8). In the case of the successful rendering mortar mixture containing 5 vol.% fumed silica at a water-mortar ratio 0.33, the pore volume ratio was significantly higher (1.62). An increasing pore volume ratio and, hence, increasing mesopore volume reduced the thermal conductivity of the rendering mortar. At the same time, the compressive strength was preserved or even enhanced. Table 5 shows the porosity and correlating compressive strength of the modified rendering mortar, as calculated according to equation 2 [14], in comparison with the zero sample:
(2)
Φ : porosity [%]
Vq: total specific pore volume [cm3/g]
ρS : particle density [g/cm3]
The cured rendering mortar zero sample had a porosity of 38.3 %, a thermal conductivity coefficient of 0.45 W/(m·K) and compressive strength amounting to 10.0 MPa. The rendering mortar sample containing 5 vol.% fumed silica displayed somewhat lower porosity (37.1 %), reduced thermal conductivity (0.32 W/(m·K)) and, at 14.9 MPa, elevated compressive strength (Table 5).
Since the finer mesopore range between 75 and 5 nm was inaccessible for porosity analysis via mercury intrusion, the nitrogen-based BET gas adsorption method was used.
The rendering mortar zero sample with a water-mortar ratio of 0.18 had a specific pore volume of 0.038 cm3/g in the mesopore range between 50 and 20 nm. Adding 5 vol.% fumed silica to a mixture with a water-mortar ratio of 0.33 increased the pore volume to 0.089 cm3/g (Figure 8). The results of BET gas adsorption analysis corroborate the results of mercury porosimetry.
6.6 X-ray analysis (XRD)
In the further course of experimentation, X-ray analyses of the rendering mortar zero sample and of the rendering mortar sample containing 5 vol.% fumed silica were performed after setting periods of 2, 7 and 28 days, each time following hydration in a laboratory atmosphere (Figure 9). The main clinker phases customarily found in cement were detected in both the rendering mortar zero sample and the modified rendering mortar sample (marked with “a” and “b”). Portlandite (p) was detected as a hydration product in both samples. The rendering mortar zero sample and the modified rendering mortar sample both contained calcite (c) and quartz (q) [7, 8]. Comparative X-ray analysis showed the modified rendering mortar sample to display a significant reduction in portlandite intensities after setting periods of 2, 7 and 28 days (Figure 9, right). It therefore can be assumed that, during cement hydration, the pyrogenic, reactive silica reacted with the calcium hydroxide to form additional calcium silicate hydrates with the capacity to enhance compressive strength [13]. This reaction is referred to as portlandite decomposition.
In addition to portlandite decomposition involving formation of additional C-S-H phases, the CO2 content of the air engenders a competing, diffusion-controlled, parallel reaction that turns portlandite into calcite [13].
The calcite intensity in the rendering mortar zero sample was found to have increased markedly after a setting time of 7 days. It then remained constant through 28 days, but at a higher level than that of the rendering mortar sample that had been hydrated for only two days (Figure 9). The rendering mortar sample modified with 5 vol.% fumed silica displayed comparatively somewhat lower calcite intensities. This leads to the conclusion that, in the presence of fumed silica, and with the formation of C-S-H phases, portlandite decomposition is favored.
6.7 Thermogravimetric analysis (TG/DTG)
In order to quantify the suspected decomposition of portlandite, a thermogravimetric approach was taken. To that end, a rendering mortar mass of 32.0 mg each of zero sample and modified rendering mortar sample were weighed into the sample carrier of the thermal balance and heat treated at a maximum temperature of 1000 °C. Following heat treatment, the residual mass of the rendering mortar zero sample was 64.62 wt.%, while the residual mass of the modified rendering mortar sample amounted to 68.00 wt.%. (Table 6, column 4). Figure 10 depicts the mass losses and the differential thermogravimetric (DTG) results established for the reference samples. According to equation 3, comparative quantitative determination of the progressive changes in the mass of the rendering mortar samples within the temperature ranges between 390 and 450 °C (zone 1) was performed. Within that range, the portlandite content of the rendering mortar samples was dehydrated [13].
Between 390 and 450 °C (zone 1), the portlandite fraction of the rendering mortar zero sample loses 0.84 wt.% water, corresponding to a contained portlandite mass of 3.45 wt.%, or 1.11 mg (3) [15]. The modified rendering mortar sample containing 5 vol.% fumed silica lost 0.15 wt.%, corresponding to a portlandite mass of 0.62 wt.%, or 0.20 mg. Comparison of those two dehydration scenarios within the zone-1 temperature range verifies that the addition of fumed silica triggers significant portlandite decomposition (82 %) compared with the zero sample (Table 6, column 9/10).
⇥(3)
where:
mCH: mass of Ca(OH)2 [wt.%]
MCH: molar mass of Ca(OH)2 = 74.093 [g/mol]
MH: molar mass of H2O = 18.015 [g/mol]
mH: mass of H2O/loss of mass [wt.%]
nx: amount of substance [mol]
Between 650 and 810 °C (zone 2) is where decarbonation begins for the subject rendering mortar samples [16]. The rendering mortar zero sample experiences a 27.75 wt.% loss of carbon dioxide, corresponding to a calcium carbonate mass of 62.99 wt.%, or 20.16 mg (equation 4, Table 6, column 13/14) [13, 15].
⇥(4)
mCc: mass of CaCO3 [wt.%]
MCc: molar mass of CaCO3 = 100.0869 [g/mol]
Mc: molar mass of CO2 = 44.0100 [g/mol]
mc: mass of CO2/loss of mass [wt.%]
This study shows that the modified rendering mortar sample experiences a loss of 24.66 wt.% carbon dioxide, corresponding to a contained calcium carbonate mass of 55.98 wt.%, or 17.91 mg. In comparison with the rendering mortar zero sample, a 5 vol.% addition of fumed silica produces an 11 % reduction in the carbonate content of the rendering mortar. The unspent calcium hydroxide therefore remains available for reaction with fumed silica to form C-S-H phases. This comparatively elevated C-S-H phase formation is responsible for the 49 % gain in compressive strength.
6.8 Scanning electron microscopy (SEM)
SEM investigations were performed to confirm the process of portlandite decomposition and additional formation of C-S-H phases. Figures 11 and 12 show SEM micrographs of fracture faces of modified rendering mortar samples containing 5 vol.% fumed silica in 1000-x and 5000-x magnification. No portlandite is to be seen on the fracture faces. Instead, additional C-S-H phases appeared together with ettringite needles measuring as much as 5 µm in length, to form a thick “lawn”.
7 Summary
The work presented demonstrates that the substitution of coarse fractions ≥ 125 µm of the subject rendering mortar with fumed silica promotes thermal optimization and enhances the compressive strength of the material. Consequently, the thermal conductivity of the zero sample decreased from λ10, dry = 0.45 to 0.32 W/(m·K), or 28.8 %. This reduction in thermal conductivity can be attributed to a 377 % gain in pore volume in the mesopore range between 50 and 2 nm. At the same time, the observed compressive strength values increased from βD = 10.0 to 14.9 MPa, or 49 %. A pore size distribution ranging from 1000 to 100 nm, in combination with pore sizes < 50 nm had the effect of optimizing the thermal behavior of the rendering mortar with no undue loss of compressive strength. Calculation of the pore volume ratios between mesopore volumes below 50 nm and macropore volumes in the 1000/100 nm range yielded a clear correlation; the higher the pore volume ratio, the more successfully the thermal conductivity is reduced, while the compressive strength remains constant or even increases. X-ray analysis (XRD) made it possible to attribute the gain in compressive strength to the process of “portlandite decomposition” known from the literature. This results in a pozzolanic reaction between the portlandite (calcium hydroxide) and the fumed silica, attended by the formation of additional C-S-H phases, hence improving the material’s compressive strength.
Thermogravimetric investigations have shown that the presence of fumed silica in the rendering mortar induces portlandite decomposition to the amount of 82 %. Throughout the hydration time, the rendering mortar samples underwent continuous carbonation via CO2 diffusion. Adding 5 vol.% fumed silica retarded carbonate formation by 11 %.
8 Prospect
Wall-building materials fortified with a correspondingly modified mortar (rendering/thin-bed mortar) can be expected to display improved thermal insulation properties. In order to substantiate this effect, two wall test specimens made of highly insulative brick, modified external rendering and modified thin-bed mortar were constructed. In the first case, conventional thin-bed mortar with thermal conductivity amounting to λ10, dry = 0.21 W/(m·K) was used in combination with external rendering offering a thermal conductivity coefficient of λ10, dry = 0.45 W/(m·K). In the second case, a newly developed thin-bed mortar with λ10, dry = 0.15 W/(m·K) was used in combination with the newly developed plinth render with λ10, dry = 0.32 W/(m·K).
Überschrift Bezahlschranke (EN)
tab ZKG KOMBI EN
This is a trial offer for programming testing only. It does not entitle you to a valid subscription and is intended purely for testing purposes. Please do not follow this process.
This is a trial offer for programming testing only. It does not entitle you to a valid subscription and is intended purely for testing purposes. Please do not follow this process.
tab ZKG KOMBI Study test
This is a trial offer for programming testing only. It does not entitle you to a valid subscription and is intended purely for testing purposes. Please do not follow this process.
This is a trial offer for programming testing only. It does not entitle you to a valid subscription and is intended purely for testing purposes. Please do not follow this process.