Coal combustion mechanisms and fuel NOx formation characteristics in a precalciner environment


As NOx emissions become more and more severe it is important to find a method of low nitrogen combustion for coal in the precalciners in the cement industry. The operating temperature and the grade of coal have a great influence on NOx formation. The rules governing NOx formation during the combustion of two bituminous coals and two anthracite coals at 700-1000° C were therefore investigated in a double furnace reactor. The suggestions for controlling NOx emissions in a precalciner are that, to ensure efficient decomposition of the raw material, a fuel with a high volatiles content and a high fixed carbon content should be chosen and the coal should be injected into the precalciner in a zone with a temperature not exceeding 900° C.
1 Introduction
Nitrogen oxides constitute one of the main air pollutants and the NOx emission regulations for the cement industry are becoming more and more stringent. Precalciners are used in the cement industry as the main equipment for NOx reduction. In the precalciner the fuel NOx accounts for 80 % of the total NOx from coal combustion, which is the main objective in the target for NOx reduction [1-2]. Fuel NOx is formed from the oxidation of the nitrogen combined in the fuel (600-800° C) when burning nitrogenous fuel [3-6]. To develop efficient NOx reduction measures it is important to...
1 Introduction
Nitrogen oxides constitute one of the main air pollutants and the NOx emission regulations for the cement industry are becoming more and more stringent. Precalciners are used in the cement industry as the main equipment for NOx reduction. In the precalciner the fuel NOx accounts for 80 % of the total NOx from coal combustion, which is the main objective in the target for NOx reduction [1-2]. Fuel NOx is formed from the oxidation of the nitrogen combined in the fuel (600-800° C) when burning nitrogenous fuel [3-6]. To develop efficient NOx reduction measures it is important to obtain a full understanding of the fuel NOx formation process in the precalciner.
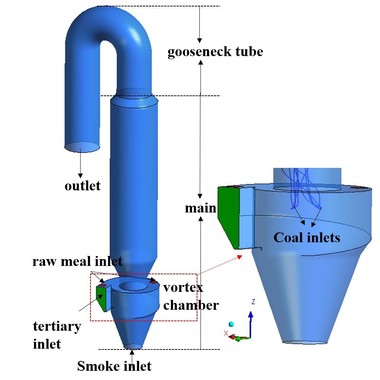
The NOx formation characteristics during coal combustion have been studied extensively [7-9]. Some researchers have shown that the NOx emission concentration increases with increasing temperature during the combustion of bituminous coal [10-12]. However, the experimental conditions in those studies were quite different from those in a precalciner. The characteristics of the conditions in a precalciner are special and are mainly associated with two aspects. Firstly, the precalciner is a large-scale reactor, which includes the exothermic reaction of coal combustion and the endothermic CaCO3 reaction, resulting in the differing distribution of temperatures. The average temperature in a precalciner is about 880° C [13-14]. Secondly, there are two types of gas flow in a precalciner. One is the tertiary air, in which the O2 concentration is 21 %, and the other is the flue gas from the rotary kiln, in which the O2 concentration lies between 2 % to 4 %, resulting in different O2 concentrations in different zones of the precalciner. The average O2 concentration in the main combustion area is about 18 %. It is necessary to study the combustion process and NOx formation characteristics on the basis of the atmosphere in the precalciner. This paper therefore studied the fuel NOx formation characteristics for coal combustion at 700° C, 800° C, 900° C and 1000° C and an O2 concentration of 18 %.
The type of fuel also has an influence on the NOx emissions. Masayuki investigated the combustion of bituminous coal (1147° C - 1727° C) and the results showed that the influence of the temperature was different for hv bituminous coal and sub-bituminous coal. For hv bituminous coal the combustion efficiency improved when the burning temperature in the fuel-rich region rose, and the NOx emission decreased as the combustion efficiency improved. However, for the sub-bituminous coal the NOx emission increased when the temperature exceeded 1527° C [15]. Christopher investigated the NOx formation characteristics during combustion of anthracite and bituminous coal and found that the anthracite with a low fuel N has high NOx emissions. Zhou found that the NOx concentration was high during low-hv coal combustion [16-17]. Thomas et al. found that the NOx emissions increased with increasing coalification [18-21].
The temperature and the coal grade are therefore very important factors in pulverized coal combustion. It is necessary to investigate the NOx emissions during the combustion of different coals at the temperature and O2 concentration prevailing in the precalciner. Previous researchers mainly investigated the coal combustion process in a drop-tube furnace and by thermal gravimetric analysis [22-24]. The drop-tube furnace experiment can model the gas-solid reactions in the precalciner but, because of the interaction between many factors, it is difficult to deduce the exact mechanism of fuel N migration from the drop-tube furnace experiment. Thermal gravimetric analysis can reflect the dynamic characteristics during coal combustion but cannot heat the fuel rapidly. The horizontal fixed-bed reactor can model the temperature and O2 concentration in a precalciner and reflect the rules governing gas release both qualitatively and quantitatively. Some researchers have carried out studies based on the horizontal fixed-bed reactor [16-17]. They focused mainly on the NOx emissions and ignored the interactions between different gas components. Most of the previous studies did not combine the CO2 and CO formation process with NOx formation during coal combustion. Their experimental conditions also differed greatly from the conditions in a precalciner.
This study used a double furnaces reactor to investigate the combustion characteristics of two bituminous coals and two anthracite coals at 700° C, 800° C, 900° C and 1000° C with an O2 concentration of 18 %. The effects of temperature and fuel type on the NOx formation were investigated. The gas components were obtained in the coal pyrolysis process by combining TG-FTIR and PY-GC/MS. The interactions of CO, CO2 and NOx were analyzed. The results provide a theoretical reference point for the combustion of coal in a precalciner and for effective reduction of the emissions of NOx.
2 Experimental section
2.1 Thermal characterization
The proximate and ultimate analyses and calorific values are shown in Table 1. The proximate analysis was conducted in accordance with the Standard Practice for the Proximate Analysis of Coal (GB/T 212-2008). Carbon (C), oxygen (O), hydrogen (H), nitrogen (N) and sulfur (S) are the main chemical elements in a fuel. The C, H, O, N and S contents of the samples were therefore determined by ultimate analysis using the Vatio EL cube HNSO analyzer. The calorific values of the samples were determined in accordance with the Standard Practice for the Calorific Value of Coal (GB/T 213-2008). Each sample was tested at least three times and the average value was taken. All the results were reported on an air-dry basis.
2.2 Coal combustion in a double furnace reactor
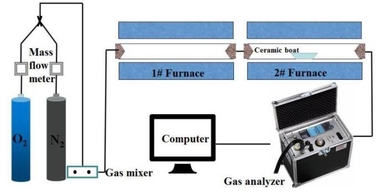
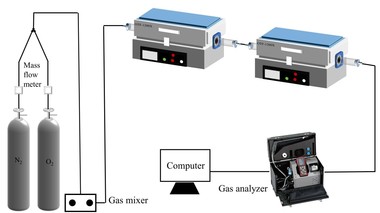
The coal combustion experimental system as shown in Figure 1 includes the gas system, tube furnace and flue gas analyzer. The tube furnace was an OTF-1200X using a quartz tube as the heating element. The adjustable temperature ranged from room temperature to 1200° C. The temperature was electrically controlled and automatically displayed by a device. N2 and O2 mixtures controlled by mass flow meters were used for the combustion gases and the O2 concentration was set at 18 %. The mixed gas was preheated in No. 1 furnace and then flowed into No. 2 furnace, which was able to maintain a stable high temperature during combustion. In each experiment the fuel sample was placed in a ceramic boat and pushed rapidly into the quartz tube that had already been preheated to the desired temperature. The fuel sample for each run weighed about 500 mg and the gas flow rate was maintained at 1000 ml/min. The concentrations of the combustion flue gases, O2, CO2, CO and NOX were monitored continuously online by an MGA5 flue gas analyzer. This unit measured the concentrations of O2 and CO2 with an Infrared (IR) cell as volume percentages. The concentrations of the other gases were measured electrochemically in ppm. The sampling time interval was 1 s. The CO, CO2 and NOx gases yields can be calculated by integration of the gas release curves, which then yields the corresponding fuel N conversion. The calculation process is as follows:
⇥(1)
⇥ ⇥(2)
mj CO, CO2, or NOx yield [mg]
ci CO, CO2, or NOx concentration [ppm]
v volumetric flow 1000 [ml/min]
Mj molar mass of CO, CO2, or NOx
t sampling time interval 1 [s]
n number of measuring points
j CO, CO2, or NOx
XNO fuel N conversion [%]
mo mass of the fuel sample 500 [mg]
Nad N content in the fuel sample [wt%]
Cad C content in the fuel sample [wt%]
2.3 Pyrolysis characteristics
(TG-FTIR and PY-GC/MS) of the samples
The pyrolysis experiments were performed using thermogravimetric analysis coupled with a Fourier infrared spectrometer (TG-FTIR, American Discovery TG and Nicolet 6700 Fourier transform infrared spectrometry) and pyrolysis-gas chromatography/mass synchrometer (PY-GC/MS, 6890N) analysis. TG analysis, coupled with FTIR, is an effective way of not only studying the mass-loss characteristics and kinetic parameters of the thermal decomposition process but also of identifying the volatile components generated in real-time. The pyrolysis analysis was performed using FTIR. The samples were heated from 25° C to 1000° C using a constant heating rate of 20 °K/min in an N2 atmosphere. The HI-resolution sensitivity was 1.0 and the HI-resolution Ramp was 20 K/min to 1000° C, Res 6.0. The spectral region of the FTIR was 4 cm-1 and 4000 to 400 cm-1, and the spectrum scan was conducted at 8 second intervals. The PY-GC/MS results supplemented the gas components. The carrier gas was helium at a flow rate of 1.0 m l/min, the injection volume was 1 μl and the refractive ratio of distillation was 100:1. The MS conditions were as follows: electron impact ion source, transmission line temperature was 280° C, ion source temperature was 230° C, quadrupole temperature was 150° C and the mass scan range was 30- 600 m/z.
3 Results and discussion
3.1 Coal combustion process
Figure 2a and Figure 3a show that at 800 °C both CO and CO2 were released rapidly in the initial combustion stage (t < 200 s). They formed CO release peaks (t = 45 s, t = 82 s) and CO2 release peaks (t = 102 s). This stage covered the homogeneous combustion of volatile matter. From 200 s to 800 s the CO and CO2 release curves were steady; the release rate then decreased gradually (t > 800 s) indicating the heterogeneous combustion of char. The CO and CO2 release curves show that the combustion process of bituminous coal at 800 °C could be divided into two main stages: the devolatilization stage, during which part of the volatiles burned rapidly and formed CO while the rest of the volatiles burned with direct formation of CO2; during the char combustion the char burned steadily and formed a small amount of CO and a large amount of CO2.
Figure 2a shows that the increase in furnace temperature resulted in a decrease of both the CO release yield and the time to reach its peak. Little CO was generated from the combustion at 900° C and 1000° C. Much more CO was formed at 800° C and there were two CO peaks; the peak values were 3,327 ppm and 2,684 ppm, respectively, and the CO peak width was about 155 s. A large amount of CO was formed at 700 ° and there were also two CO peaks; the first was at t = 194 s (14,339 ppm) and the second was at t = 775 s (8,251 ppm). According to Figure 3a the CO2 was released rapidly and formed sharp peaks at 800° C, 900° C and 1000° C, while there were no CO2 peaks during combustion of the volatiles at 700° C. It is difficult to distinguish between the two combustion stages at 700° C, indicating that this involved a combination of combustion of volatiles and char while volatile ignition combustion occurred at 1000° C, 900° C and 800° C.
Figure 2a shows that very little CO was generated from volatile combustion during the char combustion stage at 90° C and 1000° C. Only a little CO was formed during the char combustion stage at 800° C and the CO concentration remained at about 240 ppm for a long time and then fell to zero. A large amount of CO was generated during the entire combustion process at 700° C. Figure 3a shows that at 800° C and 900° C the CO2 release rate decreased gradually during the char combustion stage. At 700° C most of the fuel-C existed in the form of CO, so there was less CO2. At 1000° C the combustion rate was rapid, resulting in a high local temperature, which could probably reach the ash fusion point and part of the char would not be completely burnt. This means that the CO2 yield was lower at 700° C and 1000° C.
From Table 1, Figure 2 and Figure 3 it was established that No. 1 bituminous coal and No. 2 bituminous coal had identical combustion characteristics at the same temperature. The burn-out time for No. 1 bituminous coal was longer because it contained more fixed carbon.
Figure 4 and Figure 5 show the CO and CO2 emission curves over time for combustion of No. 1 anthracite and No. 2 anthracite coal respectively at different temperatures. According to Figure 2a and Figure 4a the volatiles were released rapidly and CO peaks were formed. As shown in Figure 4a and Figure 5a, the anthracite combustion process also included two stages, namely the devolatilization stage and char combustion stage. There were no obvious CO2 peaks during the combustion of volatiles in anthracite because the anthracite contained less volatiles than bituminous coal. In general, No. 1 anthracite and No. 2 anthracite showed identical combustion characteristics at a given temperature but the burn-out time for No. 1 anthracite was longer because it contained more fixed carbon. The exception was at 700° C when the burn-out time for No. 2 anthracite was longer. This was because the high ash content in No. 2 anthracite inhibited the coal combustion at low temperatures.
Figure 6 shows the CO and CO2 yields at different temperatures by integration of gas release curves. According to Figure 6a the temperature has a very significant effect on the CO yield; an increase in furnace temperature resulted in a decrease in CO release yield. At the same temperature, anthracite combustion released more CO than bituminous coal combustion. The lower the temperature the larger was the difference in the amount of CO yield between the two types of coals. According to Figure 6b the CO2 yield increased with increasing temperature from 700 to 900 °C, while from 900 to 1000° C the CO2 yield decreased with temperature. This was because the pulverized coal burned incompletely at 1000° C.
In general, the combustion characteristics of the different coals were as follows:
(1) At high temperatures (800° C, 900° C and 1000° C) the homogeneous combustion of volatiles and the heterogeneous combustion of char were relatively independent while at 700° C it was hard to distinguish clearly between the two stages and mixed combustion occurred.
(2) The combustion of both bituminous coal and anthracite remains incomplete at 1000° C.
(3) With bituminous coal combustion the CO and CO2 concentrations increased rapidly and reached a peak in the devolatilization stage. However, there was only a weak CO release peak and no CO2 release peak during the entire anthracite combustion.
3.2 Fuel NOx formation
Figure 7 and Figure 8 show NOx emission curves over time during the combustion of different coals at different temperatures. The NOx formation curves during combustion of No. 1 bituminous coal at 800° C are shown in Figure 7a. There were two NOx peaks during bituminous coal combustion. When combined with the former combustion process it was found that the two peaks coincided with the two stages of pulverized coal combustion, resulting in the formation of volatile NOx and char NOx. The release peak of volatile NOx was sharper, and the release peak of char NOx was relatively steady and wider. The volatile NOx yield was the highest at 900° C because the combustion rate was rapid, which promoted NOx formation. At 800° C the volatile NOx yield was less than that at 900° C because the pulverized coal combustion released CO, which inhibited NOx formation. The volatile NOx peak formed late (t = 144 s) at 700° C because the combustion reaction was slow. The char NOx yield increased with increasing temperature from 700 to 900° C because a large amount of CO formed during the char combustion stage at low temperatures, which can reduce the NOx. The CO yield decreased with rising temperature. However, the pulverized coal burned incompletely at 1000 °C and the amounts of both the volatile NOx and the char NOx were the lowest. From Figure 7a and Figure 7b it was established that the NOx formation characteristics were the same for the two types of bituminous coal.
By comparing Figure 7a and Figure 8 it was determined that volatiles NOx and char NOx were generated during anthracite combustion. Anthracite contained less volatiles (as shown in Table 1) so there was less volatiles NOx and char NOx was the main pollutant during anthracite combustion. The char NOx yield also increased with increasing temperature.
The NOx emission yield and fuel N conversion to NOx during the combustion of different coals at different temperatures can be obtained by formula 1 and formula 2 as shown in Figure 9a and Figure 9b. In general, the NOx yield and fuel N conversion was lowest at 700° C. This was because the combustion rate was slow at the low temperature, resulting in a reducing atmosphere and providing longer time for the NOx reduction reaction. The NOx yield reached a maximum at 900° C. The fuel N conversion was high at 1000° C even though the coal could not burn effectively, t. At the same temperature the fuel N conversion was higher for anthracite combustion than for bituminous coal. The two bituminous coals have approximately the same volatiles content and fuel N content, but No. 2 bituminous coal contained less fixed carbon and had a higher fuel N conversion. The two anthracite coals also had approximately the same volatiles content, but No. 2 anthracite contained less fixed carbon and had a higher fuel N conversion. The lower the fixed carbon content the higher was the fuel N conversion. This was because more CO was formed during the combustion of coals with a high fixed content as shown in Figure 6a. There was also more char CO and less volatiles CO during anthracite combustion so the NOx could not be reduced in the given time, which would eventually lead to high fuel N conversion.
Some suggestions are listed below for fuel NOx reduction in a precalciner. Firstly, the attempt should be made to lower the temperature of the tertiary air and position the coal inlets in a low temperature zone (< 900 °C). Secondly, coals with a high volatiles content should be selected as the fuel, and the coal inlets should be positioned in the high CO zone for coals with low volatiles and high fixed carbon. Thirdly, the O2 concentration should be lowered at the start of the coal combustion to create a reducing environment and form more CO, which can reduce the fuel NOx emissions.
3.3 The rules governing coal pyrolysis and fuel NOx formation
The above experiments revealed that the pulverized coal combustion took place in two stages and that the ignition and combustion mechanisms as well as the fuel NOx emission characteristics were different at different temperatures. The gas release characteristics during coal pyrolysis were analyzed using TG-FTIR and PY-GC/MS analysis to obtain further information about the pulverized combustion process and NOx formation characteristics at different temperatures. The TG and DTG (derivative thermogravimetry) curves of No. 1 bituminous coal and No. 1 anthracite are shown in Figure 10. The corresponding FTIR spectra are shown in Figure 11. The gas components during pyrolysis at different temperatures are listed in Table 2 and Table 3.
Figure 10 shows that there were three stages during the pyrolysis of different coals. Firstly, there was moisture evaporation, then the release of volatiles, and finally the release of macromolecular materials. At each stage, the anthracite pyrolysis temperature was higher than the bituminous coal pyrolysis temperature, which showed that the fuel-C and fuel-N existed in more stable forms with increasing coalification.
Several peaks can be observed in the DTG curve of No. 1 bituminous coal In Figure 10a. These include a large water evaporation peak (69.94° C) and peaks indicating the release of pyrolysis materials (478° C, 747° C). There is a pyrolysis material release peak at 747° C, which indicates that the bituminous coal combustion consisted of mixed ignition and combustion of volatiles and char (Figure 2 and Figure 3). Several peaks were observed in the DTG curve of No. 1 anthracite in Figure 10b. These include a large water evaporation peak (78.5° C) , a large pyrolysis material release peak (537.6° C), and two small pyrolysis material release peaks (690° C, 802° C). Comparison of Figure 10a and Figure 10b shows some differences between bituminous coal and anthracite during pyrolysis. Firstly, the release of the bituminous coal volatiles began at a relatively lower temperature and most of the volatiles were released below 700° C. Secondly, the anthracite contained a smaller amount of volatiles. Some of the volatiles were released below 700° C while the rest were released gradually with increasing temperature. The release time for volatiles for anthracite was therefore longer, which was in agreement with the pulverized coal combustion process (Figure 2, Figure 3, Figure 4, Figure 5).
The main peaks at 670 cm-1, 2342 cm-1, 2358 cm-1 in Figure 11 were the characteristic bands of CO2. The characteristic bands of H2O were observed from 3500 cm-1 to 4000 cm-1, and the H2O peaks of anthracite were more obvious than that for bituminous coal, which is in accordance with the TG curves. The vibration peaks of C-H bonds and C=O bonds were detected at 1200 - 2000 cm-1. The hydrocarbons peaks became weaker with increasing temperature. This shows that the hydrocarbons emission yield decreased with temperature, which was in accordance with the results of the PY-GC/MS. According to Table 2 and Table 3, coal pyrolysis may release alkanes, aldehydes, ketones, phenols, ethers, organic acids, monocyclic aromatics, etc. at 700° C and 800° C. At 900° C and 1000° C the gas components during pyrolysis were mainly benzene, methylbenzene and some other aromatic hydrocarbons. The peaks at 2101 cm-1, and 2178 cm-1 were characteristic peaks of CO. The CO characteristic peaks of bituminous coal were more obvious than those of anthracite and the hydrocarbon peaks (1200 to 2000 cm-1) were not obvious for bituminous coal.
In conclusion, the coal pyrolysis at low temperature could release many types of unstable hydrocarbons which could reduce the NOx. Anthracite contained less volatiles and released fewer hydrocarbons, so the NOx reducing atmosphere was weaker during anthracite combustion. The results of the pyrolysis experiment were consistent with the combustion results.
4 Conclusions
The combustion processes and NOx formation characteristics of two bituminous coals and two anthracite coals were studied at 700° C, 800° C, 900° C and 1000° C with an O2 concentration of 18 % to simulate the temperature conditions in a precalciner using a self-developed horizontal fixed-bed reactor.
(1) At high temperatures there was a devolatilization stage and char combustion during coal combustion. The coal combustion rate was slow at 700° C while at 1000° C, the metal oxides in the ash coated some of the char, resulting in incomplete combustion. Both the bituminous coal and the anthracite burnt efficiently at 800° C and 900° C. There were obvious CO and CO2 release peaks during combustion of the bituminous coal and the burn-out time was short, which meant that it was better suited to the precalciner than anthracite.
(2) The fuel NOx formation process was consistent with the coal combustion process and involved two stages, including volatile NOx and char NOx. The fuel NOx yield was much lower when there was a large amount of volatile CO.
(3) Fuel N conversion increased with temperature. The NOx yield reached a maximum at 900° C during the combustion of different coals. The fuel N conversion was higher for anthracite at high temperature. The fuel N conversion of bituminous coal was less affected by the temperature.
(4) For bituminous coal and anthracite containing equivalent levels of fuel N the fuel N conversion and NOx yield was higher during anthracite combustion. Bituminous coal with a high fixed carbon content had a higher fuel N conversion and higher NOx yield.
(5) Assuming complete combustion of pulverized coal (except at 1000 °C) some suggestions for controlling the NOx emissions in the precalciner are to lower the temperature of the tertiary air, position the coal inlets in a low temperature zone (< 900° C) in the low O2 concentration zone and select coals containing a high level of volatiles and fixed carbon as the fuels.
Acknowledgements
The National Natural Science Foundation of China supported this work financially under grant 51502221.
Überschrift Bezahlschranke (EN)
tab ZKG KOMBI EN
This is a trial offer for programming testing only. It does not entitle you to a valid subscription and is intended purely for testing purposes. Please do not follow this process.
This is a trial offer for programming testing only. It does not entitle you to a valid subscription and is intended purely for testing purposes. Please do not follow this process.
tab ZKG KOMBI Study test
This is a trial offer for programming testing only. It does not entitle you to a valid subscription and is intended purely for testing purposes. Please do not follow this process.
This is a trial offer for programming testing only. It does not entitle you to a valid subscription and is intended purely for testing purposes. Please do not follow this process.