Numerical simulation of NOx reduction using low-oxygen combustion and optimization in a TTF precalciner


This paper describes the use of low-oxygen combustion technology to reduce NOx emissions in cement production. Numerical simulation was also employed to simulate the pulverized coal combustion, calcium carbonate decomposition and NOx reduction process in the precalciner of a 5000 t/d clinker cement production line. The simulation gave a temperature at the precalciner outlet of 1260 K, a CO2 mass fraction of 28%, an O2 concentration of 1.2% and an NOx concentration of 523 ppm. The data were in good agreement with the actual measurements. The low-oxygen combustion technology was also optimized by changing the oxygen content in the kiln exhaust gas in order to achieve the best conditions. The results showed that the NOx concentration at the outlet of the precalciner would be lowest (468 ppm) when the oxygen content in the kiln exhaust gas was 3%.
1 Introduction
The cement industry is the third largest source of nitrogen oxides after the power industry and motor vehicles, and China‘s cement production accounts for 65% of global cement production. The problem of the resultant pollutant emissions is also a concern for society. The greatest possible reduction of NOx emissions while at the same time ensuring the economic benefits of cement plants has therefore become a major issue. Many scholars at home and abroad have carried out a great deal of research into this problem. Zhao [1] studied the influence of different amounts and locations...
1 Introduction
The cement industry is the third largest source of nitrogen oxides after the power industry and motor vehicles, and China‘s cement production accounts for 65% of global cement production. The problem of the resultant pollutant emissions is also a concern for society. The greatest possible reduction of NOx emissions while at the same time ensuring the economic benefits of cement plants has therefore become a major issue. Many scholars at home and abroad have carried out a great deal of research into this problem. Zhao [1] studied the influence of different amounts and locations of ammonia injection on NOx emissions in a TTF precalciner; Zhang [2] made a series of studies on reducing NOx emission by staged combustion in the precalciner and discussed the effects of different proportions of air and coal on NOx emissions; Sen Li [3] reduced NOx emissions by advanced reburning and SNCR [4] technology in the precalciner and achieved NOx reduction rates of 85%-90%. This paper studies the adoption of low-oxygen combustion technology to reduce NOx emission and investigates the effect of the oxygen content in the kiln exhaust gas on the efficiency of denitrification.
2 Model and numerical solution
2.1 Geometric model
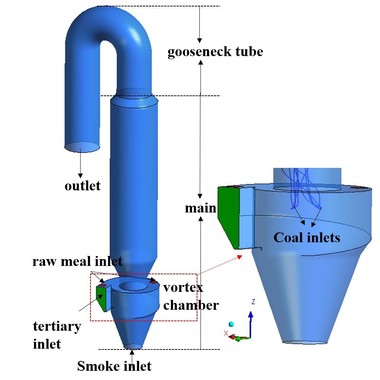
Figure 1 shows the structure and configuration of the precalciner. It can be seen from Figure 1a that the external structure can be divided into two sections: cylinder and cone. There are three types of inlet: the gas inlets (comprising the kiln exhaust gas and the tertiary air), the coal inlets and the raw meal inlets. The exhaust gas from the kiln enters the precalciner vertically from below. The tertiary air enters the precalciner horizontally from the bottom of the precalciner column. The four raw material pipes are divided between the two sections of the precalciner - two of the pipes are located in the cone section above the coal injection pipe and the other two are located above the tertiary air duct. This makes logical use of the heat generated by the combustion of the coal and avoids the formation of local high temperatures which would cause a build-up of coating in the precalciner. The precalciner has two ports that form a triple jet effect. This prolongs the residence time of the solids and gas and is beneficial for the combustion of pulverized coal and decomposition of calcium carbonate [5-7].
2.2 Mathematical model
In a Eulerian system the fluid-phase continuity and momentum equations are solved using the standard k-ε model [8]. The discrete phase model is used to calculate the trajectory of the particle phase [10]. Radiation is expressed with the P1 radiation model. The reaction process in the precalciner is complex and involves the linking of many component substances, so the finite rate/eddy dissipation model was used in the calculation of the reaction rates of Arrhenius and eddy dissipation. The net reaction rate is taken to be the smaller value of the two calculated results. The eddy dissipation reaction rate is expressed as follows:
⇥
⇥(1)
where Ri,r is the reaction rate of the substance i in reaction r. Yp is the mass fraction of the product component. YR is the mass fraction of the reactant components. A and B are two empirical constants and are equal to approximately 4.0 and 5.0 respectively.
The combustion of pulverized coal is divided into two stages. The first stage is the combustion of the volatiles, which is expressed with a single-rate model. The second stage is coke combustion, which is expressed with the kinetics/diffusion-limited model. This paper deals with low-oxygen combustion, so the reaction is divided into two steps in the pulverized coal combustion process:
volatiles + 1.619O2 → 0.825CO + 3.14H2O + 0.075N2⇥(2)
2CO + O2 → 2CO2⇥(3)
where the composition of the volatiles is obtained from industrial analysis of pulverized coal.
The reaction path for the formation of fuel-NOx [9-10] is shown in Figure 2. This assumes that all the char N in pulverized coal is converted to NO and all the volatiles N is converted to HCN.
The reduction of NOx by CO was achieved by using a species transport model. J.M. Levy’s research into low-NOx precalciners proved that CO in a precalciner is effective for reducing NO. The reaction is expressed as follows [11-13]:
NO + CO → 0.5N2 + CO2⇥(4)
2.3 Boundary conditions
The inlet boundary conditions for the tertiary air and the incoming exhaust gas were the inlet velocities, and the inlet velocities of the tertiary air and exhaust gas were 22 m/s and 27.13 m/s respectively. The outlet boundary condition was the outlet pressure. The pulverized coal inlets and the raw material inlets form the mass flow boundaries. The values are shown in Table 1. The mass flows at each pulverized coal inlet and raw meal inlet are almost equal. In this paper the raw meal was assumed to be calcium carbonate for convenience of calculation. The industrial analysis and elemental analysis of pulverized coal are given in Table 2 and the main components of the raw meal are listed in Table 3.
3 Results and discussion
3.1 Flow field in a precalciner
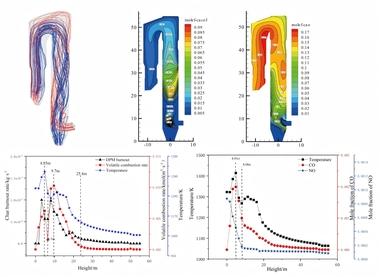
The flow field distribution and airflow diagram in a precalciner are shown in Figure 3. It can be seen from the diagram that during the vertical upward movement of the high-speed exhaust gas from the end of the kiln, part of the gas flow and the tertiary air converge at the centre of the precalciner and continue to move upward. The rest of the gas flow deviates from the original trajectory due to the influence of the raw meal and the tertiary air. This produces two recirculating flows in the cone section of the precalciner. There are many recirculating streams within the precalciner owing to its favourable structural design. This prolongs the residence time of the pulverized coal and raw material in the precalciner, with the result that the pulverized coal can be fully burnt and the raw material can be decomposed more rapidly. It also ensures better heat transfer between the gas and solids.
3.2 Pulverized coal combustion linked with
calcium carbonate decomposition in a precalciner
Figure 4a shows the trajectories of the particles in the pulverized coal streams. It can be seen from the diagram that the pulverized coal is injected radially into the precalciner and converges towards the centre below the main gas flow. When the particles meet the high-speed tertiary air, which also enters the precalciner radially, the pulverized coal particles rise spirally together with the gas flow, thereby prolonging the residence time of the pulverized coal particles. This assists the combustion of the pulverized coal. Figure 4b shows a chart of the concentration of the volatiles, which are mainly distributed near the inlets for the pulverized coal and tertiary air. The temperature rises rapidly when the pulverized coal enters the precalciner and the volatiles are released. However, the oxygen content in the cone of the precalciner is low, which leads to incomplete combustion of the pulverized coal. The volatiles can therefore only rise towards the tertiary air with the gas flow and violent combustion then occurs in combination with oxygen.
Figure 5 shows the temperature contours at the x=0 and z=0 cross-sections through the precalciner. This shows that the maximum temperature in the precalciner is 1710 K, that the high temperature zone is located near the tertiary air and that the high temperature zone appears in the same area as the volatiles in Figure 4b. It proves that the combustion of pulverized coal in this area produces a great deal of heat, while the temperature distribution in the central column and outlet of the precalciner is relatively uniform at 1260 K.
Figure 6 shows the mass fraction distributions of each component in the precalciner. Figure 6a indicates that the oxygen comes mainly from the tertiary air so the concentration of oxygen tends to be the highest near the tertiary air and then exhibits a decreasing trend. The oxygen concentration in the upper part of the precalciner tends to be stable with a mass fraction of 0.012. Figure 6b is the mass fraction distribution diagram for CO2. It can be seen that the CO2 concentration exhibits a sharp increase in the vicinity of the four coal injection pipes, reaching 0.31, and the mass fraction at the exit is 0.28. Figures 6c and 6d are the mass fraction distribution diagrams for CaCO3 and CaO, which indicate that the CaCO3 decomposes rapidly. The rate of decomposition also increases rapidly due to the absorption of large quantities of heat. During this process the decomposition of CaCO3 produces a large amount of CO2. This leads to a rise in the CO2 partial pressure in the precalciner and inhibits the decomposition of CaCO3, resulting in a decrease in the rate of decomposition. Figure 6e is the mass fraction diagram for CO and indicates that a large amount of CO is generated in the cone of the precalciner. The local high temperature produced by coal combustion results in the reaction of char and CO2 to produce CO. The concentration of CO is therefore highest in the area of pulverized coal combustion. The CO then continues to burn in the upward gas flow until it is completely burnt out.
An approximation of the linked processes of pulverized coal combustion and raw meal decomposition in the precalciner can be gained by combining Figure 5 and Figure 6. The pulverized coal enters the bottom of the precalciner where some of the CO is produced by incomplete combustion of the pulverized coal due to the low local oxygen concentration. As the gas flow moves upwards the pulverized coal then begins to burn violently near the tertiary air with a high oxygen concentration. This produces CO2 and CO and also generates high local temperatures. In the high temperature environment the raw meal absorbs the heat generated by pulverized coal combustion and reacts violently. A large amount of the CaCO3 is then decomposed into CaO and, at the same time, a low temperature zone is generated in the area where the CaCO3 is decomposed (see Figure 5). However, the continuous combustion of pulverized coal means that the temperature gradually rises again until it is stabilized.
3.3 Generation and reduction of NOx
in the precalciner
Figure 7 shows the NOx concentration contours in the precalciner. This paper only considers fuel NOx, and assumes that the NOx concentration passing from the end of the kiln into the precalciner is 1000 ppm. The pulverized coal burns in the low oxygen environment in the cone of the precalciner. This produces a large amount of CO (see Figure 6e) and reduces the NOx in the exhaust gas, resulting in a sharp reduction of the NOx concentration in the cone of precalciner to about 300 ppm. The combustion of pulverized coal near the tertiary air produces some of the fuel NOx, which increases the concentration of NOx in this area to 450 ppm. However, the production of fuel-type NOx is inhibited with the increasing uniformity of temperature in the precalciner and the decrease in O2 concentration. The average concentration of NOx in the precalciner column therefore increases but the concentration gradient decreases until the concentration of NOx at the outlet stabilizes at an average value of 523 ppm.
3.4 Validation of the model
Table 4 shows a comparison of the simulated and measured values at the precalciner outlet. It can be seen that the simulated values are very close to the measured values. This proves that the mathematical model and numerical solutions in this paper are reliable and can be applied to practical projects.
4 Effect on NOx emissions of different levels
of oxygen in the exhaust gas
The oxygen content in the exhaust gas from the end of the kiln is set at 1%, 2%, 3%, 4% and 5% as five representative working conditions. Figure 8
shows the NOx concentration (ppm) curves for each section over the height of the precalciner under the five working conditions, in which each section is 2 m apart. It can be seen in Figure 8 that the concentration of NOx decreases dramatically due to the reducing atmosphere produced by the combustion of pulverized coal in the low-oxygen environment at a height of 0~2m. This reduces the NOx in the exhaust gas from the end of the kiln. The combustion of pulverized coal at a height of 2-6 m produces a large amount of fuel NOx, resulting in a slight increase in the concentration of NOx. The concentration of NOx at heights from 6 to 8 m is reduced by the addition of tertiary air and the reduction of the char. Above a precalciner height of 8 m there was continuous combustion of the pulverized coal and the concentration of NOx increased further until at 30 m there was no longer any change in the concentration. By this time the concentrations of NOx at the outlet of the precalciner were 523, 524, 468, 507 and 536 ppm respectively. The trend of NOx concentration change in Figure 8 is basically the same under the five working conditions. However, the concentration of NOx at the outlet from the precalciner was lowest (468 ppm) when the oxygen content in the exhaust gas from the end of the kiln was 3% and the concentration of NOx was lower than for all the other four working conditions.
Figure 9 shows the NOx concentration contours in the vertical section of the precalciner under the five working conditions. It can be seen that when the oxygen concentration in the exhaust gas from the end of the kiln is 3% the NOx concentration near the wall of the precalciner cone is lower than for the other four working conditions, and the distribution of NOx in the upper column of the precalciner is the most uniform. It is worth noting that the NOx concentration under the third working condition is also the lowest of the five working conditions in the area of pulverized coal combustion. The combination of Figures 8 and 9 shows that when the oxygen content in the exhaust gas from the end of the kiln is 3% the low-oxygen combustion of pulverized coal not only produces the maximum reducing atmosphere in the cone but also inhibits the formation of fuel NOx, which greatly reduces the NOx concentration at the outlet of the precalciner.
5 Conclusion
(1) Multiple recirculation occurs in the precalciner when the exhaust gas moving vertically upwards from the end of the kiln meets the tertiary air. This produces a more uniform distribution of the material in the precalciner and assists the decomposition of the raw materials.
(2) The pulverized coal is injected radially into the cone of the precalciner and rises spirally under the influence of the main gas flow. A strong reducing atmosphere is generated when there is incomplete combustion of the pulverized coal in the cone with a low oxygen content. The pulverized coal then burns violently near the tertiary air with a high oxygen content, forming a high temperature zone where the CaCO3 decomposes rapidly.
(3) Low-oxygen combustion technology is used in the precalciner. This produces a strong reducing atmosphere in the precalciner cone and reduces the concentration of NOx at the outlet of the precalciner by reducing the NOx from the exhaust gas from the end of the kiln. The simulations show that the concentration of NOx at the precalciner outlet is 523 ppm and the reduction efficiency of NOx in the kiln exhaust gas is 47.7%, which is a remarkable result.
(4) When the levels of oxygen in the kiln exhaust gas are 1%, 2%, 3%, 4% and 5% the NOx concentrations at the outlet of the precalciner are 523, 524, 468, 507 and 536 ppm respectively while the other conditions remain unchanged. In practical projects the oxygen content in the kiln exhaust gas should therefore be controlled to about 3%, which contributes to the most significant denitrification effect.
Überschrift Bezahlschranke (EN)
tab ZKG KOMBI EN
This is a trial offer for programming testing only. It does not entitle you to a valid subscription and is intended purely for testing purposes. Please do not follow this process.
This is a trial offer for programming testing only. It does not entitle you to a valid subscription and is intended purely for testing purposes. Please do not follow this process.
tab ZKG KOMBI Study test
This is a trial offer for programming testing only. It does not entitle you to a valid subscription and is intended purely for testing purposes. Please do not follow this process.
This is a trial offer for programming testing only. It does not entitle you to a valid subscription and is intended purely for testing purposes. Please do not follow this process.