Formation characteristics of self-generated nitrogen oxides in a cement precalciner


The study of the generation characteristics of self-generated NOx in a cement precalciner is very important for controlling NOx emissions. The characteristics of three types of self-generated nitrogen oxides in a precalciner were studied by numerical simulation, based on a precalciner with a daily output of 5000 t/d. The order of magnitude of thermal NOx generated in a precalciner environment is 10-7~10-6 mg/m3, of prompt NOx is 10-3 mg/m3 and of fuel NOx is 102 mg/m3. The concentrations of the first two are much lower than fuel NOx, so the self-generated NOx in a precalciner is mainly fuel NOx. The concentration of fuel NOx reaches its highest value of 366 mg/m3 near Z = 14.29 m and its concentration then remains between 355 and 366 mg/m3.
1 Introduction
NOx is one of the main components of air pollution, and coal combustion is the main source of nitrogen oxides. Countries and local governments have formulated more and more stringent restrictions on NOx emissions in order to control the increasingly serious NOx pollution [1-3]. Investigations and research have shown that China’s cement output of 2.377 billion t in 2020 resulted in NOx emissions of about 1.603 million t. The cement industry is still one of the main sources of NOx and, if not properly handled, will become the main source of pollution. This will affect the...
1 Introduction
NOx is one of the main components of air pollution, and coal combustion is the main source of nitrogen oxides. Countries and local governments have formulated more and more stringent restrictions on NOx emissions in order to control the increasingly serious NOx pollution [1-3]. Investigations and research have shown that China’s cement output of 2.377 billion t in 2020 resulted in NOx emissions of about 1.603 million t. The cement industry is still one of the main sources of NOx and, if not properly handled, will become the main source of pollution. This will affect the surrounding ecological environment and restrict the sustainable development of the cement industry [4-5]. It is therefore necessary to study the formation and transformation of NOx in the combustion process taking place in cement kilns.
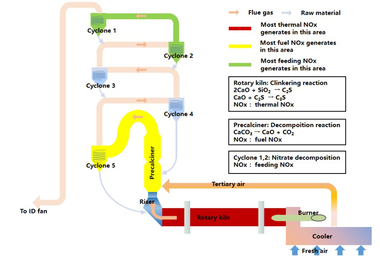
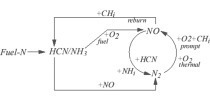
In the new dry-process cement production lines about 70% of the fuel is burned in the precalciner, so it is necessary to study the self-generated NOx from fuel combustion in a precalciner [6-7]. The NOx generated during the coal combustion process can be divided into three principal types, namely thermal NOx, prompt NOx and fuel NOx. Thermal NOx is formed by the impact of oxygen atoms on nitrogen in the air when the temperature is higher than 1800 K. Prompt NOx is caused by the collision of hydrocarbon ions, such as the CH, CH2 and CH3 generated by combustion of hydrocarbon fuel under the condition of an excess air coefficient < 1, with nitrogen molecules in the air to form N, CN and other intermediates containing nitrogen. These intermediates react with active groups containing oxygen, such as O, O2 and OH, and are further oxidized to prompt NOx. Fuel NOx refers to the NOx generated by a series of oxidation-reduction reactions of nitrogen in fuel during combustion [8-10]. Based on the above-mentioned basic model research this paper studies the generation characteristics of self-generated NOx (including thermal NOx, prompt NOx and fuel NOx) during coal combustion in a cement precalciner.
2 Numerical simulation – objectives and methods
2.1 Experimental materials
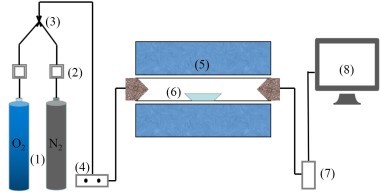
The coal used in the paper was obtained from a cement company in the Hubei province of China. Table 1 showed the industrial analysis, elemental analysis and calorific value of the bituminous coal used in the experiment. Industrial analysis of coal was carried out in accordance with the national standard (GB/T212-2008). The levels of C, H, O, N, and S were obtained using a German VatioelClub elemental analyzer. The calorific value was measured three times by oxygen bomb calorimeter and the average value was taken as the final value.
2.2 Geometrical model and mathematical model
2.2.1 Geometrical model
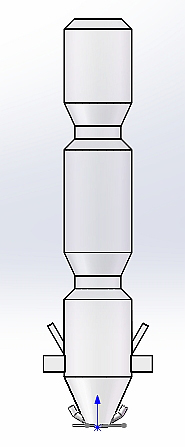
Figure 1 shows the structure of the precalciner. The bottom of the precalciner forms the inlet for the flue gas from the rotary kiln. The tertiary air inlet is located on the side and the tertiary air enters the combustion tangentially from the vortex chamber. The tertiary air inlet is located in the lower part of the combustion section, which assists the combined action with the flue gas from below to enhance the mixing effect of the materials. The precalciner is equipped with a vortex chamber, which effectively prolongs the residence time of the airflow. The structure of the gooseneck at the top causes an ejector effect in the air flow and materials as they pass through the gooseneck, which is conducive to full combustion of the fuel and full decomposition of the raw meal. Two streams of pulverized coal flow into the combustion section from the top of the vortex chamber. Figure 1b is a calibrated grid diagram in which a refined tetrahedral grid was used for the vortex chamber while a high-quality hexahedral grid was used for the remainder.
2.2.2 Mathematical model
With the exception of the flue-gas inlet, the tertiary air inlet and the top outlet the other parts were regarded as walls and standard wall functions were used to simulate these parts. In the Euler coordinate system the gas phase was expressed by the Realizable k-epsilon two equation model. In the Lagrange coordinate system the solid phase was expressed by the discrete phase model (DPM). The chemical reaction was expressed by the species transport model.
2.2.3 Boundary conditions
All the parameters were given for an in-line 5000 t/d precalciner with vortex chamber. The height was approximately 50 m and diameter was 3.7 m. The flue gas had an inlet velocity of 17 m/s and a temperature of 1473 K. The inlet velocity of the tertiary air was 25 m/s and the temperature was 1300 K. The outlet was a pressure outlet. The near wall was treated with a standard wall function and the temperature was 1040 K.
2.2.4 Method of solution
The phase-coupled Simple method was used for pressure-velocity coupling of the Eulerian model. A first-order upwind scheme was used for the other equations. The equations were solved by the face-face iterative TDMA method. The convergence criterion for energy was lower than 10-6 and the other residuals were lower than 10-3.
3 Results and discussion
3.1 Model verification
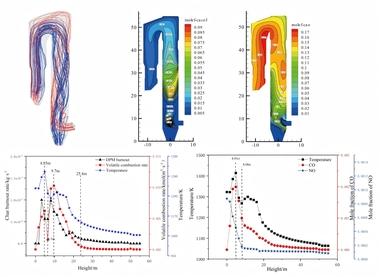
An MGA5 flue gas analyzer was used to measure the component concentration at the outlet of the precalciner and the gas velocity at the outlet was measured by Pitot tube. The calibration position is shown in Figure 1b. Figure 2 shows the velocity and temperature distribution at plane Y=0 when the combustion and decomposition were coupled in the numerical simulation. Table 2 shows the measured values of O2, CO2, CO, NOx, temperature and velocity at the gooseneck in the actual production line production process.
From Figure 2 and Table 2 the measured average temperature at the outlet of the gooseneck tube was 1168 K and the numerical simulation value was 1100 K, which shows good agreement between the two. From the actual calibration the gas velocity near the wall of the gooseneck tube was 25 m/s, the velocity near the centre was 30 m/s, and the average velocity for the section was 29 m/s, while the simulated gas velocity near the wall of the gooseneck tube was 23 m/s, the velocity near the centre was 27 m/s, and the average velocity for the section was 26 m/s. This again shows that the simulation results are in good agreement with the practical results. Through post-processing technology it was found that the concentrations of O2, CO2, CO and NOx at the gooseneck tube during simulation were 1.15%, 31.64%, 15 mg/m3 and 658 mg/m3 respectively, which are very close to the actual calibration values of 1.21%, 34%, 17 mg/m3 and 670 mg/m3 in Table 2. At the same time, the simulated burn-out rate for the pulverized coal and the decomposition rate for CaCO3 were 99.99% and 91.17% respectively, while the measured burn-out rate and the decomposition rate for raw material were 100% and 90% respectively, which is another indication of the effectiveness of the numerical simulation of combustion and decomposition.
3.2 Simulation study of NOx generation in a
cement calciner
3.2.1 Thermal NOx
Figures 3a and 3b show the distribution curves of temperature and thermal NOx along the length of the main body of the precalciner and the gooseneck respectively.
It can be seen from Figure 3a that, due to the endothermic reaction of raw material decomposition under the conditions in the precalciner, the overall temperature in the precalciner was lower than 1800 K and the amount of thermal NOx generated was very small. At the moment when the pulverized coal begins to burn the raw material has not been sufficiently preheated to produce decomposition but it still produces a high instantaneous temperature. A very small amount of thermal NOx is generated at this time and a thermal NOx peak is formed at Z=-6.2 m. Thermal NOx also begins to generate rapidly in the upper section at Z=-0.44 m with increasing temperature and has a maximum concentration at Z=6.4 m of about 3.6×10⁻⁶ mg/m3. The thermal NOx concentration gradually decreases in the tubular gooseneck section (Figure 3b) with the flow towards the outlet and then remains at a stable concentration of 3.65×10⁻⁶ mg/m3.
Further analysis was carried out on the relationship between nitrogen concentration, oxygen concentration and the generation of thermal NOx in the precalciner. Figure 4 shows the concentration distribution curves of nitrogen, oxygen and thermal NOx in the main section of the precalciner. The high temperature flue gas from the rotary kiln, in which the concentration of nitrogen was about 70.5%, enters at the bottom of the precalciner. As the airflow moves upward the concentration of nitrogen decreases gradually and reaches its lowest value at Z=-0.44 m. After that the concentration of nitrogen increases significantly due to the high concentration of nitrogen (79%) in the tertiary air that mixes in with the flue gas from below. The concentration reaches its maximum value at the height of Z=6.4 m and tends to become stable. The oxygen in the precalciner comes mainly from the tertiary air entering the side of the vortex chamber, so the oxygen concentration is highest at a height of Z=-3.07 m, while the concentration on either side is low. Based on the combined concentrations of nitrogen, oxygen and thermal NOx, the concentrations of oxygen and nitrogen are fairly high between -10<Z<-0.44 m, corresponding to the region of rapid generation of thermal NOx. Although the oxygen concentration gradually decreases between -0.44<Z<6.4 m the nitrogen concentration still increases, once again corresponding to the rapid generation of thermal NOx, which reaches its maximum and tends to be stable at the height of Z=6.4 m.
Based on the oxygen concentration, nitrogen concentration and temperature in the precalciner, a small amount of thermal NOx would be generated under the influence of temperature and oxygen concentration in the vortex chamber and the subsequent areas of the precalciner. The amount of thermal NOx generated increases in the main combustion area in the upper part of the precalciner vortex chamber and the generation rate increases rapidly, mainly due to the temperature and nitrogen concentration in the precalciner. However, the generation of thermal NOx is generally very low under the conditions in the precalciner and the concentration of thermal NOx is of the order of magnitude of 10-7 to 10-6, which can be ignored.
3.2.2 Prompt NOx
Figure 5 shows the concentration of prompt NOx at different axial heights and the average concentration distribution curve in the main section of the precalciner and the tubular gooseneck.
As can be seen from Figure 5, prompt NOx starts to form in the main part of the precalciner near Z=-0.44 m and reaches a maximum value of 1.67×10⁻³ mg/m3 near Z=6.4 m. The concentration of prompt NOx then remains between 1.55×10⁻³ and 1.60×10⁻³ mg/m3. Prompt NOx forms a very small peak again in the tubular gooseneck section of the precalciner at Z=40.09 m and then the prompt NOx concentration first decreases and then gradually increases with the flow towards the outlet, In general, the concentration of the prompt NOx in the tubular gooseneck section fluctuates little and basically remains between 1.54×10⁻³ and 1.56×10⁻³ mg/m3.
The factors that influence the generation of the prompt NOx in the main part of the precalciner were also analyzed. Figure 6 shows the temperature and the mass fraction distribution curves for fixed carbon, volatile matter and prompt NOx in the main body of the precalciner. It can be seen from the diagram that the volatiles from part of the pulverized coal are first released in the vortex chamber and form a small release peak at Z=-0.97 m. The generation of prompt NOx begins after the volatiles start to release, indicating that the generation of prompt NOx requires the CH compounds formed during the release of volatiles as intermediates. The generation time for fixed carbon starts to lag behind the generation of prompt NOx. Volatile CH, prompt NOx and fixed carbon CH are therefore generated in succession in the cement precalciner. The combustion of the volatiles takes place at -2.02 m <Z<3.24 m. Although the concentration of prompt NOx shows an increasing trend in this area its average concentration is low. This means that the amount of prompt NOx generated during the combustion of the volatiles accounts for only a small proportion of the overall prompt NOx. The interval over which fixed carbon combustion takes place is -0.44 m<Z<17.25 m, which includes the interval of entire prompt NOx generation. The interval of prompt NOx generation was also consistent with the high temperature region of the main section of the precalciner.
To summarize, the prompt NOx results mainly from the large number of CH components generated by combustion of the fixed carbon in the pulverized coal. These interacted with the N2 in the air under the influence of the high temperature. The generation of prompt NOx generation due to the release and decomposition of volatiles was comparatively minor.
In a comparison with the thermal NOx it was found that the difference between the two was that there is an obvious release peak during the generation of thermal NOx in the lower part of the vortex chamber, while the production of prompt NOx is basically 0. The concentration of thermal NOx gradually decreases in the tubular gooseneck section and is basically stable between 20<Z<35 m as the airflow moves towards the outlet of the precalciner. On the other hand, the prompt NOx in the gooseneck tube at Z=40.09 m still forms a small release peak and gradually increases in concentration between 20<Z<35 m. The generation of thermal NOx in the precalciner environment is significantly lower than that of prompt NOx. The similarities between the two are as follows: thermal NOx and prompt NOx are generated rapidly in the 0<Z<6.4 m region and reach a maximum concentration at Z=6.4 m, after which the generation rates of the two remain at their respective values.
3.2.3 Fuel NOx
During the generation of fuel NOx the reaction between the HCN and NH3 intermediates generated by the substances containing nitrogen in the fuel and the hydrocarbons in the volatiles and O2 is an important source of fuel NOx generation, so the relationships between HCN, NH3 and fuel NOx need to be considered.
Figures 7a and 7b show the average concentration distribution curves of fuel NOx, HCN and NH3 in the main part of the precalciner and the tubular gooseneck respectively.
Generation of the majority of the fuel NOx starts from Z=-2.02 m and reaches a maximum value of 366 mg/m3 near Z=14.29 m, after which the fuel NOx concentration is maintained at between 355 and 366 mg/m3. In contrast to the fuel NOx the HCN is generated rapidly from the height of Z=-2.02 m and reaches a maximum concentration value of 64.5 mg/m3 at Z=6.4 m, which basically remains unchanged. The concentration curve of HCN rises particularly rapidly at the height of -2.02 m<Z<0.61 m. The concentration of HCN still increases at 0.61 m<Z<6.4 m but with an increasing gentle trend. The maximum concentration of NH3 is 5.02 mg/m3, which is much lower than that of fuel NOx and HCN. The volatile compounds in the fuel decompose and burn rapidly in the range of -2.02 m<Z<0.61 m, so the HCN and NH3 increase rapidly while the corresponding increase of NOx is relatively slow. This indicates that the fuel NOx is formed by the thermal decomposition of heterocyclic compounds of nitrogen in the fuel to form HCN, NH3 and other intermediate groups, which are then transformed into NOx. The formation rate of HCN slows down significantly between 0.61 m<Z<6.4 m, the concentration of NH3 gradually decreases and the formation rate of NOx increases. This indicates that some of the HCN and NH3 is oxidized and converted into NOx while the NH3 converts more readily to NOx. The concentrations of fuel NOx, HCN and NH3 in the gooseneck of the combustion section are basically maintained at certain stable values, indicating that the production of NOx, HCN and NH3 in this area is very small and can basically be ignored.
In contrast to the previous results of research into thermal NOx and prompt NOx it was found that the trend of the generation curve of fuel NOx is similar to that of prompt NOx, but the generation interval is twice that of prompt NOx. This is because the prompt NOx is mainly generated in the fuel-rich area, so it has a small rapid formation range; most of the fuel NOx is closely related to the trajectory of the fuel itself, i.e. it is generated during the entire fuel combustion process, so its rapid generation area is relatively large.
In the combustion environment of the precalciner the fuel NOx is generally of the order of magnitude 102, which is much higher than for the prompt NOx and thermal NOx. The generation of thermal NOx and prompt NOx in the precalciner environment can therefore be ignored, while the generation of fuel NOx needs to be considered and controlled.
4 Results and conclusion
To summarize, the generation of thermal NOx in the precalciner environment takes place mainly in the lower high temperature region of the vortex chamber and the upper main combustion region. In the lower part of the vortex chamber, the generation of thermal NOx is also influenced by the oxygen concentration, nitrogen concentration and temperature. The generation of thermal NOx in the upper part of the vortex chamber is mainly affected by temperature. Prompt NOx in the precalciner is less affected by the release and combustion of volatiles and is mainly generated during the fixed carbon combustion process. The generation of fuel NOx in the precalciner is related to the distribution of HCN and NH3, during which the HCN has the greater influence on the generation of fuel NOx. The order of magnitude of thermal NOx generated in the precalciner environment is 10-6 to 10-7 mg/m3, of prompt NOx is 10-3 mg/m3, and of fuel NOx was 102 mg/m3. The concentration of the first two is much lower than that of fuel NOx, so most of the self-generated NOx in the precalciner is fuel NOx.
Acknowledgements
This work was financially supported by the scientific research plan guidance project of the education department of Hubei province, China (B2021011) and the 2021 innovation and entrepreneurship training programme for university students of Wuhan University of Science and Technology (21ZA007).
Überschrift Bezahlschranke (EN)
tab ZKG KOMBI EN
This is a trial offer for programming testing only. It does not entitle you to a valid subscription and is intended purely for testing purposes. Please do not follow this process.
This is a trial offer for programming testing only. It does not entitle you to a valid subscription and is intended purely for testing purposes. Please do not follow this process.
tab ZKG KOMBI Study test
This is a trial offer for programming testing only. It does not entitle you to a valid subscription and is intended purely for testing purposes. Please do not follow this process.
This is a trial offer for programming testing only. It does not entitle you to a valid subscription and is intended purely for testing purposes. Please do not follow this process.