Cement development in the Customs Union
 IMF WEO 4/2014
 OneStone Consulting
 OneStone Consulting
 OneStone Consulting
 OneStone Consulting
 OneStone Consulting
 OneStone Consulting
 Eurocement
 Eurocement
 Lafarge
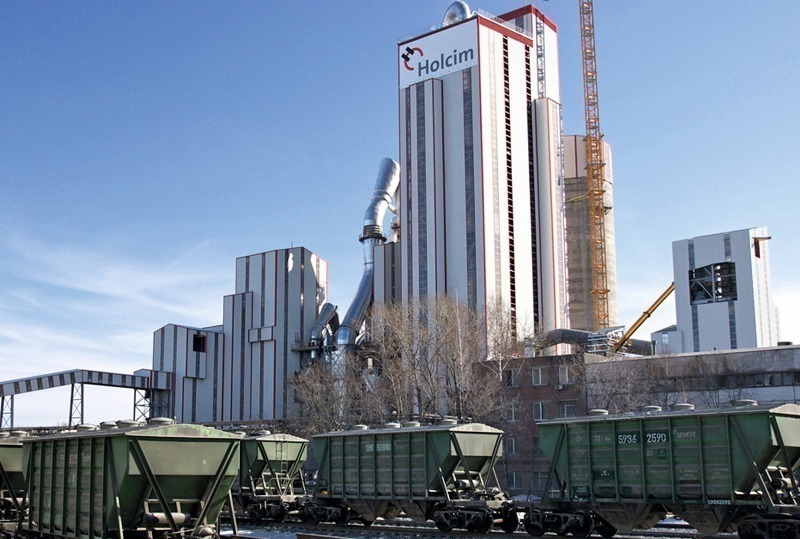 Holcim
 HeidelbergCement
 Belarusian Cement
 Belarusian Cement
 OneStone Consulting
 OneStone Consulting
 OneStone Consulting
 OneStone Consulting
 Steppe Cement
 Vicat
Vicat
The cement markets in the Customs Union, which is formed by Russia, Belarus and Kazakhstan show signs of deceleration, after some two-digit growth rates in the last few years.
1 Introduction
In May 2014 the Presidents of Russia, Belarus and Kazakhstan signed the Eurasian Economic Union treaty, which will come into effect in January 2015. The Customs Union, as the free trade zone is also referred to, will create a single economic market of 171 million people and a gross domestic product of 3 trillion US$. Citizens of the three countries will have the right to work freely throughout the member states. Beside this the troika of countries will cooperate in energy, industry, agriculture and transport.
Over the last three years trade within the customs union has increased...
1 Introduction
In May 2014 the Presidents of Russia, Belarus and Kazakhstan signed the Eurasian Economic Union treaty, which will come into effect in January 2015. The Customs Union, as the free trade zone is also referred to, will create a single economic market of 171 million people and a gross domestic product of 3 trillion US$. Citizens of the three countries will have the right to work freely throughout the member states. Beside this the troika of countries will cooperate in energy, industry, agriculture and transport.
Over the last three years trade within the customs union has increased by 23 bn US$ or nearly 50 %. At the end of 2013, the trade value stood at 66.2 bn US$. Other CIS countries (Commonwealth of Independent States) such as Armenia, Tajikistan and Kyrgyzstan may join the free trade zone later.
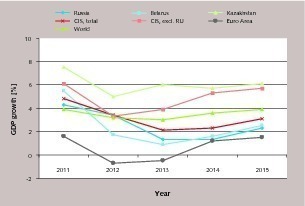
The start of the Customs Union comes at a time of de-orienting economic growth rates in the region. According to the IMF (International Monetary Fund) the CIS countries and Russia were projected in the World Economic Outlook (WEO; April 2014) with 2.3 and 1.3 % growth in 2014 and 3.1 resp. 2.5 % growth in 2015 (Fig. 1). Growth rates in Kazakhstan and Belarus were projected to be 5.7 and 1.6 % in 2014 and 6.1 resp. 2.5 % in 2015, which is higher than the growth rate in the Euro area. But in July 2014 with weaker than projected global growth in 2014 and the geopolitical tensions and sanctions due to the conflict in East Ukraine, the IMF reduced it’s projections for economic growth in the CIS countries and Russia to only -0.4 and -0.1 % in 2014, and to 0.9 and 0.4 % in 2015, respectively.
The exchange rate of the Russian Rubel to the US$ stood at 0.026962 at the beginning of September 2014, a record low for the Rubel which had lost more than 10 % against the Dollar since the beginning of the year. Russia’s Rubel is sensitive to political events, and has experienced great fluctuations in recent years. The conflict in the Ukraine also boosted US real estate as Russian and Ukrainian investors think about moving their money overseas and investing in the more-stable West has always been an option. The outflow of money from Russia and the CIS countries has a very negative effect on the local construction industry and cement markets.
2 The Customs Union from a cement perspective
According to a report by Ernst & Young (EY) in 2013 [1], the cement industry is one of the most promising in the economy of the Customs Union (CU) countries. It was mentioned that Russia reached a record-high level in cement consumption in 2012 and the analysts expect the demand to grow significantly by 2020 amid the modernization of the Russian and Kazakh transport systems, the implementation of federal housing programs in these two countries, the 2014 Winter Olympics and finally the 2018 FIFA World Cup. Projections in a recent study by McKinsey sees the Russian cement demand rising to 103 million tons per year (Mta) with a CAGR of 5.7 % by 2020 [2].
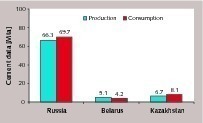
Fig. 2 shows the cement production and consumption in the CU countries in 2013. With a figure of 66.3 Mta, Russia accounts for almost 85 % of the entire cement output of the CU countries, which totals 78.1 Mta. Russia’s cement consumption was 69.7 Mta, which is also 85.0 % of the CU total of 82 Mta. Belarus produced 5.1 Mta (6.5 %) and had a consumption of 4.2 Mta (5.1 % of the total CU), while Kazakhstan achieved a production of 6.7 Mta (8.6 %) and a consumption of 8.1 Mta (9.9 % of the total CU). The balance of production and consumption show that Russia and Kazakhstan are cement importers, while Belarus is a cement exporter. In terms of the per capita cement consumption Russia with 486 kg, Kazakhstan with 476 kg and Belarus with 442 kg are very close to each other.
The latest figures for 2014 indicate that the cement demand growth is declining. In Russia the cement consumption from January to July increased 4.4 %, when compared to the same period last year. In July cement consumption decreased by 0.9 % year-on-year (YoY) to 7.9 Mta. Also Russia’s cement production showed a decline by 0.6 % (YoY) in July this year. In Kazakhstan the major producer Steppe revised its outlook for the Kazakh cement demand to 8.2 Mta, which is only slightly more than in 2013. Only the latest production figures from Belarus are a little more optimistic where cement production was increased by 11.6 % (YoY) from January to July this year. A large proportion is coming from increased cement exports to Russia.
3 Cement industry development in Russia
3.1 Cement market development
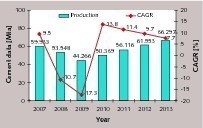
Russia’s cement industry has already gone through various ups and downs [3]. During Soviet times the demand for cement was higher than today. So in 1990, for example, the country produced 83 Mta, and ranked 2nd after China. With the collapse of the Soviet Union, cement production fell to 26 Mta in 1998. Recent cement production figures and corresponding growth rates in production are presented in Fig. 3. Since 2009, another bad year for the cement industry due to the global financial crisis, cement production has climbed from about 44.3 Mta to 66.3 Mta in 2013 an increase of 22 Mta. Highest growth rate was achieved in 2010 with 13.8 %, when the demand for cement was coming back to normal. But it is also very obvious now, that the annual growth rates have steadily declined from 13.8 to just 7.7 % last year.
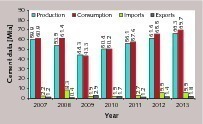
Fig. 4 shows how cement production in Russia fits in with demand, imports and exports. In the last two years imports and exports have become more stable so that with an increase in demand production increased. But in the years before it was different. From 2007 to 2008 consumption increased, production declined and imports increased nearly 4-fold, due to a dramatic increase in local cement prices [4], which made imports competitive in spite of the enormous transport distances in the country. In the same way as imports increased, exports decreased. At present imports of 5.5 Mta account for 7.9 % of the cement consumption of 69.7 Mta, compared to 13.5 % in 2008, while exports of 1.8 Mta make up 2.7 % of the production, after the all-time high of 6.7 % in 2009.
The pre-crisis level of 61.4 Mta of cement consumption was first surpassed in 2012 with 65.5 Mta. But it took 3 years from the crisis in 2009 to get to this level. The annual growth rate of cement demand was highest in 2010-2012 with 15.9 %, 14.7 % and 13.7 % respectively, when the former drop had to be compensated for. But in 2013 the growth rate was only 6.4 % and the latest figures for this year show no better results. From January to July 2014 cement consumption increased by only 4.4 % to 41.1 Mta and when July this year is compared with July last year only a 0.9 % increase is recorded. The biggest increase this year in cement consumption was in the Volga Federal District with 12.3 % and Central Federal District with 5.7 %, while the largest decline was in the Southern Federal District (-18.7 %), which shares a border to the west with the Ukraine.
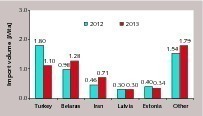
Although in the last two years imports increased only moderately by 1.1 % from 5.462 Mta to 5.521 Mta and major countries of supply did not change significantly, there is a large variation in the volume change from country to country (Fig. 5). The CU member country Belarus has become the top exporter to Russia. Their exports increased from 0.98 Mta in 2012 to 1.28 Mta in 2013, making up 23 % of Russia’s cement imports. Turkey fell from the No. 1 supplier in 2012 to No. 2 in 2013 with 1.1 Mta and 20 % import share. The largest growth was from Iran, which supplied 0.71 Mta last year. In 2013, the cost of imported cement from Iran was 67 US$/t, from Belarus 70 US$/t and from Turkey 76 US$/t, which is below the production costs of the Russian cement producers.
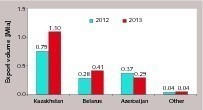
The direction of the major cement exports from Russia is shown in Fig. 6. The chart shows exports to Kazakhstan, Belarus and Azerbaijan and others which cover Armenia and Uzbekistan, but not the Ukraine. Some sources such as The Russian Federal Customs Service (FCS) report exports of 1.297 Mta in 2012 and 1.207 Mta in 2013 to the Ukraine. But this data could not be verified and was therefore excluded from the export statistics. Also the previously mentioned EY Report [1] does not show any Russian cement exports to the Ukraine. Nevertheless the figures underline an increased demand in 2013 in Kazakhstan and surprisingly also for Belarus, which should be in a position to be self-sufficient in cement.
3.2 Major cement producers and market shares
Russia’s cement industry is still highly fragmented and the number of cement groups and independent suppliers, which was estimated to be 28 has increased in the last few years. These cement producers operate 59 integrated cement plants and 5 additional separate grinding plants. The kiln capacity of the integrated plants is estimated at 83 Mta, of which about 12-13 Mta might not be operational, because a lot of the major plants still have four to six wet kilns which are not all in operation. Up to now ⅔ of the kiln capacity is of the wet type, while only ⅓ of the clinker capacity is by dry or semi-dry kilns. The cement capacity of the integrated plants is estimated at 96.5 Mta, and the capacity of the grinding plants is about 3.7 Mta, so in total there is more than 100 Mta cement capacity available.
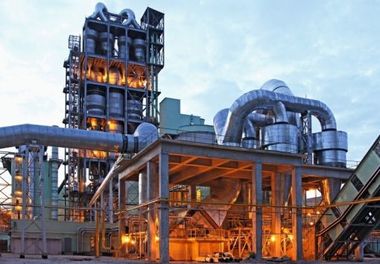
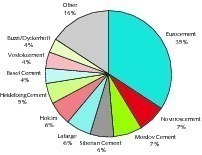
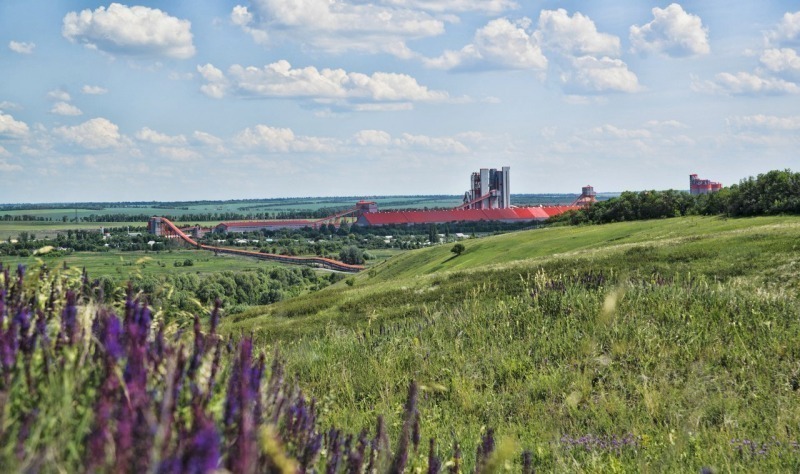
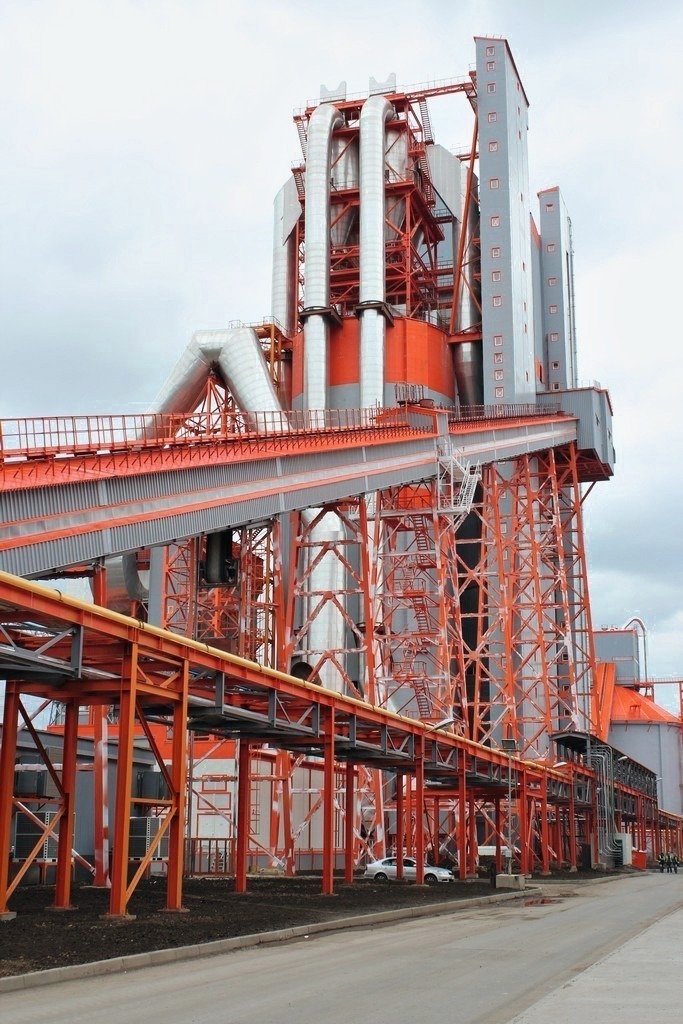
Table 1 and Fig. 7 provide an overview of the TOP 10 cement producers, the number of plants they own, their capacity and market share by capacity in 2014. Separate cement grinding plants are excluded from this overview. The market leader with a capacity of 33.1 Mta and a market share of 34.3 % is Eurocement. In Russia the Eurocement Group operates 13 integrated cement plants, of which Maltsowsky (4.25 Mta), Oskolcement (4.13 Mta) and Belgorodskiy (3.77 Mta) have the largest capacities. In 2013 a modern 3.0 Mta dry cement plant was made operational in the Voronezh region (Fig. 8). The fuel requirement of the high-tech kiln is 1.6 times lower, when compared to the company’s wet kilns and dust emissions are reduced by a factor of 2.5.
The percentage of modern dry cement production (Fig. 9) of the Eurocement kilns was increased to 25 %. But there is still much to do to upgrade the existing wet plants to dry and semi-dry technology. Additionally in May 2014 Eurocement signed a series of contracts with Chinese equipment suppliers for a number of new cement plants with a combined kiln capacity of 17 Mta. The contract signing which is worth 0.5 bn US$ took place at a bilateral meeting between the heads of state of Russia and China. Eurocement is planning to change all its production to dry process technology by 2018. The conversion of the wet kilns to dry will increase the output by another 5 Mta, so if no kilns are decommissioned Eurocement’s capacity could increase from 33.1 Mta in 2014 to about 55 Mta in 2018.
Next three places in the ranking go to the large Russian cement groups Novorosscement, Mordov Cement and Siberian Cement. Novorosscement combines the cement plants “Proletariat”, “October” and “First of May” in the Krasnodar region with 4.6 Mta wet and semi-dry capacity plus the Verhnebakansky dry process plant which was acquired in 2011 and has a capacity of 2.3 Mta. Mordov Cement has a cement production capacity of 6.8 Mta, and has one of the highest proportions of dry process technology of the leading producers. In 2013 about 4.72 Mta of cement and 4.12 Mta of clinker were produced, which results in a cement capacity utilization of 69 %. Siberian Cement has a capacity of 6.1 Mta and in 2013 produced about 4.3 Mta, of which 2.9 Mta were from the Topkinsky plant.
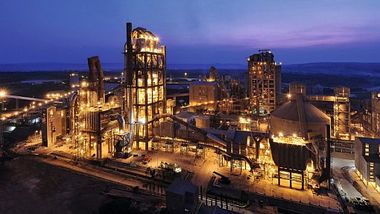
At the moment Lafarge and Holcim rank in 5th and 6th place with 6.1 Mta and 5.8 Mta cement capacity, respectively, from a total of five integrated plants. The new Ferzikowo plant (Fig. 10) is the first greenfield cement project of Lafarge in Russia. The 5000 tpd modern kiln system was made operational in May this year. The plant allows 2.0 Mta cement production, most of it will be for the growing Moscow cement market. Holcim inaugurated a new 2.1 Mta kiln line in Shurovo (Fig. 11), about 100 km south of Moscow. Additionally the Volks cement plant of Holcim will be upgraded to the semi-dry process. Commissioning is planned for the 2nd half of 2016.
The proposed merger of Lafarge and Holcim and the takeover of Lafarge’s Russian assets have already been agreed to by the government’s commission on foreign assets (FAS) and interestingly, the transaction is expected to increase competition in the market.
The subsequent places in the TOP 10 are taken by HeidelbergCement, Baselcement, Vostokcement and Buzzi/Dyckerhoff. HeidelbergCement operates the three integrated cement plants Cesla, close to St. Petersburg, Sterlitamak (2.0 Mta, Fig. 12) and Tula (2.0 Mta) which is 150 km south of Moscow, and became operational at the end of 2011. The Tula plant capacity is expandable to 4.0 Mta. Basel Cement operates the Achinsk plant and the 1.8 Mta Serebryansky dry cement plant. Vostok Cement’s main asset is the 2.3 Mta Novospassk cement plant, while Buzzi/Dyckerhoff owns the Sukholozhsk cement plant where a new kiln system increased the cement capacity from 2.4 to 3.6 Mta.
The other remaining Russian cement producers have a combined production capacity of 15.2 Mta from 23 integrated plants. The total market share of these other companies is about 15.8 %. Among them are larger producers such as Gornozavodskcement (2.7 Mta), Iskitimcement (2.1 Mta), YuUGPK Cement (2.1 Mta), United Cement Group (2.0 Mta in Novotroisk and Kuznetsk Cement) and the LSR Group (1.9 Mta). Smaller producers comprise Magnitogorski Cement (0.9 Mta), Teploozyorsky Cement (0.9 Mta) and Norilskaya Mining (0.8 Mta). Cement producers with separate grinding plants such as Mechel (1.6 Mta) and Makhachkala Cement (0.9 Mta) are not included in the cement capacities.
3.3 Russian cement market trends
The major issue is the modernization of the cement industry, which includes upgrades of existing wet process lines to dry and semi-dry processes and the installation of new dry process lines [1, 3]. Looking ahead to 2025 at least 21 projects with a total capacity of more than 37.0 Mta are planned [5]. In 2013 new capacity of 8.5 Mta was brought online, another 6.4 Mta is expected in 2014 and a further 10.6 Mta in 2015 [2]. The question mark behind all this is, how much of the existing wet cement capacity will be eliminated? In China only a few of these plants have been upgraded, in Russia the trend is to upgrade. Chinese equipment suppliers are also encouraging Russia to build new plants. Furthermore Sinoma as an investor in Zabaikalsky Cement might compete with Russian cement producers.
In 2013 the cement prices declined significantly, and then stabilized in 2014. Record volumes of cement production coupled with increasingly lower priced imports since 2012 led to lower average producer prices. So the average prices over the year fell from 2917 Rubel (RUB) per ton (93.5 US$/t) in 2012 to 2815 RUB/t (90.2 US$/t) in 2013 according to the Federal State Statistics Service (FSSS). From January to July 2014 the average producer prices stood at 2783 RUB/t (89.6 US$/t) (excluding VAT and delivery), which is a decline by 0.1 % (YoY). Average cement delivery prices were 4023 RUB/t (128.9 US$/t) in 2012 and 3897 RUB/t (120.1 US$/t) in 2013. In local currency this was a decline of 3.5 % (YoY), while in US$ the YoY decline was 6.8 %.
4 Cement industry development
in Belarus and Kazakhstan
4.1 Cement market in Belarus
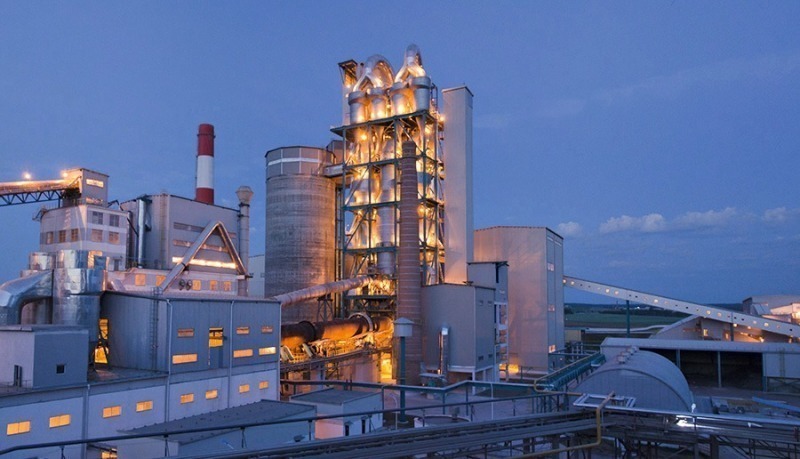
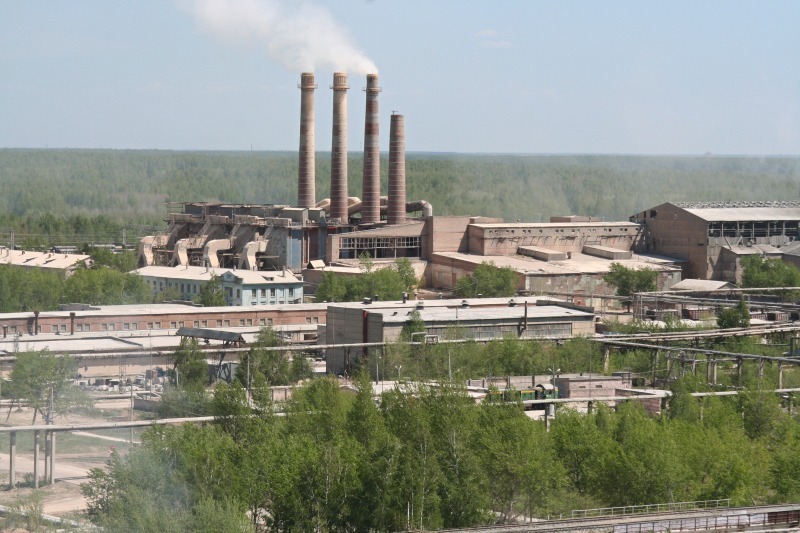
In 2007 at the height of a construction boom and with a cement shortage in the country the President of Belarus issued an executive order on the modernization of the cement industry. The industry, at that time, consisted of the three cement plants of Belarusian Cement (Fig. 13) at Kostukovichy, Krasnoselskstroymaterialy and Krichevtsementnoshifer, with a combined capacity of 4.6 Mta, with only wet kilns. It was decided to build three new 1.8 Mta dry cement lines at each plant. The project was awarded to the Chinese CITIC Group. The project costs were estimated at 1.13 bn US$. The Chinese partner was primarily chosen due to financing, with loans of about 530 million US$ from the Chinese Eximbank to the cement manufacturers. The three new plants (Fig. 14) became operational with Sinoma technology about two years later than planned.
The volume of housing construction in Belarus was the driver behind the cement boom. The period from 2004 to 2010 was the most dynamic one with the annual housing demand nearly doubling from 3.5 million square meters (m2) to 6.6 million m2. But in 2013 the new housing demand was back to 3.5 million m2, although government housing policy is to increase housing to 27–28 m2/capita in 2015.
Fig. 15 shows how the cement production increased in the last few years. In 2008 there was a double digit increase in production, but the annual increase slowed down considerably and in 2013 only a little more than 5.0 Mta cement was produced. The capacity stands at 9.5 Mta, which means that only 53 % of capacity was utilised.
Cement consumption has decreased to 4.191 Mta in 2013 (Fig. 16), which is below the level of nearly 5.0 Mta in 2008. Exports stood at 1.39 Mta in 2013, of which 1.275 Mta (92 %) went to Russia. About 0.52 Mta were imported, of which 0.414 (80 %) is from Russia and the rest is from Lithuania, Latvia and the Ukraine. Latest figures from the National Statistics Committee show that from January to July 2014 Belarus produced 3.068 Mta of cement, which is an 11.6 % (YoY) increase and comes mainly from higher exports to Russia. So from January to May 2014 exports alone increased to 0.70 Mta, which is an increase by a factor of 1.7 (YoY). In the same period imports increased to 0.21 Mta, which is an increase by a factor of 1.6 (YoY).
State-owned Belarus cement companies signed a contract with Russian Eurocement for a guaranteed supply of 1.5 Mta of cement with an option for another 0.5 Mta. The contract is for an agreed cement price that is significantly below the domestic market price of 85 US$/t. In a statement from the Ministry of Construction it was mentioned that the prices to Russia were increased from 66 US$/t to 78 US$/t. But the cement producers in Belarus are still reported to make losses. To pay-back the loans to Eximbank the Government increased its stake in the cement producers and proposed a cement holding which was already in place for the two plants in the Mogilev region. Eurocement also wants to increase its partnership with an investment of 70-80 million US$ to upgrade the existing wet cement kilns.
4.2 Cement market in Kazakhstan
The GDP growth projections of about 5–6 % for the country are very promising. Kazakhstan plans to allocate 14.6 bn US$ for housing construction as part of the 2020 affordable housing program. Much larger investments are foreseen for developing the railroad system and transport infrastructure. However, in the last few years forecasts about the development of the cement industry in Kazakhstan were often wrong. The booming demand in the 2000s and market prices close to 200 US$/t attracted a large number of investors from the cement industry. But the national banking crisis in 2007 and the global financial crisis in 2008 slowed down growth in the cement and construction industries and many of the new cement projects were halted or redesigned for smaller capacities.
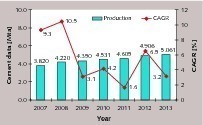
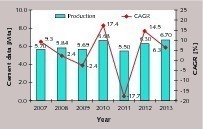
Fig. 17 shows the development of cement production as it was given by EY [1], based on data from CMPRO with a 2013 projection by OneStone Consulting. According to EY in the last seven years production was highest in 2010 and lowest in 2009 and 2011, which led to large changes in the CAGR from 2010 to 2012. According to the OneStone projection, in 2013 cement production was 6.7 Mta, back to the 2010 level. The largest sales markets are the capital Almaty (2.0 Mta) and the cities Astana and Askmola (1.2 Mta, each). South Kazakhstan with Shymkent, Taraz and Kyzylorda consumes 2 Mta. According to Steppe Cement the average ex-factory cement price increased slightly from 74 US$/t to 79 US$/t in 2013, which is still significantly below the 2008 price level of 105 US$/t.
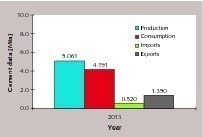
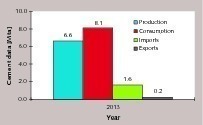
Cement consumption and import figures for 2013 were also provided by Steppe Cement and United Cement Group (Fig. 18). A cement consumption of 8.1 to 8.2 Mta was reported, of which about 1.6 Mta or 20 % was imported, while about 0.2 Mta or 3 % of production was exported. Major imports with 1.1 Mta (69 %) are from Russia, the rest is mainly from Uzbekistan, Iran and Turkey. Exports were going to Kyrgyzstan and Tajikistan. After the 1.H 2014 Steppe Cement revised its outlook for 2014 from 8.6 to 8.2 Mta, which means the demand for cement in Kazakhstan will stagnate this year. Ex-factory prices decreased from 12,084 Kyrgyzstani som (KGS)/t to 10,797 KGS/t (~198 US$/t), so that with the 19 % currency devaluation in February this year the prices declined from 79.0 US$/t in 2013 to just 58 US$/t in the 1.H 2014.
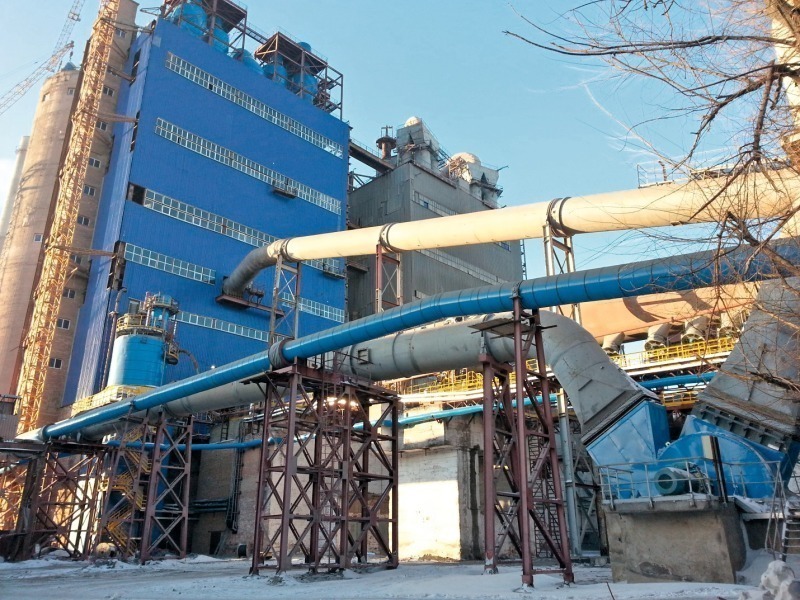
At present there are nine cement producers and ten cement plants in Kazakhstan (Table 2). The market leader is HeidelbergCement with a capacity of 3.3 Mta from two plants. The new 0.8 Mta Shepte plant in Aktau at the Caspian Sea, which has been in planning since 2007, became operational at the end of 2013. The No. 2 in ranking is Steppe Cement, which is the holding company for Karcement and Central Asia Cement. The company completed its Line 5 (Fig. 19) in March 2014, taking its total capacity to 2.8 Mta and dry process capacity to 2.0 Mta. Shymkent Cement, which is part of Italcementi, operates one cement plant with 1.3 Mta capacity. In December 2013 the company held a ground breaking ceremony for a new 1.2 Mta kiln line, which will replace the existing wet kilns.
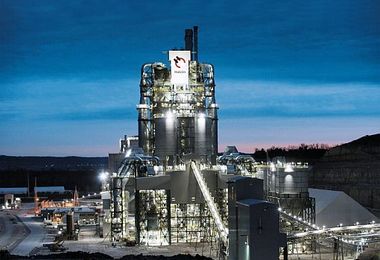
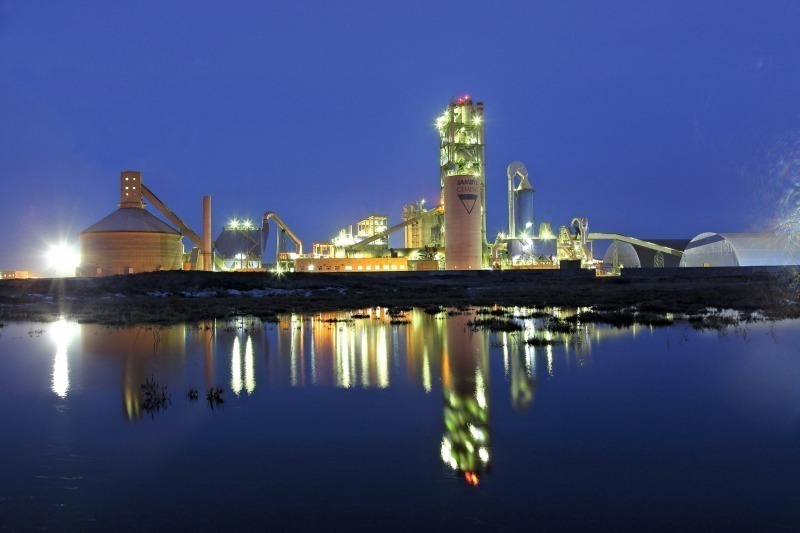
The United Cement Group operates the Semey cement plant, which has four wet kilns and a capacity of 1.2 Mta. The company is also one of the largest cement importers and supplies cement from its Novotroitsk cement plant in Russia’s Orenburg region. Kokshe Cement is a new entrant to the market. In 2007 the company awarded FLSmidth a contract for a new 2.0 Mta cement plant with 5500 tpd kiln line. Latest information is that now 1.2 Mta have become operational. Vicat decided in 2007 to enter Kazakhstan and commissioned the 1.1 Mta Jambyl cement plant (Fig. 20) in November 2010. This modern plant is strategically located and linked directly to the rail and sea networks that connect the major cities of Astana and Almaty.
Sastobe cement, which is part of Russia’s Basel Cement group operates a white cement plant, that has been upgraded to 0.5 Mta capacity. Other smaller cement producers at the moment consist of ACIG Cement (Alliance Group) and Yug Cement. ACIG made its debut to the market with a 0.4 Mta plant in Hantau, while Yug Cement emerged as an investor for the previously mothballed 0.5 Mta Khantau plant in the Zhambyl region. The list of prospective new entrants to the market is longer and includes a 1 Mta cement plant in the eastern region of Shar as well as a 1 Mta project by Sary-Ozek to be situated close to the capital Almaty.
Nevertheless, it has to be noted that by the end of 2014 about 12.3 Mta of cement capacity is available compared to a consumption of about 8.2 Mta and Kazakhstan probably still imports 1.0 Mta and exports 0.2 Mta, so that actually the capacity utilization is no better than 60 %. George Kleger, who left his post as the President of Sibcem commented that expansion to Kazakhstan was a mistake, because the capacity increase there only led to excess capacity [6].
5 Outlook
The long-term cement demand projections for Russia and the other CU countries are often based on short-term growth extrapolation. One such example is the projection by McKinsey [2] about Russia’s cement demand by 2020, resulting in a CAGR of 5.7 % over the next 7–8 years and 103 Mta demand. What can be criticized is that the limitation in the per capita cement consumption (PCC) is often not taken into account. So at the moment Russia’s PCC stands at 486 kg. The McKinsey projection will lead to a PCC of 718 kg by 2020. OneStone Consulting is more conservative in the PCC projection, taking the historic development into account and comparing this with other emerging countries and regions.
So for Russia, OneStone Consulting can imagine a PCC of 600 to 650 kg by 2020, which will result in a cement demand of about 86.0 Mta to 93.5 Mta by 2020, when also taking the latest population projections into account. Accordingly projections for Belarus and Kazakhstan were made. With a projected PCC of 550 to 580 kg in Belarus the cement demand in 2020 will be 5.0 to 5.3 Mta, while for Kazakhstan a projected PCC of 630 to 670 kg will result in a cement demand of 11.6 to 12.3 Mta by 2020. So by 2020 the cement demand of the CU’s three founding members will result in about 103 to 111 Mta.
Überschrift Bezahlschranke (EN)
tab ZKG KOMBI EN
This is a trial offer for programming testing only. It does not entitle you to a valid subscription and is intended purely for testing purposes. Please do not follow this process.
This is a trial offer for programming testing only. It does not entitle you to a valid subscription and is intended purely for testing purposes. Please do not follow this process.
tab ZKG KOMBI Study test
This is a trial offer for programming testing only. It does not entitle you to a valid subscription and is intended purely for testing purposes. Please do not follow this process.
This is a trial offer for programming testing only. It does not entitle you to a valid subscription and is intended purely for testing purposes. Please do not follow this process.