Further modernization of Russia’s cement
industry
 Quelle/Source: IMF – WEO 10/2012
 Quelle/Source: LSR
 Quelle/Source: OneStone Consulting
 Quelle/Source: OneStone Consulting
 Quelle/Source: OneStone Consulting
 Quelle/Source: OneStone Consulting
 Quelle/Source: OneStone Consulting
 Quelle/Source: Eurocement Group
 Quelle/Source: Eurocement Group
 Quelle/Source: Novoroscement
 Quelle/Source: Holcim Russland
 Quelle/Source: HeidelbergCement
 Quelle/Source: Basel Cement
 Quelle/Source: LSR Group
 Quelle/Source: YUGPK
 Quelle/Source: Eurocement Group
 Quelle/Source: OneStone Consulting
 Quelle/Source: OneStone Consulting
 Quelle/Source: OneStone Consulting
 Quelle/Source: OneStone Consulting
 Quelle/Source: HeidelbergCement
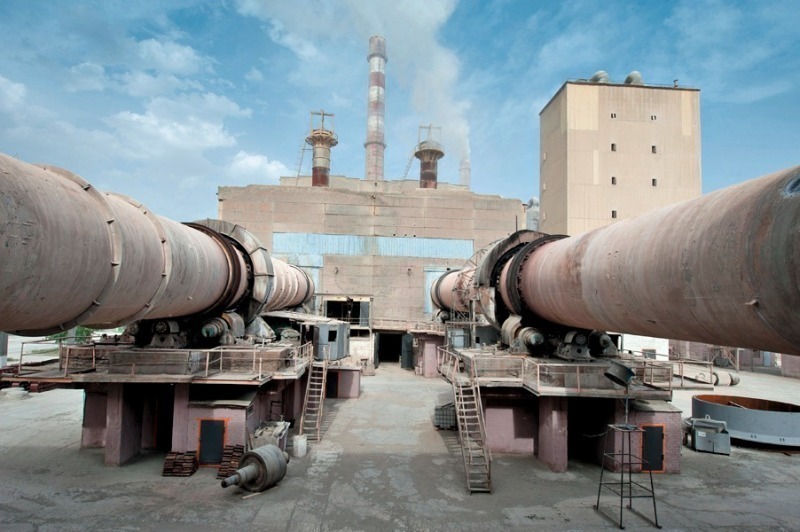
In the coming years, Russia’s cement industry will have great growth opportunities but will also face enormous challenges as a consequence of its outdated kiln technology.
1 Introduction
1 Introduction
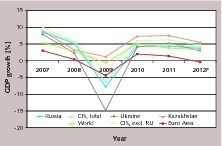
Of the countries considered, Kazakhstan enjoyed an above average growth rate of 7.3 % and 7.5 % in 2010/2012. Even in the recession-plagued year of 2009, the country achieved a positive growth of 1.2 %. In contrast, the Ukraine experienced negative growth of -14.8 % in 2009. Russia experienced an economic slump of -7.8 % in 2009, which was significantly worse than the -4.4 % of the Eurozone or the -0.6 % of the global economy. Considering the economic growth of the CIS excluding Russia, the growth rates for 2010 and 2011 were +6.0 and +6.2 %, which is significantly better than the global economic growth. For 2012 a figure of +4.7 % is forecast, which is 1.4 % higher than the global economic growth.
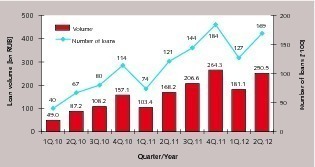
Although the latest available information (Quarter 2, 2012) shows that interest on mortgages in Russia is still at 12.1 % (for credits in rouble) – after the highest value of 14.6 % (Q3 2009) or 9.6 % for foreign currency (Q2 2012) and 13.5 % (Q3 2009) – a perceptible increase in the granting of mortgage loans is currently taking place (Fig. 2). The overall extent of mortgage loans has risen from 49 billion roubles (Q1 2010) to 181.1 billion roubles (Q1 2012). The respective 2nd quarters of the two years show an increase from 87.2 to 250.5 billion roubles. After a figure of 40 000 credits in Q1 2009 there was a rise to 127 000 in Q1 2012 and 169 000 in Q2 2012. For Q4 2012 the expected mortgage volume is approx. 300 billion roubles with around 200 000 credits granted. Nevertheless, it should also be noted that the IRN price index for places of residence in Moscow has climbed from 34 in 2002 to 163 in July 2012.
2 Cement markets in the CIS countries
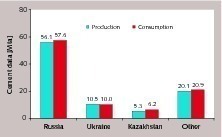
Fig. 3 shows the cement production and consumption in the CIS countries for 2011. With a figure of 56.1 million tonnes per year (Mta), Russia accounts for 61.0 % of the entire cement output of the CIS countries, which totals 92.0 Mta. Russia’s cement consumption is 57.6 Mta, which is 60.8 % of the CIS total. The Ukraine produced 10.5 Mta (11.4 %) and had a consumption of 10.0 Mta (10.6 %). Kazakhstan’s data shows a production of 5.3 Mta (5.8 %) and a consumption of 6.2 Mta (6.5 %). The nine remaining CIS countries (Armenia, Azerbaijan, Belarus, Georgia, Kirghizia, Moldova, Tajikistan, Turkmenistan and Uzbekistan) produced 20.1 Mta (21.8 %) and consumed a quantity of 20.9 Mta (22.1 %). At present, particularly Belarus, Tajikistan, Turkmenistan and Uzbekistan are achieving significant growth rates.
For 2012, forecasts see cement production in the CIS countries rising by 12.0 % to 103 Mta. It is expected that cement consumption will rise by 13.5 % to 107.5 Mta. As a result, the necessary rate of cement import for the region will increase from 2.9 Mta (2011) to 4.3 Mta in 2012. In recent years, Turkey, Iran, the Baltic countries, Romania and China have become the most important suppliers of CIS cement imports. Whether or not the region’s imports will increase further in the coming years depends on the development of modern cement production capacity in the CIS countries and on whether the imports are competitive, which will in part be determined by transport costs and import duties.
3 Russia’s cement industry
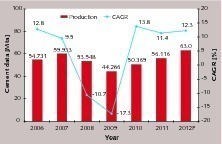
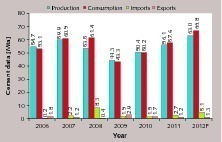
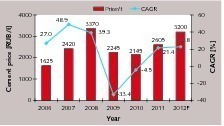
Fig. 5 shows the current situation of the cement industry, with data for production, consumption, imports and exports. While cement consumption was still rising in 2008, production decreased significantly from 2007 to 2008 because imports rocketed to 8.3 Mta. This development was caused by a dramatic rise in domestic cement prices [2] which made imports competitive, even given the enormous transport distances within the country. By 2010 the imports had fallen again to a level of 1.5 Mta as a consequence of decreasing domestic prices. At present, the rate of importation is again showing an increase. In 2011 imports totalled 2.7 Mta and for 2012 the forecast figure is 5.1 Mta. However, the present increase has different reasons, because the price of cement has remained quite moderate recently, as described in a later section of this report. The main reason for the imports is that not enough domestic cement production capacity is available to cover the increasing demand.
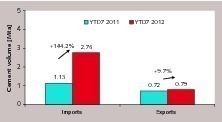
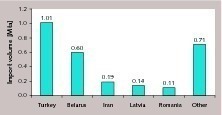
Import duties on cement have been reduced from 5 % to 3 %, which is due amongst other things to Russia’s accession to the World Trade Organization in August 2012. Current increases in cement imports and exports are shown in Fig. 6. Up to July of this year imports increased by 144.2 % in comparison to the preceding year, rising from 1.13 Mta to 2.76 Mta. In the same period of time, exports rose by 9.7 % to 0.79 Mta. Fig. 7 shows the most important supplier countries of cement imports for the present year up to July 2012. Turkey exported 1.01 Mta to Russia, accounting for 37 % of the import quantity. Belarus took 2nd place with 0.6 Mta (22 %), followed by Iran (0.19 Mta/7 %), Latvia (0.14 Mta/5 %) and Romania with 0.11 Mta/4 %. Other countries, including Lithuania, Sweden, China and South Korea accounted for 0.71 Mta and 26 % of Russian cement imports, each country having a 3–4 % share in the total import quantity. A group of 7 countries is responsible for a further approx. 12 % of the imports.
Russia’s per capita cement consumption (PCC) in 2007 was 430 kg [2]. This figure is approximately equal to the average worldwide per capita cement consumption (423 kg in 2008 [3]) and is considerably higher than the average per capita cement consumption of 379 kg for the Eastern European region. In 2009 the PCC for Russia fell to 305 kg at a population size of 141.8 million. In 2011 the PCC rose to 403 kg at an increased population figure of 142.8 million. For 2012 a further increase to 466 kg at a cement consumption of 66.8 Mta and a population figure of 143.2 million is expected. However, these forecasts by the renowned PRB (Population Reference Bureau) assume that the population of Russia will decline slightly in the future to number 140.8 million in 2025 and 127.8 million in 2050.
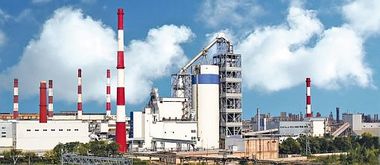
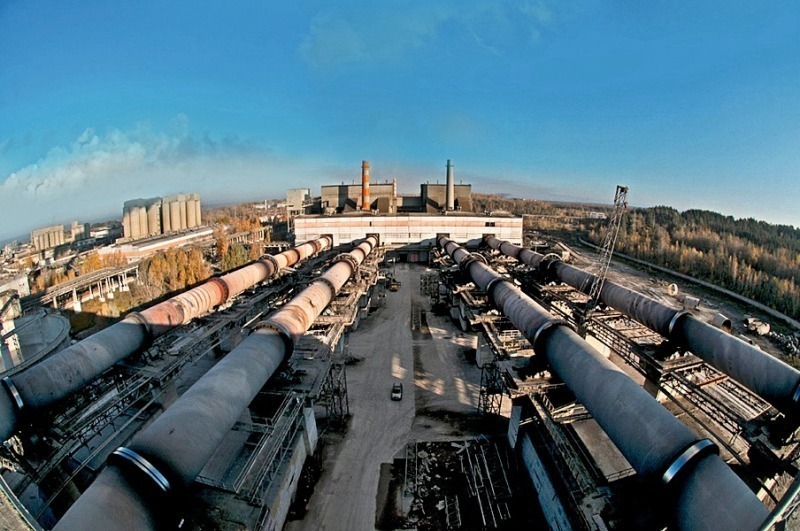
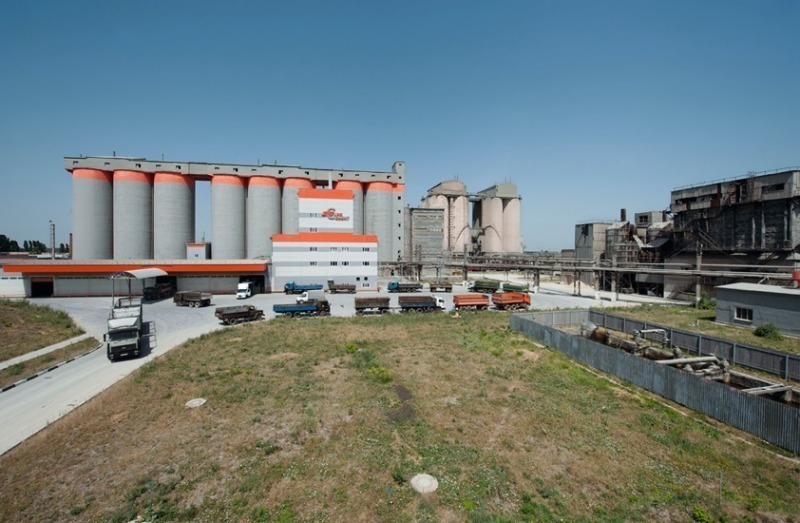
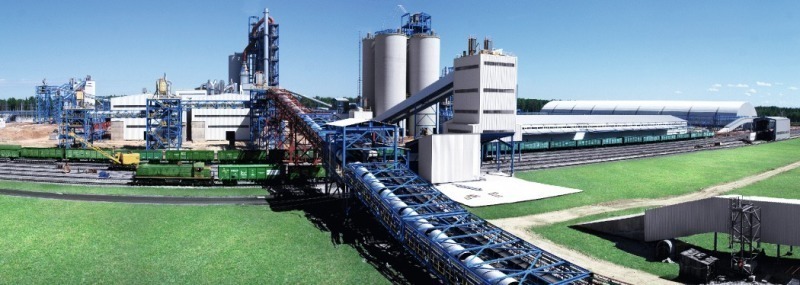
Table 1 provides an overview of the TOP10 cement producers, the number of plants they own, their capacities and their market shares. In recent years, a significant shift in the rankings has occurred due to initial company consolidations and the resultant new cement production capacities. The market leader is still the Eurocement Group with their cement production capacity of 28.4 Mta at 13 plants and a market share of 33.9 % (Fig. 8). Eurocement was established in 2003 as a result of Rosuglebyt’s takeover of Shtern Cement. The company has a total cement production capacity of 40 Mta in Russia, the Ukraine and Uzbekistan. In Russia itself, the company owns the plants Maltsovsky, Mihaylov, Lipetsk, Savinsky, Nevyansky, Katavsky, Kavkaz, Oskol, Belgorodsky, Pikalevky, Podgorensky, Ulyanovsk and Zhigulevskie. In recent years, the plants have been modernized and the loading terminals have been enlarged (Fig. 9). From 2012 to 2017 the company intends to build new plants in Ryzan, Samara, Lipetsk, Voronesh and Stavroplol with a total new capacity of 11.8 Mta.
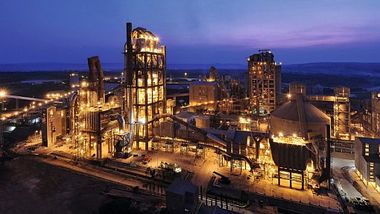
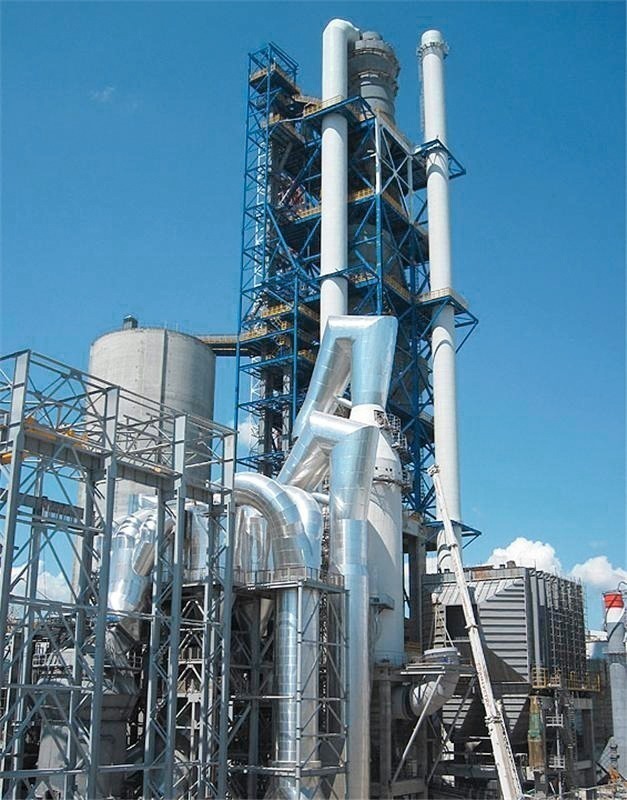
Novoroscement has meanwhile reached 2nd place in the rankings with a cement production capacity of 7.6 Mta at two plants. In November 2011, the company took over Verkhnebakansky Cement from Inteko. Verkhnebakansky has just put a new 2.3 Mta production line (Fig. 10) into service. The Proletariy plant of Noveros is currently being modernized and upgraded to 6000 t/d. A 4th plant is due to come on stream in the Krasnodar region.
Siberian Cement has fallen back into 3rd place with its cement production capacity of 5.4 Mta at the plants Topkinsky, Krasnoyarsky and Timlyuisky. After the deal with Lafarge – under which Siberian Cement should have taken over capacities in Turkey – fell through, the company is again concentrating on the Russian market. It has a 26 % stake in the Russian Cement Company (RCC), which has taken over 50.5 % of Angarskcement shares and is probably also going to take over Iskitimcement. This will enable Siberian Cement to expand its market presence in Siberia.
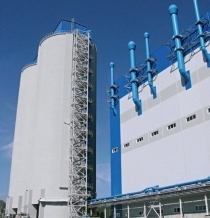
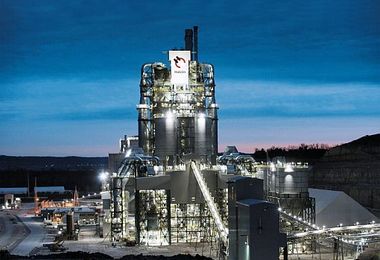
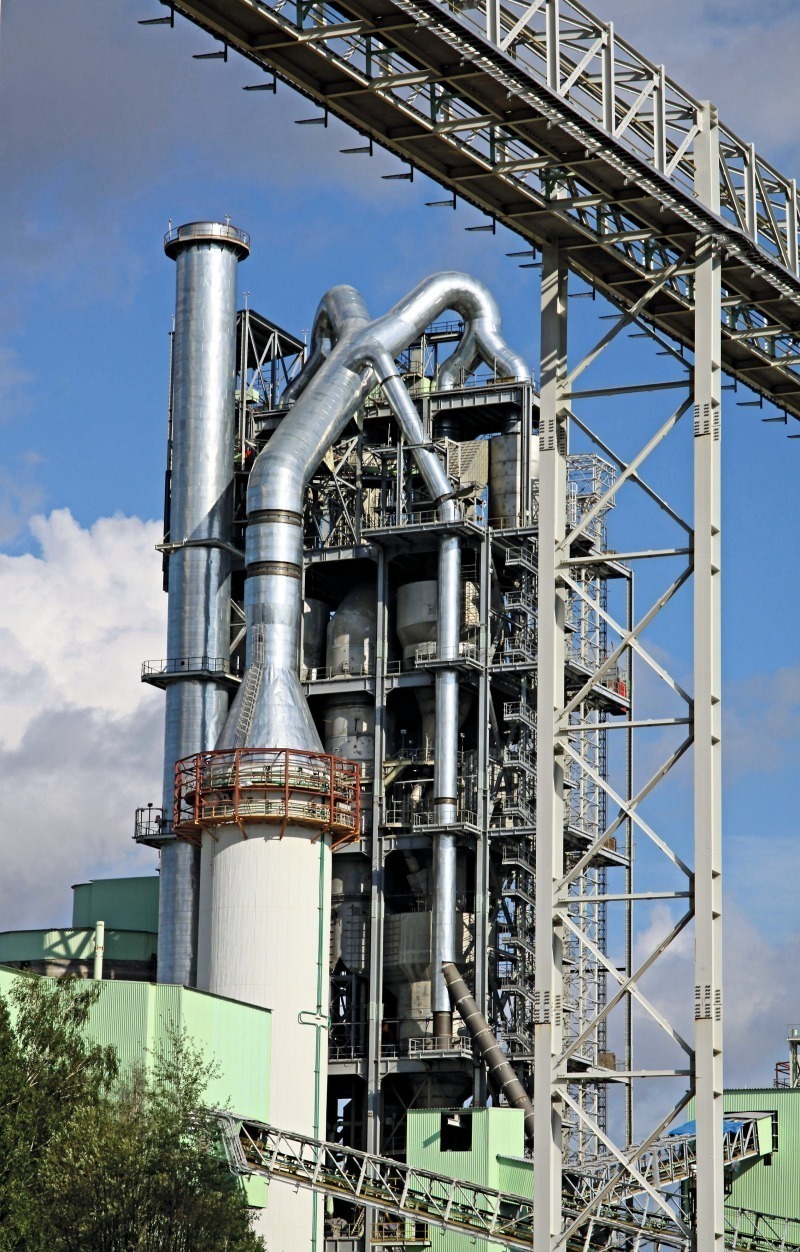
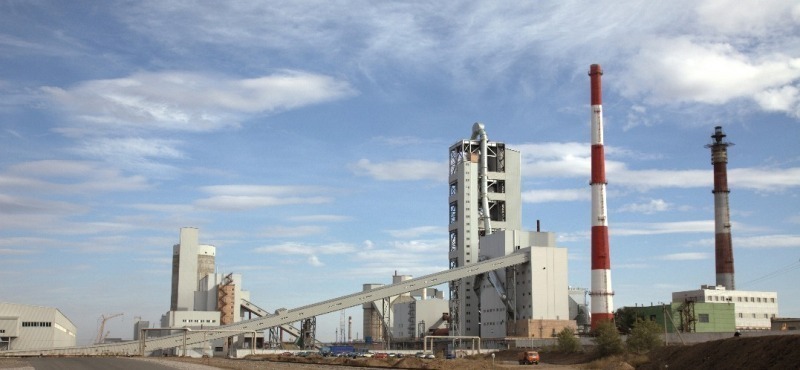
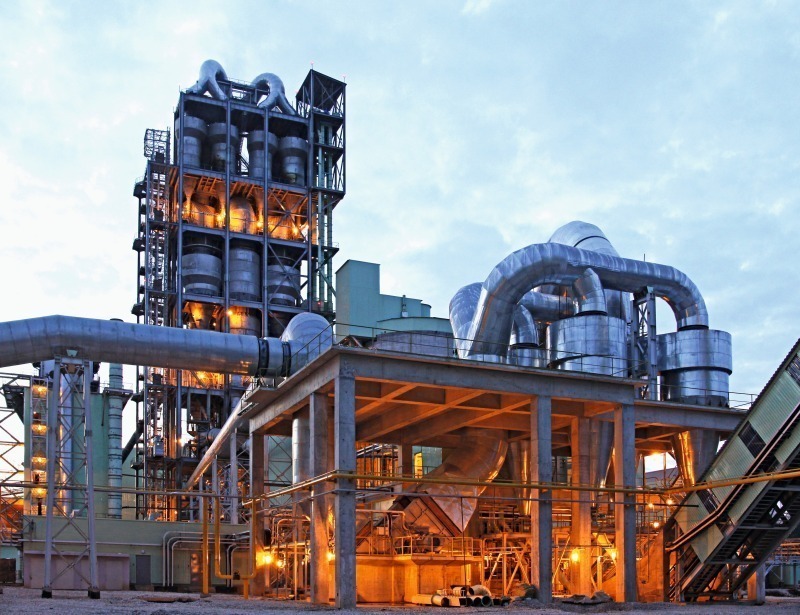
Holcim is currently at the head of the group of foreign international cement producers with a capacity of 5.1 Mta at two plants. Its Shurovo project was approved in 2007 and came on stream in July 2011. The new 2.1 Mta plant replaced two old wet process kilns. A similar project is to be carried out at Holcim’s Volkscement plant (Fig. 11). HeidelbergCement recommissioned the Tula plant at the same time that Holcim’s Shurovo facility was taken into service. The Tula plant was constructed 150 km south of Moscow and is equipped with a modern 5000 t/d kiln line (Fig. 12), built by a Chinese firm. With its present cement production capacity of 4.7 Mta at three plants, HeidelbergCement is in 5th place in the rankings. 6th place is occupied by Mordovcement with 4.4 Mta at two plants. At the end of this year, Mordovcement will have a cement production capacity of 6.9 Mta and will therefore climb up the rankings.
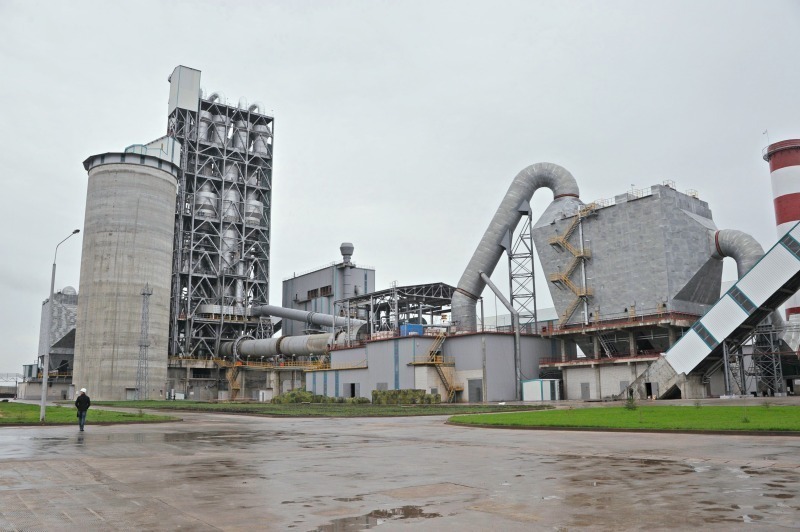
The subsequent places are taken by Lafarge, Buzzi Dyckerhoff, Vostokcement and Basel Cement, who all have a capacity of 3–4 Mta. New cement capacities are being built up by companies at all levels. Vostokcement (Park Group) owns the two plants Spasskcement and Teploozersky Cement as well as the strategic partner Yakutcement. It is reported that Basel Cement is up for sale and that the Irish company CRH is interested. Basel Cement has just put the Serebryanskoye Cement plant (Fig. 13) into operation. The most important projects of the other cement producing companies include the new 1.9 Mta Slantsky plant (Fig. 14) of the LSR Group close to St. Petersburg and the new 1.3 Mta Novotroisk plant (Fig. 15) of LLC YugPK in the Orenburg region.
The remaining Russian cement companies currently have a total production capacity of 13.4 Mta. As the examples show, there are some interesting newcomers in this group.
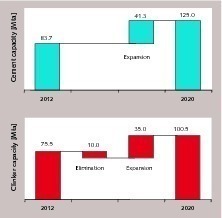
With regard to the development of modern kiln technology and planned capacity expansions, the data for Russia are also contradictory. OneStone Consulting forecasts that the modernization of wet process plants will in future only play a minor role and that more than 95 % of the new clinker production capacity planned up to 2020, amounting to approx. 35 Mta, will be provided by modern kiln systems. In this period of time the cement production capacity will grow by approx. 41 Mta, based on the assumption that the clinker factor will be 0.85. However, the available clinker production capacity will not rise by 35 Mta (Fig. 17), because a high proportion of the existing wet process plants will have to be shut down for economic reasons. OneStone Consulting forecasts that the existing clinker production capacity of 75.5 Mta will rise by around 25 Mta, i.e. by 2020 a further 10 Mta of capacity will be shut down. Under these premises, the percentage of modern kiln technology will initially increase from 15 % (11.3 Mta) to 46 % (46.3 Mta).
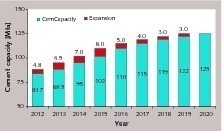
The cement production capacity is predicted to rise from 83.7 Mta in 2012 to 125 Mta in 2020 (Fig. 18). This will not necessarily be accompanied by shutdowns of existing grinding capacity; it is more likely that ball mills will be replaced or that their throughput rates and grinding efficiency will be improved by incorporating them into combi-grinding processes with roller presses. The main increase in cement production capacity will take place before the year 2015. At least 20 investment projects for new plants, modernizations and plant extensions are known. From today’s perspective, these projects will really be implemented if market prospects remain positive. In Russia, the payback periods for cement plant investments are relatively short at present. In some cases, the payback period is only 5–7 years, which is very short by international standards.
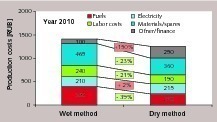
Fig. 20 compares the average production costs in Russia for the wet and dry processes. The reference year is 2010, when the production cost for the manufacturing of one tonne of cement was 1410 RUB/t for the wet process and 1255 RUB/t for the dry process, which brought a saving of 155 RUB/t or 11 %. The biggest saving with the dry process is in the cost of fuel, which is 39 % lower. With regard to personnel and material costs, the savings are 21 and 23 % respectively. Electricity costs increase by approx. 2 % with the dry process, which is mainly due to the fans. The other costs increase by 150 %. These include depreciation and financing costs. The cost benefits provided by the dry process become even greater when the increasing fuel costs and the ability of state-of-the-art dry process plants to replace fossil fuels with substitute fuels are taken into consideration.
4 Prospects
Überschrift Bezahlschranke (EN)
tab ZKG KOMBI EN
This is a trial offer for programming testing only. It does not entitle you to a valid subscription and is intended purely for testing purposes. Please do not follow this process.
This is a trial offer for programming testing only. It does not entitle you to a valid subscription and is intended purely for testing purposes. Please do not follow this process.
tab ZKG KOMBI Study test
This is a trial offer for programming testing only. It does not entitle you to a valid subscription and is intended purely for testing purposes. Please do not follow this process.
This is a trial offer for programming testing only. It does not entitle you to a valid subscription and is intended purely for testing purposes. Please do not follow this process.