2013 a crucial year for the USA
 Source/Quelle: Moody’s economy.com
 Source/Quelle: USGS, OneStone Consulting
 Source/Quelle: PCA
 Source/Quelle: PCA
 Source/Quelle: PCA, OneStone Consulting
 Source/Quelle: PCA
 Source/Quelle: Holcim
 Source/Quelle: Lafarge
 Source/Quelle: Lafarge
 Source/Quelle: HeidelbergCement
 Source/Quelle: Polysius
 Source/Quelle: Vicat
 Source/Quelle: Holcim
The year 2013 will be a critical one for the US cement industry. It will, on the one hand, become clear whether the positive trends on the residential building market will continue and on the other hand whether the implementation of stringent emissions standards will cause the shutdown of plants.
1 Introduction
The driving forces for growth have primarily been not industry, but rather private consumption, which accounts for around 70 % of economic output, partnered by higher state spending and residential building. Consumer confidence is now more buoyant than it has been for five years not least, as a result, of an increase in the number of people in employment. Residential building is enjoying a pronounced upswing. According to official statistics, “housing starts” rose by around 27 % compared to the same period in the previous year, to 585 000, up to the third quarter of 2012. The boom in building approvals is the result of a declining availability of accommodation and low rates of interest on mortgages. A 31.5 % rise, to 605 200, was observed up to the third quarter. The NAHB, the construction industry association, anticipates a total of 757 000 “housing starts” for the year now closing. This nonetheless represents significantly less than half of the housing starts for the previous peak year of 2005.
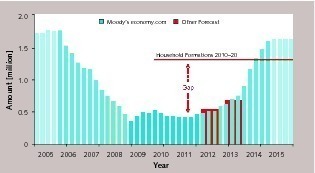
The Harvard Joint Center for Housing Studies assumes significantly higher figures for the near future, however. Some sixteen million single-family “housing starts” are estimated in one conservative assessment for the requirements of the 2010 to 2020 period (Figure 1). This equates to average annual requirements of 1.6 million houses, with new households accounting for no less than 1.3 million of these. This forecast envisages the first steep rise starting in 2013 and continuing into 2014. As from 2015, annual requirements are expected to stabilise at around 1.75 million “housing starts”, re-establishing the level prevailing prior to the recent banking and property crisis. It is also predicted, correspondingly, that the percentage of house ownership will initially stabilise, and then rise again.
2 Cement market trend and forecasts
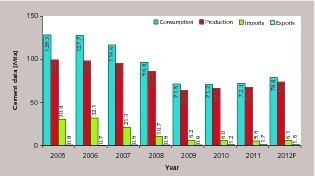
The market situation improved only marginally in 2010 and 2011, with cement consumption effectively stagnating. It was necessary, following temporary shut-down of production, to close numerous plants completely for cost reasons. Cement production rose by 5.9 %, from 63.9 to 67.7 Mta as a result of further reductions in imports from 6.2 to 5.6 Mta and a rise in exports (cements plus clinker) from 0.9 to 1.7 Mta. An around 9 % increase in overall cement consumption is anticipated for 2012, having already gained 10.0 % by the end of September. Portland and blended cements achieved growth of 10.2 %, and cement mortars 4.3 %. Imports also rose by nearly 10 %, resulting ultimately in an increase of practically 10 % in cement production, with virtually constant exports.
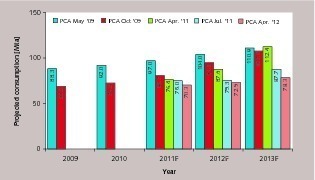
Predictions for the US cement market appear to be causing difficulty. The Portland Cement Association (PCA) normally publishes forecast data each quarter. Figure 3 shows results from a number of forecasts made in the crisis year of 2009 and the succeeding period. The way forecasts have been continuously adjusted to match actual market trends is apparent here. The May 2009 forecast, for example, assumed a greatly over-optimistic trend for 2009 as a whole and for subsequent years. 2009 was correctly forecast only in the October of that year, but developments in the succeeding years continued to be viewed far too optimistically. In 2011, after the worst of the actual cement crisis had passed, a similar situation occurred in the forecasts for the 2011 to 2013 period, with a recovery in sales predicted for much earlier than in fact occurred. Every successive new forecast was obliged to revise the previously published figure for cement consumption downward.
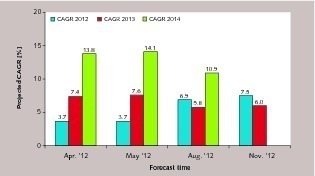
The growth which began in 2012 was thus not foreseen at a sufficiently early point. Figure 4 shows the PCA results for cement growth in each of the years 2012 to 2014. Growth for 2012 has been adjusted from an initial 3.7 %, firstly to 6.9 %, and then to 7.5 %, due to the forecasters‘ failure to foresee the upward market trend as the year progressed. The optimistic growth rates of 7.6 % and 14.1 % predicted for 2013 and 2014, respectively, were reduced to 5.8 % and 10.9 % in August. The reasons behind these adjustments were stated in each case. It could just as well have been admitted, however, that the previous estimate had been incorrect, or that the market trend had diverged from expectations.
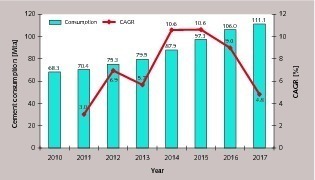
In view of the only moderate informational value of PCA predictions in recent years, the current prognosis for 2012 to 2017 should also be viewed with circumspection (Figure 5). The PCA admits that the „fiscal cliff“ problem will entail some significant mid-term implications for cement demand. The August 2012 forecast predicts a rise in cement consumption from approx. 75.3 Mta (Portland cement + blended cement; cement mortar not included) in 2012 to 111.1 Mta in 2017. Rates of increase are predicted to peak in 2014 and 2015, at 10.6 % in both years. Annual growth is then expected to fall to below 5 % in 2017. The forecast is, ultimately, that the highs of 2004 to 2006 will not yet be re-attained.
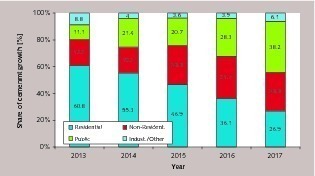
The PCA‘s forecasts explore significantly greater depths, however. For example, it is explained from which segment the cement growth is generated (Figure 6). Private residential construction is expected, for instance, to account for more than 60 % of growth in consumption in 2013. However, this segment is predicted to drop back to a contribution of less than 27 % by 2017. The public sector, in particular, is to expand from only around 11 % of growth in 2013 to above 38 % in 2017, on the other hand. Non-residential building is also expected to contribute a relatively large portion of growth, of 19 % to practically 29 %, across the forecast period. The industrial and other sectors, on the other hand, are set to provide only relatively low growth, of less than 10 %.
3 Cement producers and plants
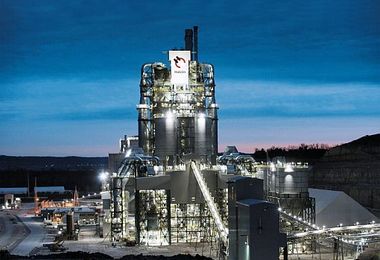
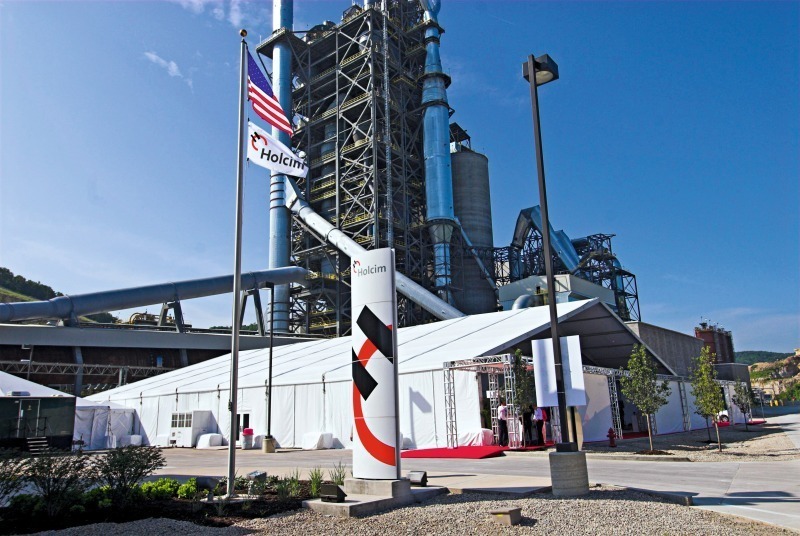
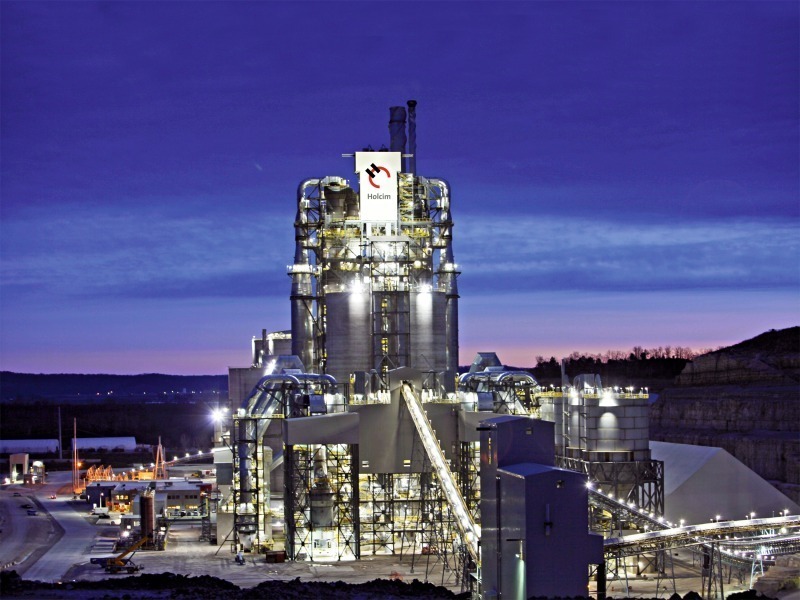
Table 1 shows an overview of the USA‘s TOP 10 cement companies for 2011. Current market leader is Holcim, with a 15.9 % share of cement capacity. The company‘s ten integrated plants and three grinding facilities give it a capacity of 18.6 Mta. Its Ste. Genevieve plant (Figure 7), with a 4.0 Mta cement capacity, was inaugurated in June 2010. No other North American plant operates kilns of this size. Ste. Genevieve‘s kiln line is 40 % more efficient than the wet-process kilns it replaces and achieves specific CO2 emissions up to 25 % lower. The plant also has its own harbour on the Mississippi and is capable of shipping more than 6 Mta of cement and other products. Holcim increased its cement sales by 4.2 % during the first three quarters of 2012.
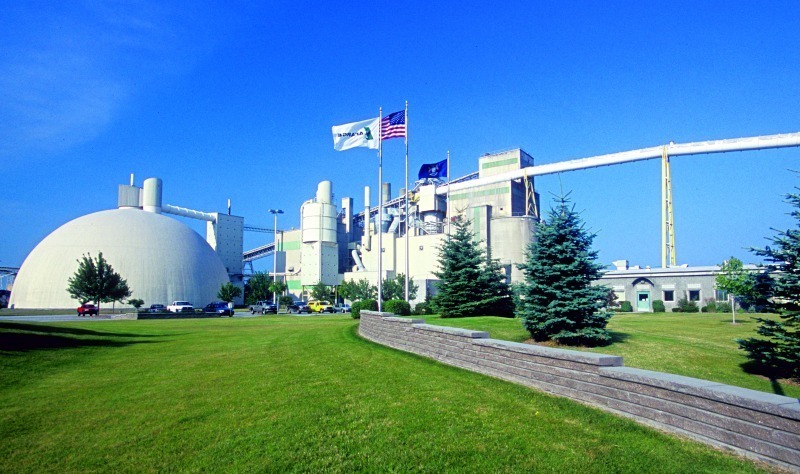
Second place is now occupied by Cemex, with a market share of 14.6 % and a capacity of 17.1 Mta distributed across thirteen integrated plants and five grinding locations. The company has had a presence on the US market, achieved via the acquisition of the Balcones plant, in southern Texas near the border with Mexico, since 1994. Its market share was expanded in 2000 via its acquisition of Southdown Cement. Cemex increased its cement sales in the USA by 16 % in the first nine months of 2012. Third in the ranking is Lafarge (Figure 8) which, until only a few years ago, competed with Holcim for pole position. The Roberta and Harleyville facilities (Figure 9), together with a grinding plant in Atlanta, a total of 3.2 Mta cement production capacity, and also some eighty ready-mixed concrete plants, were sold to the Argos group for 760 million US$ in 2011 [2]. In September 2012, it was reported that two further plants, at Tulsa and Kansas City (Sugar Creek), with a cement capacity totalling 1.6 Mta, along with a whole series of cement terminals, were to be sold to Eagle Materials for 446 million US$.
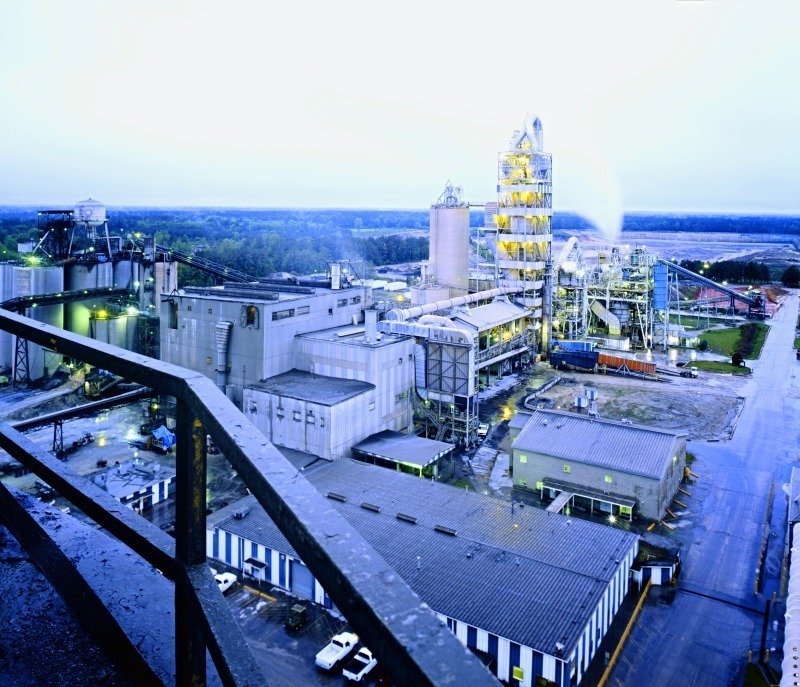
Two further international players, HeidelbergCement (Lehigh Cement) and Buzzi Unicem, rank 4th and 5th. Lehigh was taken over by HeidelbergCement in 1977; the Hanson assets were then added in 2007. The company currently has ten integrated production facilities (Figure 10) and two grinding plants, for a total capacity of 10.7 Mta. Two white Portland cement plants are also operated in the context of a joint venture. HeidelbergCement had increased its cement sales by 11.6 % up to the third quarter of 2012. Buzzi Unicem, with eight integrated plants and one grinding facility, currently achieves a cement capacity of 9.5 Mta. In 2011, the company took over a 30 000 t cement terminal in Illinois which now serves the new 2.4 Mta cement plant completed at Festus, Missouri, in 2009. In the first nine months of 2012, Buzzi Unicem raised its cement sales by 10 % compared to the same period of the previous year.
Ash Grove Cement and Texas Industries, the only two domestic cement groups, follow in the TOP 10 ranking. Ash Grove, placed sixth, opened its first cement plant at Chanute, Kansas, in 1908. The company, with a total of eight cement plants and an overall capacity of 8.7 Mta, is located mainly in the West and Mid-West of the USA, from Washington to Tennessee. It operates on the Mississippi two deep-water import terminals, which have recently enjoyed only low levels of utilisation. Texas Industries currently takes seventh place, and achieves a cement capacity of 5.25 Mta with its three plants (Figure 11). Other TOP 10 placings are Essroc (Italcementi), at 4.7 Mta capacity from six integrated production plants and two grinding facilities, Votorantim, 3.9 Mta from five plants, and Titan Cement, 3.5 Mta from two plants.
Other operational cement companies include Taiheiyo Cement (capacity 3.4 Mta), Argos Cement (3.2 Mta), Eagle Materials (3.1 Mta), Vicat (2.6 Mta, see Figure 12), Giant Cement (2.2 Mta, Grupo Cementos Portland Valderrivas), GCC (1.5 Mta), Mitsubishi Cement (1.4 Mta), Continental Cement (1.1 Mta) and Florida Rock (0.9 Mta). Close on 93.9 Mta (82 %) of cement capacity was thus owned by foreign companies in 2011, and only 21.1 Mta (18 %) by US enterprises. A slight shift in market share toward domestic companies occurred in 2012, with the continued sale of Lafarge assets to US corporation Eagle Materials. This represents the first reversal of a long-established trend, in the context of which foreign companies have acquired increasingly greater shares of the US market.
4 Challenges
The problem is that there is, up to now, no certainty for the cement industry, since the public must still be consulted and agree to the changes. The deadline from which the plants will be required to conform to the regulations thus remains, for the cement companies, 09.092013. In view of the long-term nature of these provisions, the companies in the industry have therefore initially focussed on their plant technology. The majority of companies have, for example, undertaken or commissioned preliminary engineering studies, in order to cost corresponding modifications and/or permit decisions concerning the economic rationality of adapting existing cement kilns for continued operation. The preconditions for these activities differ greatly within the individual companies.
The PCA assumes in its assessment that eighteen cement plants will probably have to close because the necessary investments cannot be economically justified. Such closures would affect 11 Mta, equivalent to 11.2 %, of current clinker production capacity. There is also a risk of closure for three other plants and a further 2.5 Mta of clinker capacity. If implemented in this form, this would result, on the basis of current clinker production of 59.8 Mta, in a capacity utilisation level of 70.8 %. Speculation concerning new plant capacity in the USA would then probably flare up again. A modern 1.4 Mta cement line at TXI‘s Hunter plant, the commissioning of which was originally scheduled for 2010, would be one of the first new facilities.
5 Outlook
Überschrift Bezahlschranke (EN)
tab ZKG KOMBI EN
This is a trial offer for programming testing only. It does not entitle you to a valid subscription and is intended purely for testing purposes. Please do not follow this process.
This is a trial offer for programming testing only. It does not entitle you to a valid subscription and is intended purely for testing purposes. Please do not follow this process.
tab ZKG KOMBI Study test
This is a trial offer for programming testing only. It does not entitle you to a valid subscription and is intended purely for testing purposes. Please do not follow this process.
This is a trial offer for programming testing only. It does not entitle you to a valid subscription and is intended purely for testing purposes. Please do not follow this process.