Lafarge-Holcim’s cement rivals in Africa
 OneStone Consulting
 OneStone Consulting
 OneStone Consulting
 OneStone Consulting
 OneStone Consulting
 OneStone Consulting
 Lafarge
 Dangote
 Dangote
 HeidelbergCement
 HeidelbergCement
 PPC
PPC
 Vicat
Vicat
 OneStone Consulting
 OneStone Consulting
 OneStone Consulting
 OneStone Consulting
 OneStone Consulting
 OneStone Consulting
 Dangote
Once Lafarge-Holcim have merged they will be the leading cement producer in Africa with a capacity of about 53 million tons per year (Mta). However, there are a number of potential rivals, lead by the Dangote Group, which have massive capacity expansion plans in the pipeline. This market review outlines the latest cement industry trends in Africa, contains the latest 2014 market figures and looks at future plans of the major rivals.
1 Introduction
Africa has a population of 1.124 billion, 178 million (15.9 %) live in North Africa and 945 million (84.1 %) in Sub-Saharan Africa (Population Reference Bureau data mid 2014) but 50.6 % of all cement consumed in 2014 was in North Africa. As a result, the cement industry is characterized by a large variance in the per capita cement consumption (PCC) from north to south and also from east to west. While in 2014 the PCC in North Africa was 552 kg, in Sub-Saharan Africa it was just 102 kg. Highest PCC consumption in Sub-Saharan Africa was in Southern and West Africa with a PCC of 138...
1 Introduction
Africa has a population of 1.124 billion, 178 million (15.9 %) live in North Africa and 945 million (84.1 %) in Sub-Saharan Africa (Population Reference Bureau data mid 2014) but 50.6 % of all cement consumed in 2014 was in North Africa. As a result, the cement industry is characterized by a large variance in the per capita cement consumption (PCC) from north to south and also from east to west. While in 2014 the PCC in North Africa was 552 kg, in Sub-Saharan Africa it was just 102 kg. Highest PCC consumption in Sub-Saharan Africa was in Southern and West Africa with a PCC of 138 and 122 kg, respectively and the lowest PCC was in East and Central Africa with 78 and 53 kg.
The African cement capacity at the end of 2014 stood at 262 Mta, of which 129.5 Mta (49.4 %) are located in North Africa and 132.5 Mta (51.6 %) in Sub-Saharan Africa. With 31.4 Mta Lafarge-Holcim has a share of 24.2 % of the North African cement capacity and with 21.6 Mta 16.3 % of the Sub-Saharan cement capacity. Only in Morocco there is an overlapping of Lafarge and Holcim’s cement capacities with 6.8 and 5.2 Mta respectively. In Nigeria, where Lafarge and Holcim both had shares of 28 % in the 2.5 Mta Unicem cement plant, Lafarge purchased the 30 % shares of Flour Mills and now has control of the company.
2 Africa’s regional cement breakdown
In our regional breakdown Africa is split into five regions: North, East, Southern, West and Central. The division of the regions is based on a definition by the African Development Bank, with the exception that Mauritania is assigned in the figures to West Africa, and not to North Africa. Accordingly the North African countries comprise Morocco (incl. West-Sahara), Algeria, Libya, Tunisia and Egypt, which were covered in a market review in 2011 [1]. East Africa stretches from the Horn of Africa and Sudan to the east coast with Tanzania and the Indian Ocean Islands, covering Burundi, the Comores, Djibouti, Eritrea, Ethiopia, Kenya, Rwanda, the Seychelles, Somalia, Sudan, Tanzania and Uganda [2, 3].
Southern Africa consists of twelve countries Angola, Botswana, Lesotho, Madagascar, Malawi, Mauritius, Mozambique, Namibia, South Africa, Swaziland, Zambia and Zimbabwe. West Africa stretches from the Sahel Zone to the west coast of Africa and comprises Benin, Burkina-Faso, Cape Verde Islands, Gambia, Ghana, Guinea, Guinea-Bissau, Ivory Coast, Liberia, Mali, Mauritania, Niger, Nigeria, Senegal, Sierra Leone and Togo. Finally, the Central African sub-region consists of Cameroon, Chad, the Central African Republic, the Republic of Congo, the Democratic Republic of Congo, Gabon, Equatorial Guinea and the Island of Sao Tome and Principe.
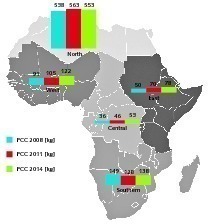
Figure 1 shows the development of the PCC in Africa in 2008, 2011 and 2014. It is interesting to see that in North Africa the PCC stagnates at around 550-560 kg, while in the regions of Sub-Saharan Africa there is significant growth with the exception of Southern Africa, which stagnates at around 140 kg. Largest absolute growth in the PCC was in West Africa, which had an increase in the six years under review from 91 to 122 kg. This corresponds to an increase in the PCC of 31 kg or 34 %. In East Africa the increase to 78 kg corresponds to growth of 28 kg (56 %), while the increase in Central Africa to 47 kg corresponds to growth of 17 kg (47 % increase).
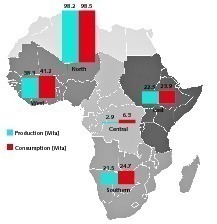
Actual data about the cement production and consumption in the regions is illustrated in Figure 2. Total cement production in Africa was 183.4 Mta in 2014, and 163.2 Mta in 2011, which corresponds to a 4.0 % compound annual growth rate (CAGR). The cement consumption increased from 172.6 Mta in 2011 to 194.6 Mta, which corresponds to a CAGR of 4.4 %. In addition Africa had net imports of 11.2 Mta in 2014, 20 % more than in 2011 when it was 9.4 Mta. North Africa had a 53.5 % share of production with 98.2 Mta, while Sub-Saharan Africa produced 85.2 Mta (46.5 %).
In terms of consumption North Africa consumed a share of 50.6 % with 98.5 Mta and Sub-Saharan Africa 96.1 Mta or 49.4 % .
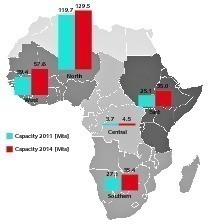
The cement capacity in Africa increased from 215 Mta in 2011 to 262 Mta in 2014 (Fig. 3), which corresponds to a CAGR of 6.8 % or 47 Mta of additional cement capacity in three years which is more than 15 Mta of new capacity per year. The share of North African cement capacity decreased from 55.7 % to 49.4 %, while the Sub-Saharan share increased from 44.3 to 50.6 %, or 132.5 Mta and exceeds the cement capacity of North Africa for the first time. The largest gains were in West Africa, where the capacity was increased from 39.4 Mta to 57.6 Mta, corresponding to a CAGR of 13.5 %. In East Africa the cement capacity increased to 35.0 Mta (CAGR of 11.7 %) and in Southern Africa to 35.4 Mta (CAGR of 9.3 %), while in Central Africa the capacity only increased from 3.7 to 4.5 Mta.
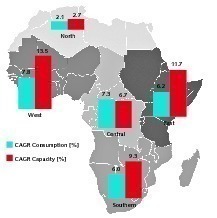
In Figure 4 the CAGR for cement consumption is compared to cement capacity additions, for the period 2011 to 2014. While the average cement consumption growth for Africa was 4.4 %, the capacity growth was 6.8 %. In North Africa the difference in growth rates was lowest with 2.1 and 2.7 %, respectively. The largest difference in the CAGR was in West Africa with 7.8 % growth in consumption and 13.5 % growth in capacity, followed by East Africa with growth of 6.2 % in consumption and 11.7 % in capacity. In Southern Africa the CAGR difference was 6.0 and 9.3 % much smaller, while Central Africa had a higher growth rate in consumption than in capacity. However the actual consumption and capacity figures for Central Africa are quite small, when compared to the other regions.
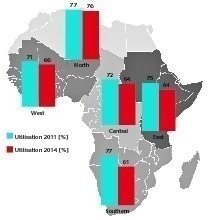
The result of the strong growth in capacity is a significant decline in capacity utilization figures (Fig. 5), with the exception of North Africa, where the decline is only marginal. On an average the capacity utilization declined from 76 % in 2011 to only 70 % in 2014. While the utilization rate in North Africa sank from 77 % to 76 %, in the Sub-Saharan regions the utilization sank significantly from more than 70 % in 2011 to less than 70 % in 2014. The largest shrinkage was in Southern Africa (77 % to 61 %), followed by East Africa (75 % to 64 %) and West Africa (71 % to 66 %). There is no doubt that these developments have a large impact on production margins and furthermore the resulting overcapacity causes a decline in cement prices.
3 Major cement rivals in Africa
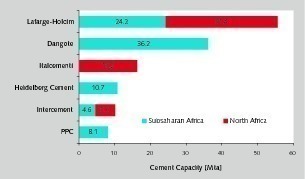
In this overview we have concentrated on the Pan-African cement rivals, i.e. cement companies, which have production facilities in more than one African country. Figure 6 gives an overview of the TOP 5 rivals to Lafarge-Holcim, which comprise Dangote, Italcementi, HeidelbergCement, Intercement and South African PPC. The cement capacity figures indicate that Lafarge-Holcim is very strong in North Africa, where there are only two Pan-African rivals, Italcementi and Intercem, and weaker in Sub-Saharan Africa, where there are four strong rivals Dangote, HeidelbergCement, Intercement and PPC. In total the TOP 6 companies comprise about 41.0 % of the capacity in North Africa and 61.3 % of the cement capacity in Sub-Saharan Africa.
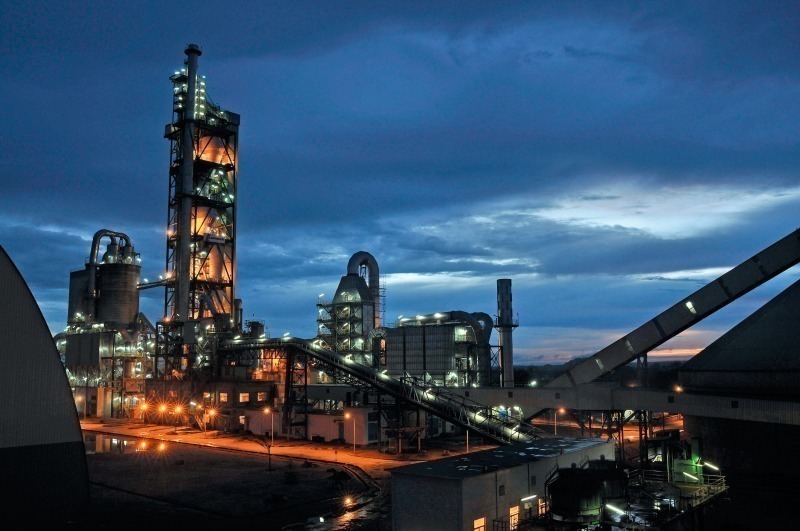
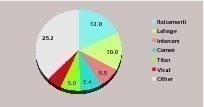
In North Africa Lafarge-Holcim has a presence in Morocco, Egypt and Algeria and in the Sub-Saharan countries in Kenya, Cameroon, Ivory Coast, Zambia (Fig. 7), Uganda, Benin, La Reunion, Guinea, Zimbabwe, Tanzania and Malawi. The major assets are in Morocco (12.0 Mta), Egypt (10 Mta), Algeria (9.4 Mta), Nigeria (8.2 Mta), South Africa (3.6 Mta) and Kenya (2.0 Mta). An expansion strategy has been outlined that will add an additional 10 Mta of cement capacity in Africa within the next four years. About 8.5 Mta will come from large brownfield projects in Nigeria, Tanzania and Zambia, while 1.5 Mta will be the result of removing production bottlenecks in its operations. It is not clear, whether Lafarge-Holcim will continue with plans for a greenfield cement plant in Ethiopia.
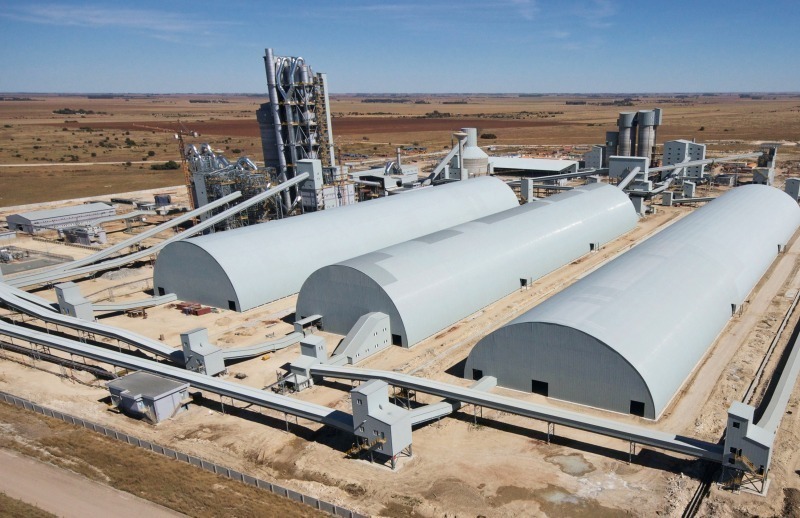
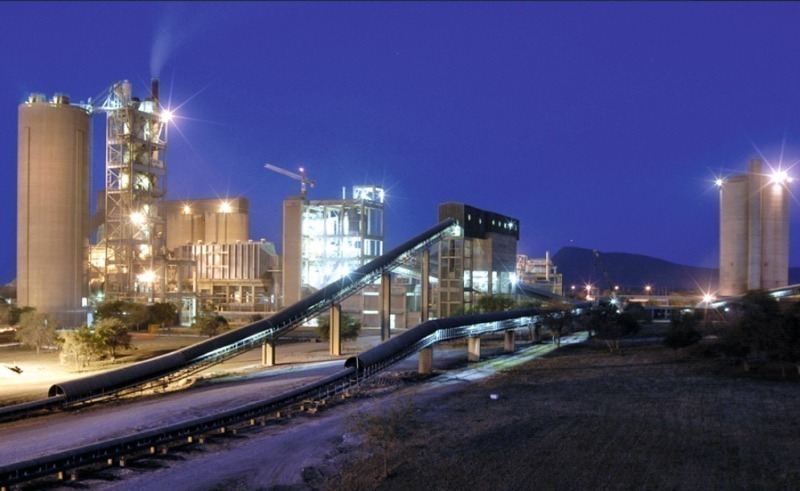
Dangote Cement is the biggest rival to Lafarge-Holcim in Africa. Dangote already has a capacity of 36.2 Mta in the Sub-Saharan countries Nigeria, South Africa (Fig. 7), Senegal, Sierra Leone and Ghana. By the end of 2014 a capacity of 42 Mta was planned, but due to project delays, plants under construction in Ethiopia, Zambia (Fig. 8) and Cameroon will only be operational in the 1Q. 2015/4/. By the end of 2017, Dangote is planning a capacity of 62 Mta, which will be about equal to Lafarge-Holcim. Apart from existing countries by then Dangote will also have operations in Tanzania, Kenya, the Ivory Coast, Liberia, Ghana and the Republic of Congo. In Nigeria the cement capacity will be extended from 29 Mta in 2014 to 38 Mta in 2017, so Nigeria will continue to be the most important country in terms of capacity. The strategy of Dangote in other countries includes greenfield and brownfield plants as well grinding plants.
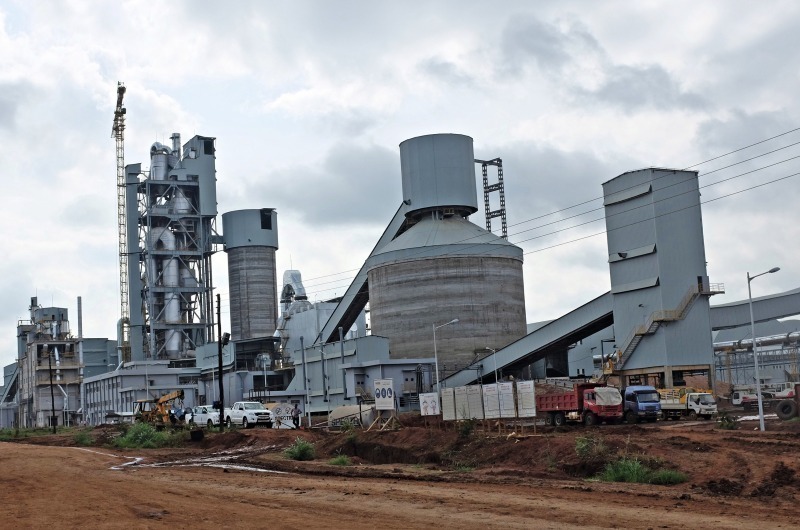
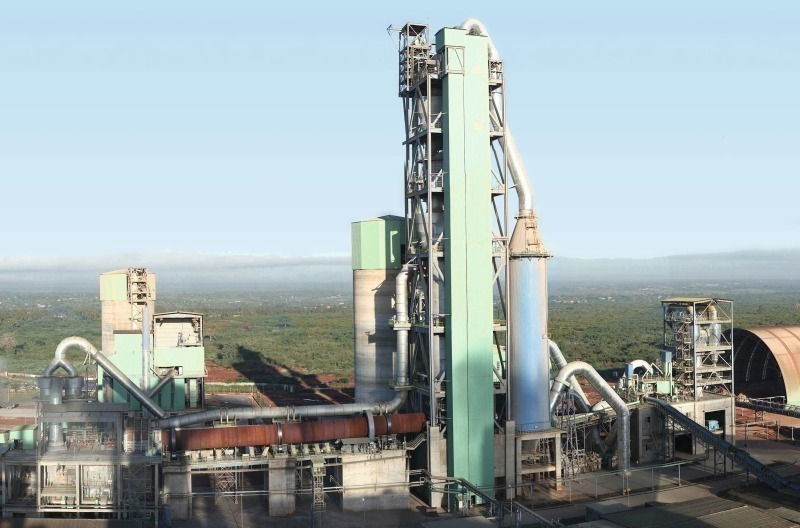
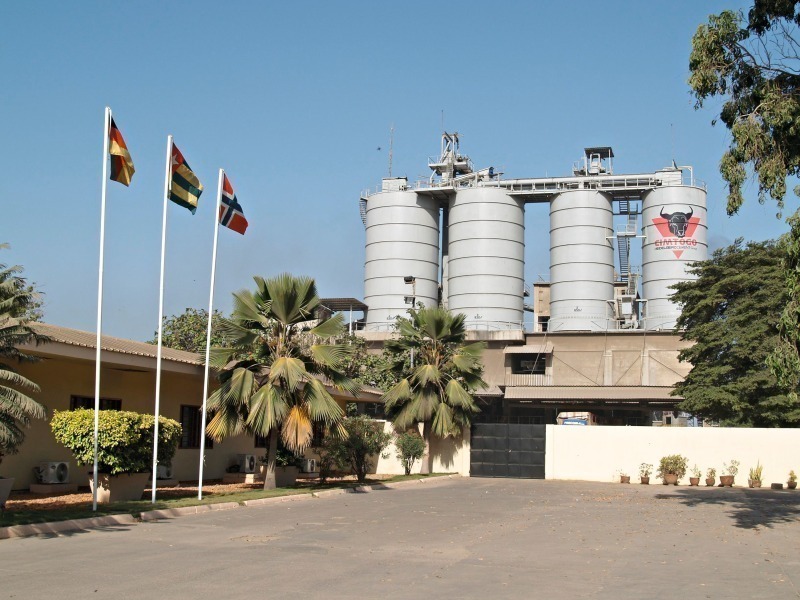
Italcementi has assets in Egypt and Morocco with a combined cement capacity of 16.2 Mta. At the moment the company’s activities in Africa are at a low level with just one new grinding plant planned in Morocco. HeidelbergCement has a footprint in Burkina Faso, Benin, DR Congo, Gabon, Ghana, Liberia, Sierra Leone, Tanzania (Fig. 9) and Togo. At the end of 2014 the cement capacity in these countries was about 10.7 Mta, of which 2.9 Mta became operational in Burkina Faso, Ghana, Liberia, Tanzania and Togo after 2012. The company is investing in greenfield and brownfield expansion projects and has a number of grinding facilities, especially in West Africa (Fig. 10). In Togo a 1.5 Mta clinker production facility will be installed this year to reduce clinker imports in West Africa. HeidelbergCement is the biggest producer in Ghana and Tanzania.
Intercem and PPC are the other two TOP rivals in Africa. The assets of Intercem in Africa include the former assets of Cimpor in Egypt, South Africa and Mozambique and comprise 10.1 Mta of capacity. In addition to the existing capacity a greenfield project is under construction in Angola. PPC has cement production facilities in South Africa (Fig. 11), Botswana, Rwanda and Zimbabwe. Beside Rwanda and Zimbabwe the company has capacity expansions under way in Ethiopia, Algeria and the Democratic Republic Congo. This will increase PPC’s cement capacity by 5.7 Mta. The plants will be commissioned between 2015 and 2017.
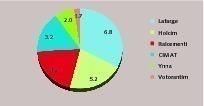
Other major Pan-African cement producers include Afrisam, ARM Cement (formerly Athi River Mining), ASEC, Vicat Cement and Votorantim. Afrisam has an installed base of 5.8 Mta in South Africa and Tanzania (Tanga Cement). In Tanzania a second kiln line is under construction. ARM has cement production facilities in Kenya and Tanzania with a capacity of 2.9 Mta. Another 2.0 Mta capacity is projected to be installed in Kenya.
ASEC operates cement plants in Egypt, Algeria and Sudan with a cement capacity of 6.8 Mta. At the moment there is not much movement in the formerly announced capacity expansion projects. Vicat has a cement capacity of 7.6 Mta from its plants in Egypt, Senegal (Fig. 12) and Mauritania and belongs to the larger cement players in Africa. Votorantim Cimentos owns cement assets in Morocco and Tunisia with a capacity of 3.0 Mta as a result of its exchange of equity interests in Cimpor in 2012.
4 Market shares in major countries
In Morocco Lafarge-Holcim has a combined market share of 51.9 % (Fig. 14) of the existing cement capacity of 23.1 Mta. Accordingly to the local press the Moroccan Prime Minister has already approved the merger of the Moroccan subsidiaries on condition that there will be no job cuts and that the merger is in the interest of both management and employees. However the Lafarge-Holcim capacities are mainly in the Centre, North West and Nord East of the country where there is not much competition. If the merger becomes an issue for the local regulatory authority it can be assumed that there will be potential buyers for divested assets.
There are four other major players in the country of which Italcementi (Ciments du Maroc) and Ciments de l’Atlas (CIMAT) are the largest. At the moment the market suffers from large overcapacities.
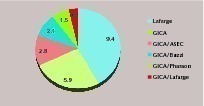
The largest existing cement capacities of the African countries are in Egypt with 66.7 Mta. The market is controlled by six international cement companies, which have a combined market share of more than 62 % (Fig. 15). The market leader Italcementi has a market share of 18.0 %, followed by Lafarge (15.0 %) and Intercem (8.2 %). The local cement producers include Misr Beni Suef, Sinai Cement, Misr-Qena, South Valley and the Military Forces Cement. Algeria has a cement capacity of 22.5 Mta (Fig. 16). The industry is controlled by Lafarge with 9.4 Mta capacity and GICA (Groupe Industriel des Ciments d’Algérie) with 13.1 Mta, of which 5.9 Mta capacity is 100 % owned and 7.2 Mta is from Joint-Ventures with ASEC, Buzzi Unicem, Pharaon Cement and Lafarge. There is a large capacity expansion programme planned by GICA, which will add 7.5 Mta by 2017.
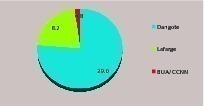
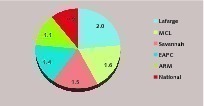
Nigeria has a cement capacity of 38 Mta, which is controlled by two players (Fig. 17). Dangote Cement has a market share of 76.3 % with the newly added 2 x 3 Mta capacity at Ibese and the 3 Mta line at Obajana. Lafarge produces 8.2 Mta with WAPCO Cement, Ashaka and its majority stake in Unicem giving it a market share of 21.6 %. The other producer is BUA/CNCC with the Sokoto and Edo plants. BUA is also constructing a large cement plant which is projected to be operational by 2016. Compared to Nigeria, Kenya’s cement capacity of 8.5 Mta is small. The market leader in Kenya is Lafarge with 23.5 % (Fig. 18). With MCL (Mombasa Cement), Savannah, EAPC (East African Portland Cement Company), ARM and National Cement there are five other producers with market shares between 11 and 19 %.
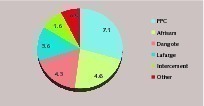
The cement capacity of South Africa stands at 21.7 Mta (Fig. 19). Market leader is PPC with 33 % share of capacity, followed by Afrisam with 21 % and Dangote with 20 %. Dangote/Sephaku Cement is a new player in South Africa, after the commissioning of the Delmas grinding plant and Aganang integrated cement plant last year. Other major cement producers are Lafarge with a market share of 17 % and Intercement. Interestingly although South Africa had a massive overcapacity in the last few years, imports were increasing, to a level of about 1.1 Mta.
5 Outlook
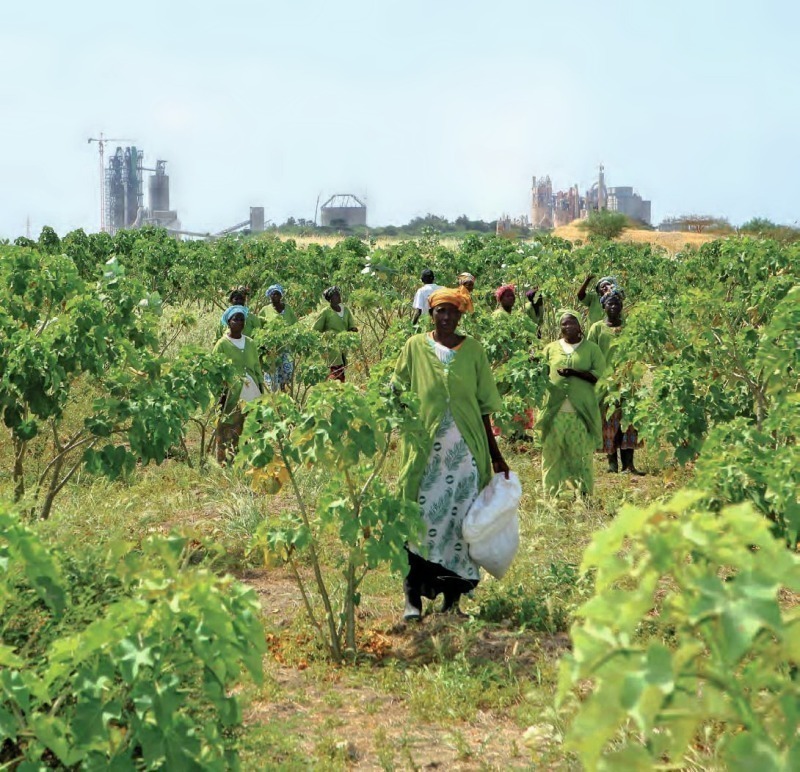
The cement industry in Africa is booming, especially in the Sub-Saharan region, where the low per capita consumption (PCC) is expected to increase significantly. The projections are based on increasing political and economic stability, a steady population growth and increased urbanization, massive infrastructure investments and an emerging middle class and young population with serious housing deficits.
In many projections a cement market growth of 8-12 % per year is taken as the base scenario. However, the real market growth in Sub-Saharan Africa was much lower and more realistic projections are 6-8 % CAGR. As a result the massive capacity expansions of the last few years led to overcapacity issues in many countries and a low capacity utilization rate. With the announced capacity expansion this trend will continue to 2017.
The result of low capacity utilization is more competition, lower cement prices and longer amortization periods for new plants. On the one hand production costs have to be reduced. This is for example possible with higher rates of alternative fuels which has become a trend in East Africa or the reduction of the clinker factor with an increase of slag, fly ash and other pozzolans in cement manufacture, which is a trend in Southern Africa and now swaps over the West and East Africa. Nevertheless older, inefficient capacity will be closed which will have a direct impact on capacity issues. Finally the proposed merger of Afrisam and PCC in South Africa shows that a consolidation of Africa’s cement capacity is on the agenda.
Überschrift Bezahlschranke (EN)
tab ZKG KOMBI EN
This is a trial offer for programming testing only. It does not entitle you to a valid subscription and is intended purely for testing purposes. Please do not follow this process.
This is a trial offer for programming testing only. It does not entitle you to a valid subscription and is intended purely for testing purposes. Please do not follow this process.
tab ZKG KOMBI Study test
This is a trial offer for programming testing only. It does not entitle you to a valid subscription and is intended purely for testing purposes. Please do not follow this process.
This is a trial offer for programming testing only. It does not entitle you to a valid subscription and is intended purely for testing purposes. Please do not follow this process.