The application of chemometrics to
cementitious tile adhesive formulations


Chemometrics is the chemical discipline that applies mathematical and statistical methods to optimize experimental designs and to maximize the quality of the information obtainable from chemical data through multivariant statistical analysis. This paper will examine the application of chemometrics to cementitious tile adhesive formulations. The definition of a proper experimental design will be finalized by the implementation of a mathematical model of physical-mechanical behaviour patterns of cementitious tile adhesives, both from the point of view of ISO 13007 testing and from that of their fresh-state properties. Multivariant statistical analysis will also be employed to identify possible correlations between the mechanical and rheological properties of cementitious tile adhesives.
1 Introduction
1.1 Cementitious tile adhesive formulations
Tile adhesive formulations are usually developed as a compromise between many objectives, such as:
1) Fulfilling minimum classification requirements in accordance with certain standards
2) Maximizing a certain subset of performance characteristics
3) Improving certain fresh-state application properties
4) Minimizing formulation costs
Furthermore, the problem of finding the best possible formulation for a certain combination of properties at a given cost is generally subject to some constraints, such as the availability of raw...
1 Introduction
1.1 Cementitious tile adhesive formulations
Tile adhesive formulations are usually developed as a compromise between many objectives, such as:
1) Fulfilling minimum classification requirements in accordance with certain standards
2) Maximizing a certain subset of performance characteristics
3) Improving certain fresh-state application properties
4) Minimizing formulation costs
Furthermore, the problem of finding the best possible formulation for a certain combination of properties at a given cost is generally subject to some constraints, such as the availability of raw materials, i.e. formulations should be adapted to locally available sand and cement as these raw materials should not travel more than 300 – 400 km due to the impact of transport costs.
The compromise between objectives and constraints in formulation development is usually driven by experience and by the results of a large number of experiments. In most cases this is carried out following a univariant analysis: all possible formulation parameters, i.e the types of components and their quantities, are varied one by one and the experimental results are compared on a one-to-one basis. This often underestimates the effects of test variability due to experimental error and variation in raw materials.
1.2 Chemometrics – experimental design
Formulation development can greatly benefit from Experimental Design [1], which enables the amount of available resources to be optimized while carrying out an experimental plan. This makes it possible to predict the accuracy of the results of the final model before starting any group of tests, with a determination of model accuracy at every point during the investigation.
All the experiments described in this paper are based on Full- or Fractional-Factorial Designs (that make it possible to obtain a linear-response model). These were developed with the addition of Central Composite Designs, which are indispensable for generating curve responses in mathematical modelling.
In practice, three different composition levels were set for each variable investigated:
-1 level = minimum level
0 level = average level
+1 level = maximum level
The resulting experimental plan, described in detail below, is a rational combination of these levels for each variable. This provides a full examination of the multi-dimensional space determined by the total number of components investigated.
Table 1 shows an example of Experimental Design: a 3-factor Full-Factorial Design with the addition of Central Composite Design.
Such an experimental design makes it possible to evaluate the model response as given by the following equation:
Response = a + b · V1 + c · V2 + d · V3 + e · V1V2 + f · V1V3 + g · V2V3 + h · V12 + i · V22 + j · V32
Fractional-Factorial Designs [1] have the same characteristics as Full-Factorials but reduce the number of experiments required in accordance with the multidimensional space vertexes. This operation can be conveniently used for designs with 5 or more variables because, in these cases, the use of this procedure does not generate any confusion among the calculated coefficients (constant, linear, interaction and quadratic). Using this approach with a reduced number of variables can, however, generate confusing effects among interaction coefficients.
For this reason, a fractional factorial design has been used in the present work with a model generated for five variables.
1.3 Chemometrics – Principal component analysis
Principal component analysis (PCA) [2] is a statistical procedure, invented in 1901 by Karl Pearson, that uses an orthogonal transformation to convert a set of observations of possibly correlated variables into a set of values of linearly uncorrelated variables called principal components. This transformation is defined in such a way that the first principal component has the largest possible variance and each succeeding component in turn has the highest variance possible under the constraint that it is orthogonal to the preceding components. The resulting vectors are an uncorrelated orthogonal basis set.
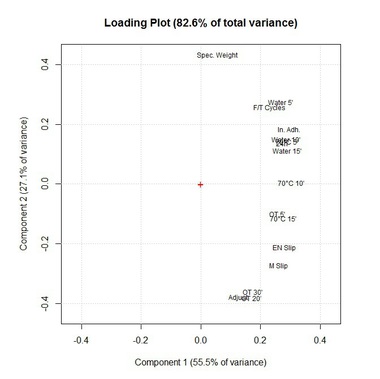
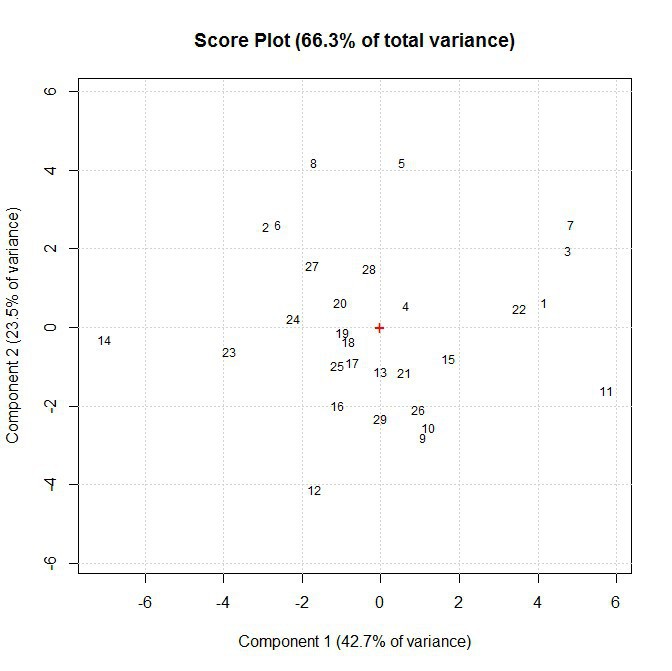
The results of a PCA are usually displayed in terms of component scores (the transformed variable values corresponding to a particular data point) and loadings (the weight by which each standardized original variable should be multiplied to obtain the component score), as showed in Figure 1.
In practice, the loading plot represents the correlations between the variables investigated: close positions indicate strongly correlated variables while remote positions relative to the graph centre (the red cross corresponding to the [0; 0] coordinates) indicate negative correlations and perpendicular variables are considered to be uncorrelated.
In contrast, the, score plot indicates the position of each single experiment in the same reference graph as the loadings, indicating that tests located close to the position of certain variables have higher values of these same variables and, by the same logic, experiments remote from certain variables will have lower values of these variables.
With this powerful mathematical instrument, it is possible to identify clearly any correlation between different tests. Furthermore, by combining this information with experiments obtained from a rational Experimental Design, it will be possible to correlate formulation variables (input values in Design) to test results (output variables, elaborated using Principal Components Analysis).
2 Materials
Several components of typical tile adhesive formulations were analyzed in this work:
1) Ordinary Portland cement (CEM I 52.5R GREY, 20 % - 40 %)
2) Cellulose ether (0.25 % - 0.45 %)
3) Modifications in cellulose ether (non-modified and highly modified)
4) Redispersible polymeric powder (0 % - 10 %)
5) Fine calcium carbonate (< 100 µm, 0 % - 20 %)
The rest of the formulation is made up of silica sand with a standard particle size distribution of 100 – 400 µm.
3 Experimental methods
3.1 Evaluation of the properties of cementitious tile adhesives
The properties of the fresh formulation mixes were evaluated in terms of Brookfield viscosities and for all the formulae the mixing water was selected to give a viscosity of the wet mortar of around 500 000 mPa∙s. The density, adjustability time and slip resistance were then evaluated.
The open time, initial adhesion, adhesion after 70°C ageing, adhesion after water immersion and adhesion after freeze-thaw cycles in accordance with EN 12004 [3] were evaluated for each formulation. The deformability of each formulation, also in accordance with EN 12004, was also measured.
3.2 Data analysis software
CAT (Chemometric Agile Tool) [4], an R-language-based free chemometrics software distributed by the Italian Chemometrics Group, has been used for multivariant data analysis, and its Principal Components Analysis has also been widely used. A second software, BasiCAT [5], developed using Microsoft Excel and Microsoft Visual Basic at Mapei laboratories and available under free licence, has been employed to define the proper Design of Experiment, to obtain all the equation coefficients necessary to describe the behaviour of adhesives over the whole sector investigated and to obtain a graphical evaluation of the results obtained, providing an intuitive description by means of:
1) A fully rotatable tri-dimensional graph, representing one of the chosen responses as a function of two variables
2) A bi-dimensional graph, with a plain representation of the response curves obtained through the mathematical equation
3) The option of animation of the graphs for visual investigation of the behaviour of the desired response as a function of a third variable
4) Simultaneous calculation of all the responses investigated as a function of up to eight input composition variables
4 Experimental model and raw results
The construction of a model that could describe some unexpected behaviour patterns in cementitious tile adhesives after heat aging (spontaneous detachment after 10 and/or 15 minutes application) was chosen as a first possible application of Experimental Design to cementitious tile adhesive formulations. The selected design is a Fractional-Factorial with Central Composite Design model dedicated to the understanding of this phenomenon. The formulation variables included are:
1) Ordinary Portland cement (20 % - 35 %)
2) Cellulose ether (0.25 % - 0.45 %)
3) Modifications in cellulose ether (non-modified, highly modified and a 50/50 mixture of the two)
4) Redispersible polymeric powder (0 % - 5 %)
5) Fine calcium carbonate (0 % - 20 %)
The experimental plan is shown in Table 2 while its raw results are summarized in Table 3.
5 Experimental results
5.1 Correlations in tile adhesives testing
Using the Principal Component Analysis technique and the Experimental Design results, it is possible to evaluate the correlations between the whole performance profiles of cementitious tile adhesives, giving the graphs shown in Figure 2 and Figure 3.
Multivariant analysis highlights the correlations between the tests:
1) 24-hour pull-off, initial adhesion, water immersion, freeze-thaw cycles and pull-off after heat are strictly correlated and they are all related to the amount of cement in the formulation and to the density of the adhesive. In particular, this last parameter seems to be inversely correlated to the amount of cellulose ether in the formulations
2) Open time at 20’, open time at 30’, adjustability and slippage are strictly correlated and they are all related to the cellulose ether content
3) The polymer generally improves all aspects of the performances, with a lesser effect on water immersion and freeze-thaw cycles and a very important contribution to the heat, initial adhesion and deformability results
4) Cellulose ether modification only improves the slip test (and naturally has better results when this is low) but strongly penalizes all the other results
5) Pull-off after water immersion and, to a greater extent, after heat becomes increasingly dependent on the cellulose ether when the set time of the tiles is increased. 5’ is close to cement sector of the graph, 10 minutes moves to an intermediate area and 15’ falls closer to the cellulose ether area
6) The water mix ratio is totally uncorrelated to the pull-off results
5.2 Heat behaviour of cementitious tile adhesives
As observed many times during past experimental campaigns, heat aging can be a very critical test for cementitious tile adhesives, especially if this test is combined with open time. All the experimental pull-off tests in this work were carried out after 5, 10 and 15 minutes from the spreading of the adhesive.
Many factors were found to have a strong influence on the performance of the adhesives:
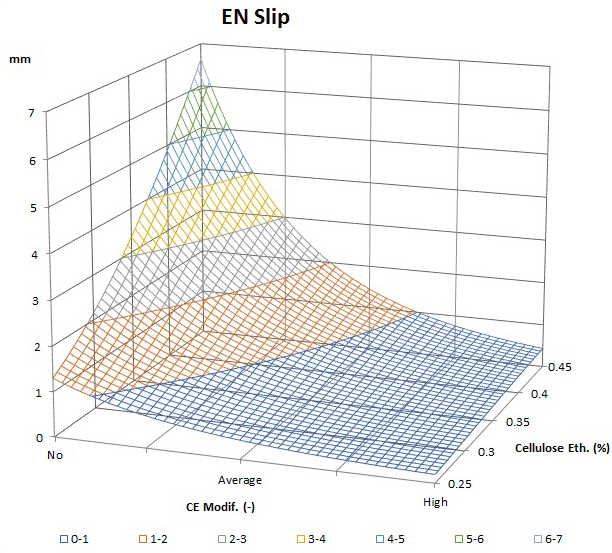
1) Cellulose ether modifications always had a negative effect in the heat aging tests, as shown by Figure 4
2) The amounts of cement and polymer are fundamental, as they produce a strong increase in performance
3) Figure 5 shows that at 10’ and, even more, at 15’ the amount of cellulose ether improves the overall performance in this test, guaranteeing good wettability of tiles but an excess of cement can reduce the results
4) Fillers improve the overall performance of the adhesives in heat aging at 5’ but excessive amounts (> 7 % - 10 %) have a strongly negative effect on the results obtained as the waiting time increases, which provides an accurate description of the detachment phenomena observed in the past. This behaviour is well described by Figure 6
5.3 Slip resistance of cementitious tile adhesives
The slippage of cementitious tile adhesives is mainly influenced by the amount of cellulose ether and its modification, with very similar behaviour patterns for adhesives with and without polymer (in Figure 7 with 0 % and 2.5 % polymer).
It can also be deduced that the amount of cement and filler has an almost negligible effect in this test, while a large amount of polymer (> 4 %) can result in an increase in slippage even in the highly modified system, where it becomes necessary to reduce the total amount of cellulose ether in order to respect the “T” classification of adhesives (slippage < 0.5 mm).
5.4 Open time of tile adhesives
Open time [3] is one of the most important characteristics of a cementitious tile adhesive. It is defined as the time that elapses between the spreading of the adhesive mortar and the application of the tiles. Open time pull-off resistance at 5 minutes is strongly dependent on the amount of cement and polymer but the open time tensile resistance after 20 and, even more, after 30 minutes, is clearly affected by other factors. The amount of cellulose ether is fundamental for guaranteeing the overall performance, while the filler content, cement content and CE modification can significantly compromise the overall performance of the open time of a tile adhesive. Figure 8 and Figure 9 clearly demonstrate these behaviour patterns.
6 Conclusions
Chemometrics have been shown to have the ability to greatly improve the knowledge generated by experimentation. This is because the definitions of rational Experimental Designs and the multivariant analysis approach can provide a wide-ranging amount of information that is usually lost when evaluating tests at single points.
This discipline, applied to cement-based product science, also has demonstrated its extreme flexibility and adaptability to any kind of experimentation and its perfect applicability in formulation science, clearly surpassing the classical univariant approach. The example in this paper clearly shows the correlations between formulation parameters and experimental outcomes, thereby demonstrating how effective this methodology can be in helping in the design of formulations.
Many further studies can be carried using these techniques, especially with respect to the fresh properties of tile adhesives and the attempt to link rheological properties to workability during the use of cementitious materials.
//www.mapei.com" target="_blank" >www.mapei.com:www.mapei.com
Überschrift Bezahlschranke (EN)
tab ZKG KOMBI EN
This is a trial offer for programming testing only. It does not entitle you to a valid subscription and is intended purely for testing purposes. Please do not follow this process.
This is a trial offer for programming testing only. It does not entitle you to a valid subscription and is intended purely for testing purposes. Please do not follow this process.
tab ZKG KOMBI Study test
This is a trial offer for programming testing only. It does not entitle you to a valid subscription and is intended purely for testing purposes. Please do not follow this process.
This is a trial offer for programming testing only. It does not entitle you to a valid subscription and is intended purely for testing purposes. Please do not follow this process.