Influence of cement quality in
cementitious tile adhesive formulations


The quality of the raw materials is one of the most influential factors when formulating cementitious mortars, as it can strongly affect the predictability of the performance of finished products. In particular, the quality and class of the Portland cement used in the formulation has a strong influence on the properties of adhesive tile products.
Experiments have been designed to define the dependence of the performance of tile adhesives on the Portland cement quality and the results will be analyzed in this paper. This will make it possible to implement a model for correlating the performance of the finished products with easily measurable cement properties that were selected with the help of multivariate statistical analysis.
1 Introduction
Cementitious tile adhesives are relatively cheap construction materials. The influence of transport costs on their final price has forced global dry-mix mortar producers to build a great many plants in which local raw materials are used in the production. Keeping a constant product quality in spite of the variability of the Portland cement and of the inert materials is therefore the most important objective when transferring production formulae to new production plants.
The implementation of a generalized model that is able to describe the behaviour of finished products as a...
1 Introduction
Cementitious tile adhesives are relatively cheap construction materials. The influence of transport costs on their final price has forced global dry-mix mortar producers to build a great many plants in which local raw materials are used in the production. Keeping a constant product quality in spite of the variability of the Portland cement and of the inert materials is therefore the most important objective when transferring production formulae to new production plants.
The implementation of a generalized model that is able to describe the behaviour of finished products as a function of the raw material characteristics could be an affordable and helpful solution for minimizing the number of tests needed for each formula transfer. Chemometric techniques, like Multivariate Analysis and Design of Experiment [1], that have already been tested in a previous work were applied to achieve this result.
2 Materials
2.1 Cementitious tile adhesives
Several models have already been evaluated in the past [2,3] and the most efficient data modelling for cementitious tile adhesives was found to be a quadratic model with interactive factors [4]. The formulation variables of interest in this work, with their levels, are as follows:
1) Ordinary Portland cement
(quantity: 20 % – 30 % – 40 %)
2) Cellulose ether (quantity:
0.25 % – 0.4 % – 0.55 %)
3) Cellulose ether modification (unmodified –
average modification – highly modified)
4) Vinavil redispersible polymer (0 % – 3 % – 6 %)
5) Calcium formate, as a setting and early strength accelerator (0.2 % – 0.6 % – 1 %)
6) Types of ordinary Portland cement:
a. CEM II/B-LL 32,5R Grey (Italy)
b. CEM II/A-L 42,5R Grey (Italy)
c. CEM I 52,5R Grey (Italy)
d. CEM I 42,5R Grey (Turkey)
e. CEM I 52,5R Grey (Germany)
f. CEM I 52,5N White (France)
g. CEM II 52,5R Grey (France)
Only pure clinker or carbonate-blended cements were used in this work in order to avoid any pozzolanic reaction due to the presence of slag, metakaolin or fly ash that would significantly modify the overall cement performance, especially after water immersion.
2.2 Chemometric software
CAT, the Chemometric Agile Tool software (distributed by the Italian Chemometrics Group) [5], has been used for multivariate analysis and definition of experiments with its D-Optimal Design feature. The freely downloadable software BasiCAT [6], developed at the Mapei laboratories, has been used for the definition of Experimental Design, calculation of model coefficients and the intuitive graphical representation of the results obtained. These are described by 3-dimensional graphs and allow every product property to be predicted as a function of the desired composition input variables.
3 Preliminary testing
The first fundamental step of this work has been the definition of a quantitative variable that is able to differentiate between the behaviour patterns of different Portland cements. This is necessary because labelling them with their names would not be helpful when formulating with totally new raw materials; the EN 196 [7] classes could be too generic to define an accurate model. All the available cements have therefore been analyzed with several techniques, with the aim of correlating their composition, granulometry and mechanical properties with their behaviour in a “standard” cementitious tile adhesive formulation.
The following analyses were carried out on each cement:
X-ray diffraction (XRD)
Thermo-gravimetric analysis (TGA)
Laser granulometry
Elemental analysis through X-ray fluorescence (XRF)
Compressive and flexural strength after 1,
2 and 28 days (EN 196-1) [7]
Pull-off resistance after 24 hours and after
water immersion (EN 12004) [8]
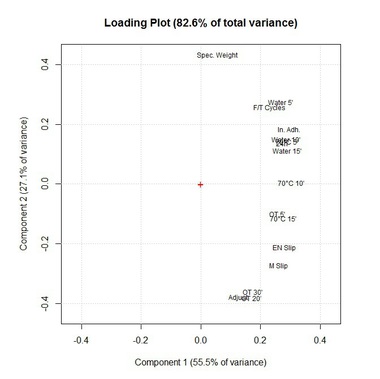
The results obtained are summarized in Table 1. As already proved in a previous work, the best way to analyze a significant quantity of data is Principal Component Analysis, a multivariate analysis tool that can clearly identify, in a very intuitive and graphic manner, the correlations between the different results.
As highlighted by the graph in Figure 1, the pull-off results (both after water immersion and after 24 hours under standard conditions) are:
Strongly correlated with all the mechanical properties of cements (flexural and compressive resistances) and with the residue at 975 °C (indicator of clinker pureness)
Inversely correlated with the particle size of the cement (finer cements perform better than coarse ones) and with the amount of calcite pres-ent in the cement (and generally with all those components that are not pure clinker phases)
Uncorrelated (orthogonal) with the cement setting time and with the amount of sulfate that is normally used to regulate this parameter
These considerations have then been used to decide which cement property should be taken as a “quality parameter” to be set as an input variable for the desired predictive model. Overall, the most easily obtainable characterization parameters are the compressive strengths of cements. These are checked regularly by every production plant quality control laboratory in order to evaluate the incoming raw materials. The correlations between these mechanical parameters and the performance (after water immersion) of cementitious tile adhesives formulated with each cement are described in Table 2.
The 24- and 48-hour strengths both showed strong correlations with the finished product behaviour after water immersion but, as the compressive strength after 48 hours (shown in Figure 2) is a mandatory cement classification test in accordance with EN 196-1, this parameter was finally chosen as the “cement quality” parameter for all further tests.
In order to proceed with the definition of the experimental plan, the 48-hour compressive strength values have been normalized between -1 and 1 for each cement, as shown in Table 3.
4 Experimental model and raw results
The total quantity of possible experiments generated by the 6 input variables (5 with 3 levels and one with 7) is equal to 35·7 = 1701. When working with six independent formulation variables the model used (quadratic with interactions) can be described by this equation:
Response = a0 + a1 · V1 + a2 · V2 + a3 · V3 + a4 · V4 + a5 · V5 + a6 · V6 + a12 · V1 · V2 + a13 · V1 · V3 + a14 · V1 · V4 + a15 · V1 · V5 + a16 · V1 · V6 + a23 · V2 · V3 + a24 · V2 · V4 + a25 · V2 · V5 + a26 · V2 · V6 + a34 · V3 · V4 + a35 · V3 · V5 + a36 · V3 · V6 + a45 · V4 · V5 + a46 · V4 · V6 + a56 · V5 · V6 + a11 · V21 + a22 · V22 + a33 · V23 + a44 · V24 + a55 · V25 + a66 · V26
This equation includes 28 different coefficients (aij) and therefore needs at least 28 experiments to be calculated. Around 40 experiments could be dedicated to this project so all the possible 1701 experimental combinations have been inserted in the D-Optimal Design [9] tool of the CAT software.
The output from the D-Optimal design tool consists of two graphs, one indicating the amount of information described by the model and the other showing the maximum inflation factor (confusion index between the coefficients) of the model. The first parameter must be maximized while the second one should be minimized, with a maximum acceptable value of 8. Good results can be predicted at values under 4 and optimum ones under 2. According to these graphs (Figure 3), a valid solution could be to work with 34 experiments that will be verified with 4 further experiments in a second phase.
The optimization software therefore chose the experimental points summarized in Table 4 to generate the desired quadratic model and the four best verification points, which are used to validate the accuracy of the model.
After the validation phase, the four supplementary experiments have been implemented in the model itself, with the aim of increasing its overall precision. It should be noticed that only 3 cements have been used for construction of the model (those with maximum, minimum and average strengths) while all the other cements were tested during the verification phase, thereby validating the model for each type of cement.
5 Experimental results
5.1 Tests implemented (model output responses)
The fresh properties (water mix ratio required to reach a specified viscosity of around 500 Pa·s, specific weight, adjustability, wetting capability, tile slip resistance), and mechanical properties (open time, pull-off after 24 hours, 28 days, after heat, water immersion, freeze/thaw cycles and deformability, all in accordance with EN 12004) of the finished product were tested for each formulation. All the results obtained are summarized in Table 5.
5.2 Correlations found when testing
the tile adhesives
Using the Principal Component Analysis technique it is possible to evaluate the correlations between the complete performance profiles of cementitious tile adhesives, giving the correlations showed in Figure 4. These are all in accordance with a previous work [2, 3].
In detail, the multivariate analysis highlights the correlations between tests:
1) 24-hour pull-off, water immersion, freeze-thaw cycles and deformability load are strictly correlated and they all are related to the quantity and quality of the cement. This is consistent with the observations taken during the preliminary experimental phase
2) Open time at 20 and 30 minutes, adjustability and slippage are strongly correlated and are all related to the cellulose ether content. Deformability also shows a relationship with the amount of cellulose ether
3) The polymer produces a significant improvement in all the results related to cellulose ether, as well as in the open time at 5 minutes, heat resistance and initial adhesion. The lack of correlation between the polymer position and the cement “group” indicates that the performance of adhesives after water immersion, after 24 hours and after freeze-thaw cycles is basically independent of the amount of polymer present in the formulation
4) The pull-off strength after heat becomes more and more dependent on cellulose ether when the set time of the tiles is increased. This is because the value after 5 minutes lies close to the cement area of the graph, after 10 minutes it moves to an intermediate area and after 15 minutes it falls closer to the cellulose ether area
5) The water mix ratio is totally uncorrelated with pull-off results as it has been adjusted to provide a constant viscosity
5.3 Influence of cement quality on the performance of cementitious tile adhesives
The model can describe many features of cementitious tile adhesives as it takes into account many formulation parameters that can strongly influence the behaviour of the finished products. The focus of this work will be the study of the influence of cement quality in the different types of test.
As a first step, it is possible to identify those tests in which the final result is basically unaffected by the cement quality. These are:
Water mix ratio (dominated by the amounts of cellulose ether and cement, Figure 5)
Specific weight (once again dominated by the amounts of cellulose ether and cement)
Slippage (strongly related to the amount and modification of the cellulose ether, Figure 5)
Wetting capabilities (related to the amounts of cellulose ether and cement)
Far greater dependence on the “cement quality” can be observed in all the remaining performance tests conducted on cementitious tile adhesives. Some of them are strongly dependent on the cement quality only in the case of low-polymer formulations, while others are always significantly affected by this parameter in every formulation.
5.3.1 Adjustability
The product adjustability time (the latest time at which it is possible to adjust the position of a tile before it sticks to the substrate) (Figure 6) is always significantly reduced by the reactivity of the cement, which is directly related to its compressive strength after 48 hours.
5.3.2 24-hour pull-off
The 24-hour performance (Figure 6) of a cementitious tile adhesive is always heavily dependent on the cement quality since the polymer contribution is still low under reduced hydration conditions. The better the cement the higher will be the 24-hour pull-off. Calcium formate (set and early strength accelerator) also has a significant and logical effect.
5.3.3 Open time
Where there are large amounts of polymer the open time performance (Figure 7) of a cementitious tile adhesive is almost unaffected by the cement quality parameter but in the case of low polymer concentrations a high-performance cement can significantly improve these results, especially at 5 and 20 minutes. The 30 minute results are practically independent of the cement quality and are only related to the ratio of cement to cellulose ether.
5.3.4 Pull-off after heat
The PCA analysis shows that the pull-off results after 70°C (Figure 8) are strongly related to the amount of polymer present in the formulation although the influence of the amount and quality of the cement cannot be neglected. The model indicates that the increase in the amount of cement is only effective in this test in the presence of good quality cement and vice versa, highlighting a strong synergy effect between the amount of cement and its quality, as explained by the following graphs.
5.3.5 Pull-off after water immersion
PCA analysis indicates that pull-off after water immersion (Figure 9) is independent of the amount of polymer in the formulation, as they are orthogonal in the loadings plot. This behaviour is confirmed by the model, as the results with or without polymer appear basically identical. As in the case of heat ageing, the model shows a strong synergy between the amount and the quality of the cement; the water immersion pull-off can only be enhanced by increasing the amount of cement if the cement has good 48 hour compressive strength results.
5.3.6 Initial adhesion
The initial adhesion test (Figure 10) shows many similarities to the 70°C test, as confirmed by their relative positions (practically coincident) in the PCA graph. In every case the model shows a reduced synergic effect between the quantity and the amount of the cement. It is always possible to enhance these results by increasing the amount of cement, even in the presence of low quality cements.
5.3.7 Pull-off after freeze-thaw cycles
The behaviour of cementitious tile adhesives during freeze-thaw cycles (Figure 10) is basically identical to the behaviour with water immersion but always with a tendency to higher values, since in this test the tiles are back-buttered before their application and the pull-off is carried out when the slab has already dried.
5.3.8 Deformability test
The deformability test (Figure 11) is considerably influenced by many parameters of the formulation (cement quantity, polymer, fibres, cellulose ether) and the model shows clearly how the cement quality can modify this test result. Paradoxically, an increase in the quality of the cement significantly reduces the product deformability accompanied by a slight increase in the maximum load obtained during the testing phase.
6 Conclusions
The attempt to quantify the cement quality with an easily measurable mechanical parameter has been successful, making it possible to develop a model that can predict the behaviour of cementitious tile adhesives efficiently on the basis of their main formulation variables.
Cement quality has proved to be a determining factor in the formulation of mortars that do not contain polymer, where the use of low quality cements means that the minimum requirement for a C1 classification can never be achieved by simply increasing the amount of cement in the formulation. The same consideration can be extended to C2 adhesives after water immersion, as 1 N/mm² cannot be easily obtained by regulating the amount of cement when working with low-reactivity cements.
Finally, high quality cements are detrimental to the deformability of cementitious tile adhesives although these cements are fundamental to achieving high mechanical results in all the other ISO 13007 classification tests.
//www.mapei.com" target="_blank" >www.mapei.com:www.mapei.com
Überschrift Bezahlschranke (EN)
tab ZKG KOMBI EN
This is a trial offer for programming testing only. It does not entitle you to a valid subscription and is intended purely for testing purposes. Please do not follow this process.
This is a trial offer for programming testing only. It does not entitle you to a valid subscription and is intended purely for testing purposes. Please do not follow this process.
tab ZKG KOMBI Study test
This is a trial offer for programming testing only. It does not entitle you to a valid subscription and is intended purely for testing purposes. Please do not follow this process.
This is a trial offer for programming testing only. It does not entitle you to a valid subscription and is intended purely for testing purposes. Please do not follow this process.