Focus on the Sub-Saharan cement industry
Summary
The average per capita cement consumption in the region of Sub-Saharan Africa is 82 kg, far lower than that of North Africa, which has an average of 538 kg. However, this is also the reason for great optimism as regards future cement industry development in the region. This report provides an insight into die Sub-Saharan region and shows how its cement industry has developed in recent years, what cement production trends can be expected and what role cement imports play in supplying the population. Furthermore, an overview of the most important cement producers and their expansion projects is provided.
Africa has almost one billion inhabitants. Only about 16 %, mainly Arabs and Berbers, live in the 6 North African countries and about 84 % in the 47 countries of Africa that are referred to as the Sub-Sahara. On the other hand, 63.5 % of the African cement output of 133.2 million tonnes per year (Mta) in 2008 was produced in North Africa and only 36.5 %, i. e. somewhat more than ⅓, in the Sub-Saharan region. The situation is similar in the case of cement consumption. This region consumes around 65.9 Mta or 43.7 % of the total figure of 150.8 Mta. In the case of imports, the...
Africa has almost one billion inhabitants. Only about 16 %, mainly Arabs and Berbers, live in the 6 North African countries and about 84 % in the 47 countries of Africa that are referred to as the Sub-Sahara. On the other hand, 63.5 % of the African cement output of 133.2 million tonnes per year (Mta) in 2008 was produced in North Africa and only 36.5 %, i. e. somewhat more than ⅓, in the Sub-Saharan region. The situation is similar in the case of cement consumption. This region consumes around 65.9 Mta or 43.7 % of the total figure of 150.8 Mta. In the case of imports, the area accounts for 91 % of 24.5 Mta and in the case of exports 61.8 % of 6.5 Mta. Correspondingly,
Sub-Saharan Africa has an average per capita cement consumption of only 82 kg (2008) in comparison to North Africa with its 538 kg. With regard to the expansion of cement production capacities, the region has up to now been largely neglected in comparison to North Africa. Only a small number of the region‘s cement plants meet the latest technological standards.
There appear to be a number of reasons for this situation. One important aspect is economic development: in North Africa this is largely dependent on the oil and gas industry, while Sub-Saharan Africa has hitherto mainly profited from its mining industry and agriculture. The global economic crisis has demonstrated the vulnerability of Africa‘s economy, because in recent years even the average growth of 5.3 % failed to produce a substantial reduction of the continent‘s poverty problem. In countries like Burundi or Liberia over 80 % of the population have to exist on less than 1 US$ per day. The chances of adequate education and health care are correspondingly low, which is not least demonstrated by the spread of HIV. According to the WHO, 2.2 million people die every year of AIDS in Africa alone. Experts also fear that the climate change problem will have a severe impact on Africa. The continent is expected to suffer disproportionately from droughts, lack of potable water, famines and floods. African heads of governments recently claimed an annual compensation of US$ 67 billion from the industrialised countries.
Other significant aspects are the widespread corruption and the numerous armed conflicts in the region. The renowned International Crisis Group (ICG) of Brussels has noted improvements in a few of the former conflict areas, such as Burundi or the Central African Republic, but states that destabilizing events still repeatedly occur, as demonstrated by recent incidents in the DR Congo, Chad, Guinea and Zimbabwe, to name just a few. Western media only deal comprehensively with a few events, such as the violence in Kenya after the December 2008 elections or the pirate gangs operating from Somalia in the Horn of Africa. In contrast, the ICG is concerned with directing the attention of western politicians to the crisis hotspots so as to achieve the earliest possible solutions and to generally strengthen democratic forces in Africa.
When one considers all the negative aspects, it seems almost phenomenal that of all industries the cement sector is undertaking major investments in Sub-Saharan Africa. However, it must be remembered that the annual rate of urbanization is 4 %. Since 1990 the urban population has almost doubled to nearly 300 million. Many countries are making substantial efforts with regard to infrastructure, drinking water and sewage systems. The national revenues in Angola, Chad, Sudan and Equatorial Guinea are meanwhile benefitting greatly from oil income, as was already the case in Nigeria. By 2012 it is possible that, for instance, Angola could develop into one of the most important oil-producing countries in the region. Other mineral resources are nowadays mined not only in South Africa, but also particularly in Botswana, Gabon, Ghana, Guinea, DR Congo, Mozambique, Namibia, Zambia, Tanzania and Zimbabwe.
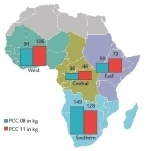
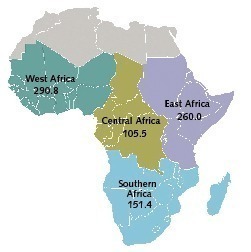
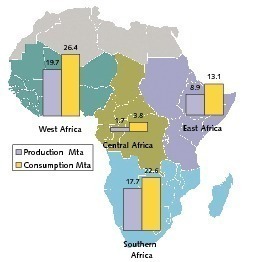
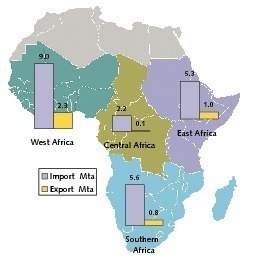
In the following, the Sub-Sahara is divided into 4 regions. These are West Africa, Central Africa, East Africa and Southern Africa, as depicted in Figure 1. The regional population in million inhabitants is also shown. The division into regions is based on a definition of the African Development Bank, with the exception that Mauritania is assigned to West Africa in the figure, and not to North Africa. Figure 2 shows the cement production and cement consumption of each region. The West African region has the highest consumption of 26.4 Mta, followed by Southern Africa with 22.6 Mta. The situation of cement production is similar. The lowest consumption is to be found in East Africa, with 13.1 Mta, and Central Africa, with 3.8 Mta. Central Africa’s share of the cement production figures for the whole of Africa is only 1.2 %, although its share of the population is 10.9 %.
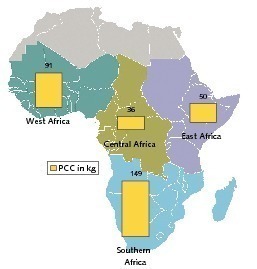
In the case of imports and exports (Fig. 3) the leading position is also held by West Africa, with 9.0 Mta and 2.3 Mta respectively. East Africa has imports of 5.3 Mta and exports of 1.0 Mta, while the figures for Southern Africa are 5.6 Mta and 0.8 Mta. Central Africa accounts for only 2.2 Mta of the imports (9 % of African imports) while its exports are insignificant. The per capita cement consumption statistics of the different regions is interesting. As shown by Figure 4, Southern Africa has the highest per capita consumption of 149 kg, followed by West Africa with 91 kg. East Africa’s figure of 50 kg and Central Africa’s mere 39 kg are among the lowest in the world. The figure reveals that the per capita cement consumptions of the individual regions of Africa differ greatly. The average per capita cement consumption of 156 kg for the whole of Africa is approximately reached in Southern Africa, while Central Africa only achieves 20 % of this average value.
West Africa stretches from the Sahel Zone up to the west coast of Africa. For the purposes of this article the region comprises Benin, Burkina Faso, the Cape Verde Islands, Gambia, Ghana, Guinea, Guinea-Bissau, the Ivory Coast, Liberia, Mali, Mauritania, Niger, Nigeria, Senegal, Sierra Leone and Togo. It is home to 30.1 % of the inhabitants of the African Continent. Around 50 % of these are residents of Nigeria. With the exception of Nigeria, the economic performance of all the countries in this region is only small to middling [1].
At present (2008), the 16 countries of West Africa have a cement production capacity of 27.8 Mta from a total of 13 integrated plants and 18 grinding plants. However, the most recent output figure of 19.7 Mta reveals that the capacity utilization is only about 71 %, which is on the low side by international standards.
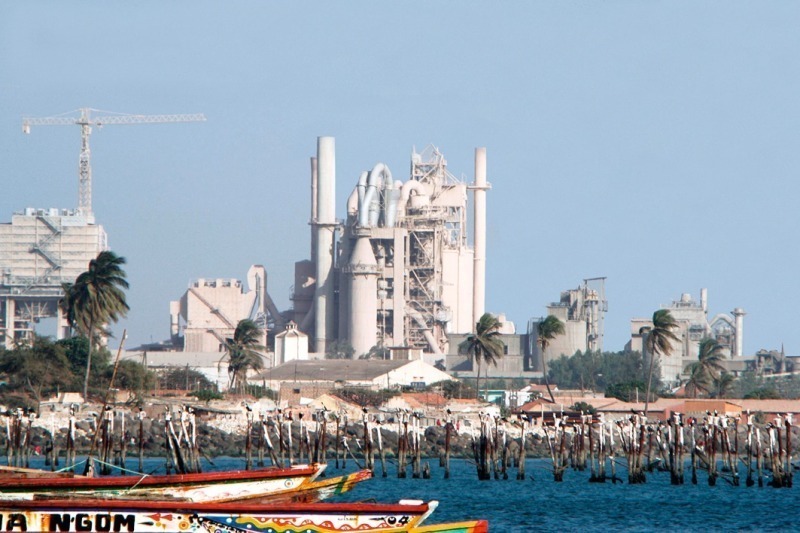
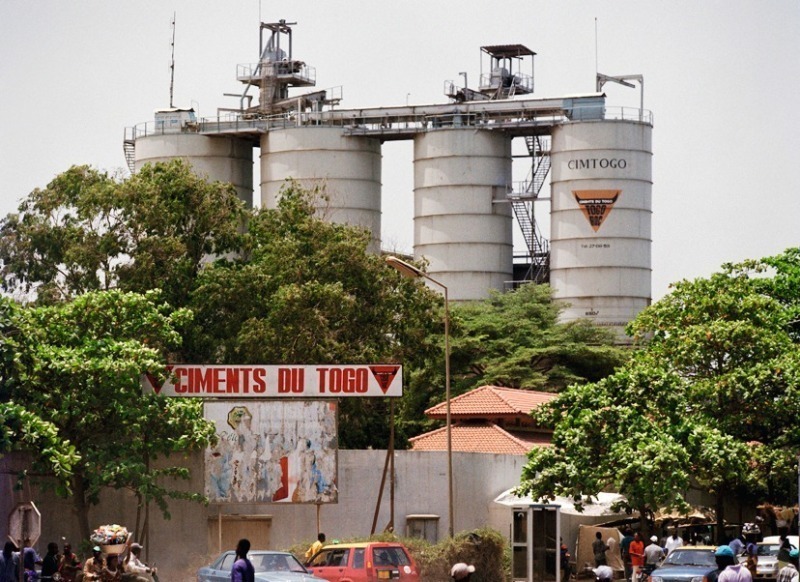
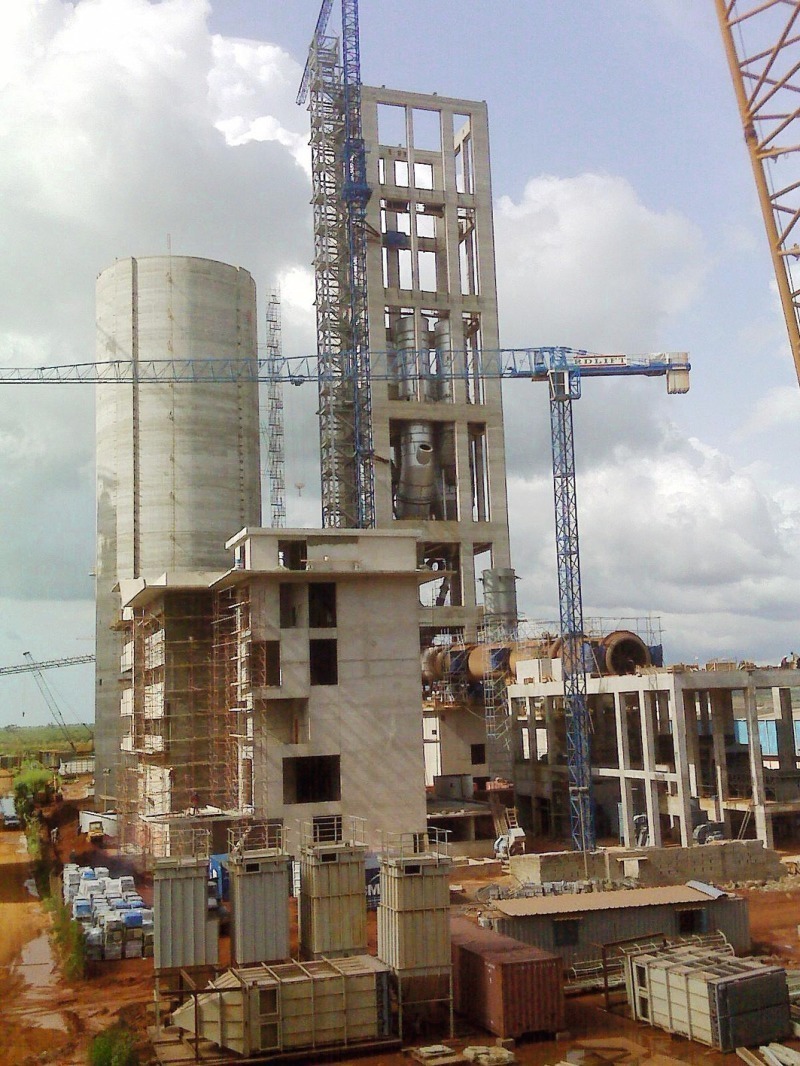
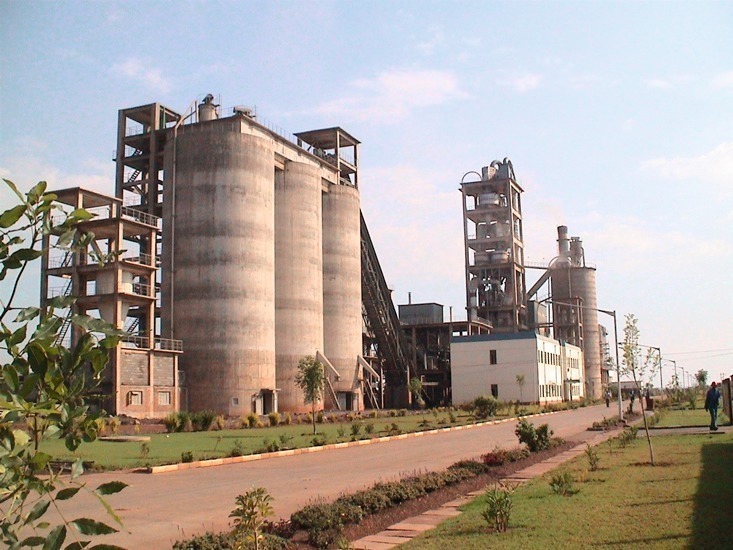
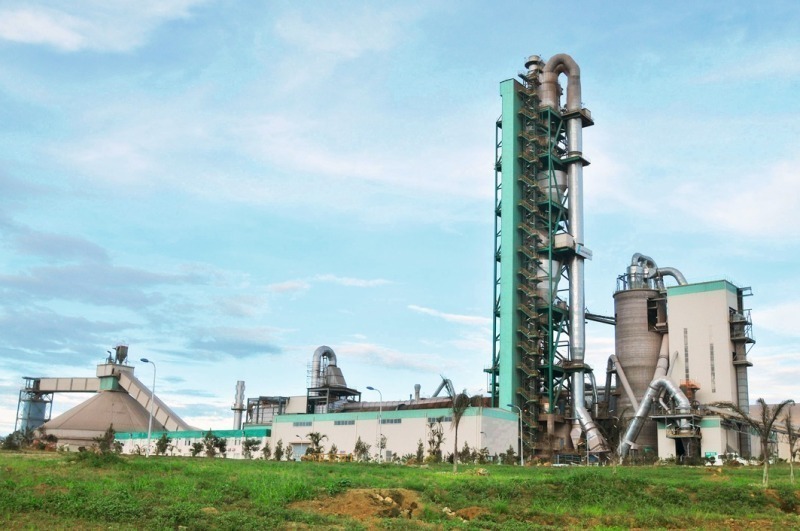
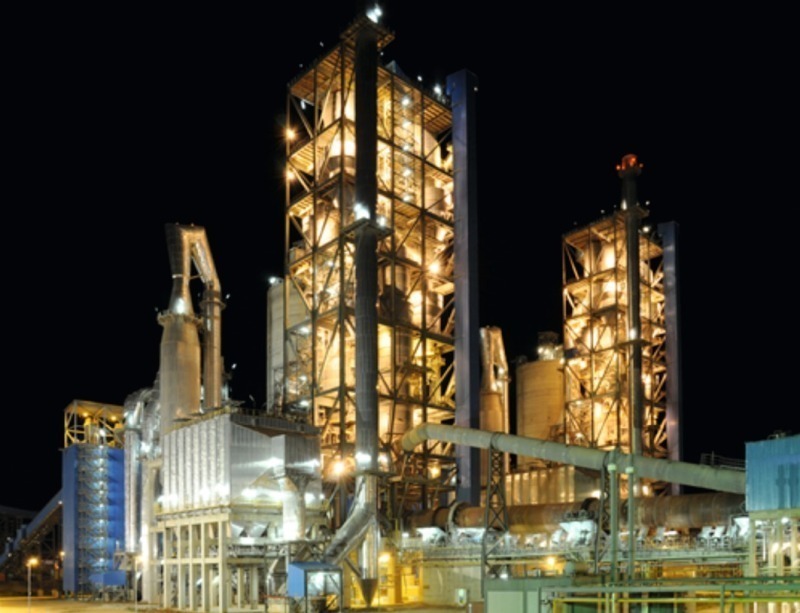
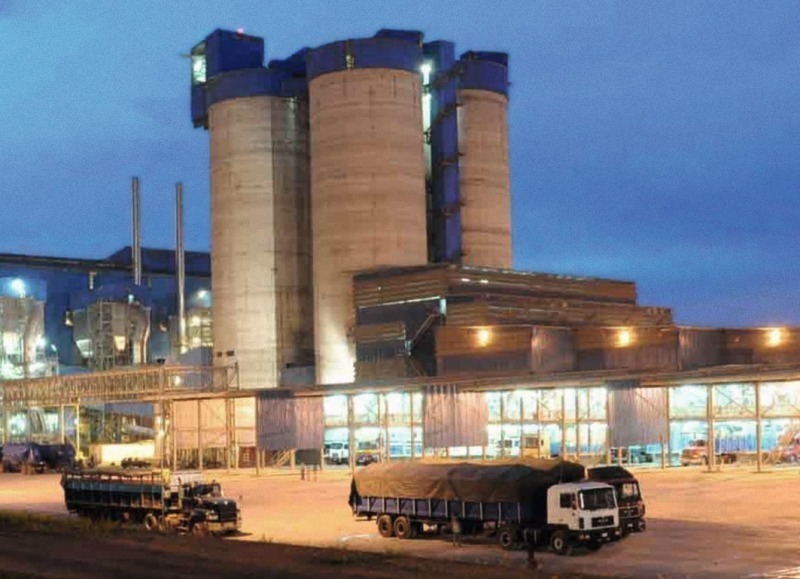
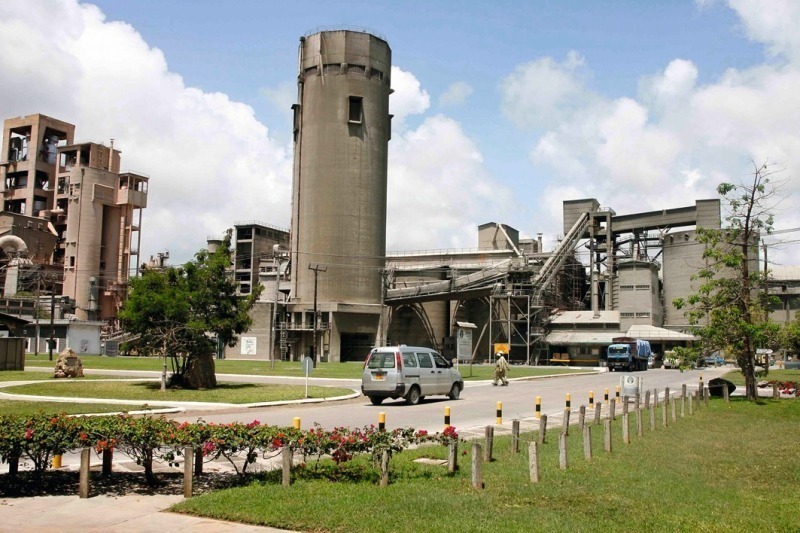
The most important cement production countries of the region include Nigeria (7.6 Mta), Ghana (3.2 Mta), Senegal (2.6 Mta), Togo (1.75 Mta) and the Ivory Coast (1.6 Mta). Countries such as Gambia, the Cape Verde Islands and Guinea-Bissau have no production facilities of their own and are completely dependent on imports. It is noticeable that up to now only four countries – Nigeria, Senegal (Fig. 5), Togo and Benin - have one or more integrated plants. In contrast, there are grinding plants in 11 countries, including Togo, Ghana, Mauritania (Fig. 6) and the Ivory Coast. Ghana and the Ivory Coast, but also Burkina Faso, Guinea, Mauritania, Liberia, Niger and Sierra Leone are thus completely dependent on clinker imports.
In recent years, an expansion of plant capacities has been practically limited to Nigeria and Senegal (Fig. 7). Up to 2010 approx. 7.3 Mta of new cement production capacity will be constructed in the region. Up to 2013 a further 11.0 Mta are planned. Nigeria is the big unknown factor: in 2008 Dangote Cement alone was still planning to expand its cement production capacity in Nigeria to 26 Mta. However, after the company cancelled orders placed with Sinoma it would seem more realistic that Dangote will account for around 8.5 Mta of the overall expansion of 11.1 Mta in Nigeria. Other capacity expansion projects are expected in Senegal, Ghana, Burkina Faso and Mali.
This region stretches from the Horn of Africa and Sudan up to the east coast with Tanzania and several islands. It comprises 12 countries, Burundi, the Comoro Islands, Djibouti, Eritrea, Ethiopia, Kenya, Ruanda, the Seychelles, Somalia, Sudan, Tanzania and Uganda and has 26.9 % of the population of Africa. The 5 countries south of the Horn of Africa: Kenya, Tanzania, Uganda, Ruanda and Burundi make up the EAC (East African Council) and are regarded in many publications as the “real” East Africa. The region of East Africa is relatively rife with contention. With the exception of the Seychelles, the per capita income in these countries is significantly below the average for Africa as a whole. In past years, the motor for growth in this region was Kenya.
East Africa has a cement production capacity of only 12.1 Mta from 22 integrated plants and 3 grinding plants. These figures already make clear that the average capacity of the plants is relatively low, at 0.48 Mta or 1520 tpd. This means that the specific cost of cement manufacturing in the region is relatively high. The cement production output of 8.9 Mta in 2008 results in a capacity utilization of almost 74 %. This region has the largest annual growth in cement consumption, in some cases exceeding 30 %, particularly in Sudan (Fig. 8) and Ethiopia. However, in Tanzania the recent growth rate was significantly lower.
Due to a lack of their own capacities, the up-and-coming countries of Sudan and Ethiopia have only been able to cover their growing demand for cement by extensive importation. In Sudan, 70 % of the cement consumption was met by importation, while in Ethiopia the figure was 40 %. There have also been recent increases in the import figures of the more established cement markets in Kenya and Tanzania (Fig. 9). This is largely due to the fact that the EAC reduced CET import duties from 35 % to 25 %, which resulted in increased East African cement imports from the Middle East and Pakistan. A further increase in imports is anticipated for the coming years, which could cause a drop in the sales volume of some established cement producers in the region.
The high expectations with regard to the region‘s cement demand in coming years have also lent impetus to capacity expansion projects. Currently, such projects are being implemented in Sudan, Ethiopia, Eritrea, Kenya, Tanzania and Uganda (Fig. 10). It is possible that Sudan and Ethiopia may already achieve capacity increases of 5.7 and 3.5 Mta respectively by 2010. For the entire region an 11.7 Mta expansion of cement production capacity is expected by 2010, which corresponds to almost a doubling of the existing capacity. By 2013, a further expansion by 10 Mta is possible, but by then it is likely that some older integrated plants will have been shut down.
This region comprises the 12 countries Angola, Botswana, Lesotho, Madagascar, Malawi, Mauritius, Mozambique, Namibia, South Africa, Swaziland, Zambia and Zimbabwe but only holds 15.7 % of the African population. The countries have widely differing per capita gross national products, with the highest incomes being achieved in Botswana, Mauritius, South Africa, Angola, Namibia and Swaziland and the lowest incomes in Lesotho, Madagascar, Malawi, Mozambique, Zambia and Zimbabwe. The region has a cement production capacity of 23.3 Mta from 20 integrated cement plants and 14 grinding plants. In 2008, the total cement production output of the region was 17.7 Mta.
This means that the capacity utilization is approx. 75.9 %.
The most important cement producing country in the region is South Africa, whose output of 13.3 Mta makes up 75 % of the quantity produced in the whole region. Significant production quantities are also achieved in Angola (1.4 Mta), Zambia
(0.85 Mta), Zimbabwe (0.8 Mta) (Fig. 11) and Mozambique (0.73 Mta). However, it should be noted that in these countries the plant technology is sometimes relatively outdated. In Angola and Botswana cement imports amount to almost 70 %, while Mauritius, Namibia, Lesotho and Swaziland have so far been 100 % dependent on imports. In total, the region’s imports amount to 5.6 Mta, which is even higher than East Africa’s figure.
In recent years an increase in capacities has taken place after many years of stagnation, with South Africa and Zambia (Fig. 12)
being the main beneficiaries up to now. It is anticipated that a further 5.6 Mta of cement production capacity will be ready for operation in South Africa, Namibia and Uganda by 2010. By 2013 the region hopes to have an additional 6.5 Mta of cement production capacity. Apart from South Africa, this expansion in capacity will be implemented particularly in Namibia and Angola.
A total of 8 countries make up the Central African region, which has a population of 105.5 million or just under 11 % of the total African population. The region comprises Cameroon, Chad, the Central African Republic, the Republic of the Congo, the Democratic Republic of the Congo, Gabon, Equatorial Guinea and the island-state of Sao Tomé and Principe. While Equatorial Guinea and Gabon have a per capita gross national product comparable with Spain, thanks to their oil income, the earnings in the other countries mainly lie at the bottom end of the scale. The DR Congo is one of the poorest countries with an average annual per capita income of US$ 329 (PPP = Purchasing Power Parity). Central Africa has a cement production capacity of only 3.1 Mta from 5 integrated plants and
4 grinding plants.
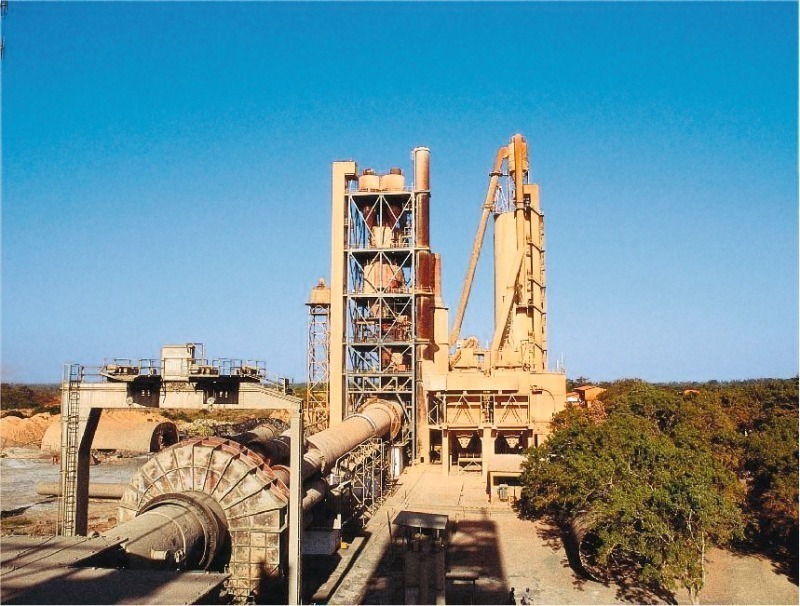
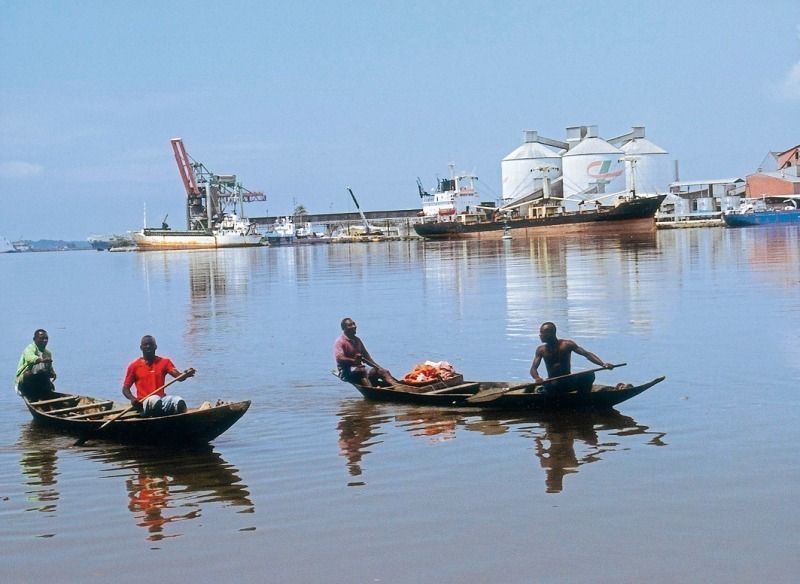
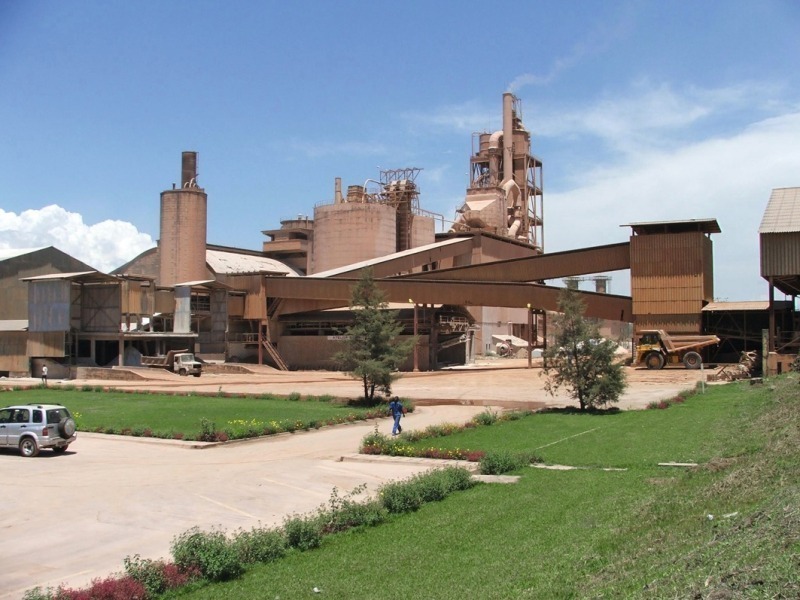
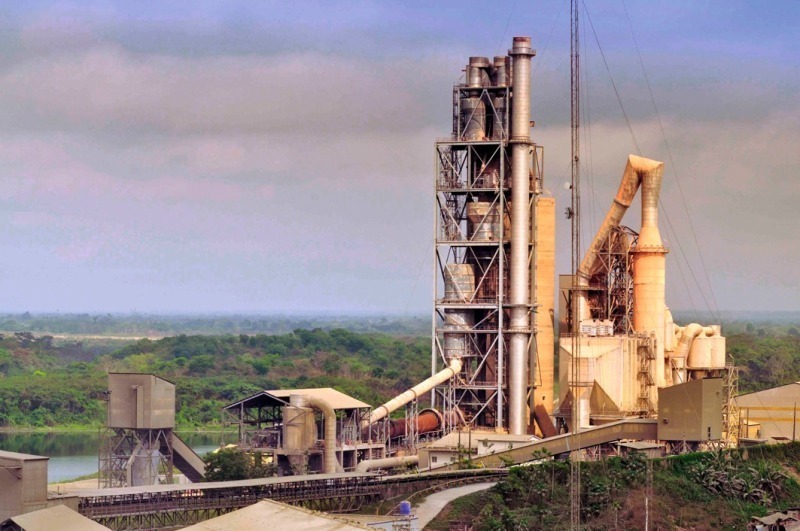
Cameroon (Fig. 13) has the biggest cement production capacity with 1.8 Mta and an output rate of 0.8 Mta, followed by the DR Congo with a capacity of 0.7 Mta (Fig. 14) and an output rate of 0.5 Mta. Chad, the Central African Republic, Equatorial Guinea and Sao Tomé and Principe have no production facilities of their own and are completely dependent on imports. However, at present most imports go to Cameroon (0.6 Mta), the DR Congo (0.45 Mta) and Equatorial Guinea (0.4 Mta). Despite the repeated announcement of cement projects for the region in the past, only a moderate expansion of capacities is to be expected for the coming years, including the DR Congo and the Republic of the Congo. No new capacities will be ready for operation in the region before 2010, but by 2013 it is possible that approx. 3.9 Mta will have been added.
in the regions
Three countries will be considered more closely in this section, as they have a decisive influence on the further development of the cement industry in Sub-Saharan Africa: South Africa, Nigeria and Kenya.
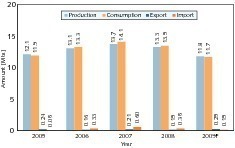
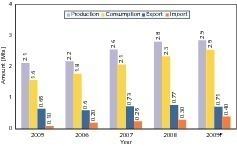
After many years of robust annual economic growth with figures around 5 %, a distinct downturn occurred in 2008 with 3.1 % and this continued in 2009 with 1.1 %. The fortunes of the cement industry have deteriorated even more severely
(Fig. 15). In 2007 the output, consumption and import rates peaked, but since then a significant decline has occurred (cement consumption 4.6 % down in 2008) [2]. For 2009 it is expected that cement consumption will slump by a further 13 % to 11.7 Mta. This is expected to affect 7 South African provinces, the exceptions being Limpopo and Mpumalanga. At the end of 2007 the cement industry had still anticipated that the region (Southern Africa including Botswana, Lesotho, Namibia and Swaziland) would experience a rise in cement consumption to 18 Mta by 2009, with South Africa accounting for about 16 Mta.
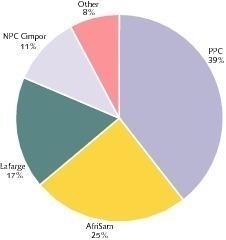
Figure 16 shows that the Pretoria Portland Cement Company (PPC) is the market leader with a share of 39 % in the country’s total capacity of 15.5 Mta due to its 6.1 Mta from 7 integrated plants and one grinding plant. The company operates 13 kiln lines. In 2009 the Dwaalboom 2 plant (Fig. 17) went into operation with a capacity of 1.25 Mta. In 2010 their new
1.0 Mta grinding plant will commence operation at the Hercules factory. AfriSam, a company established out of
Holcim South Africa and the former Alpha Cement company, takes 2nd place with a capacity of 3.8 Mta. At present, AfriSam owns 3 plants, one of which is a grinding plant. The subsequent rankings are occupied by Lafarge with a capacity of 2.7 Mta (Fig. 18) and NPC Cimpor with a capacity of 1.7 Mta. The remaining producers are Slagment, Ash Resources and Ulula Ash, which predominantly operate mixing plants for blast furnace slag and fly ash.
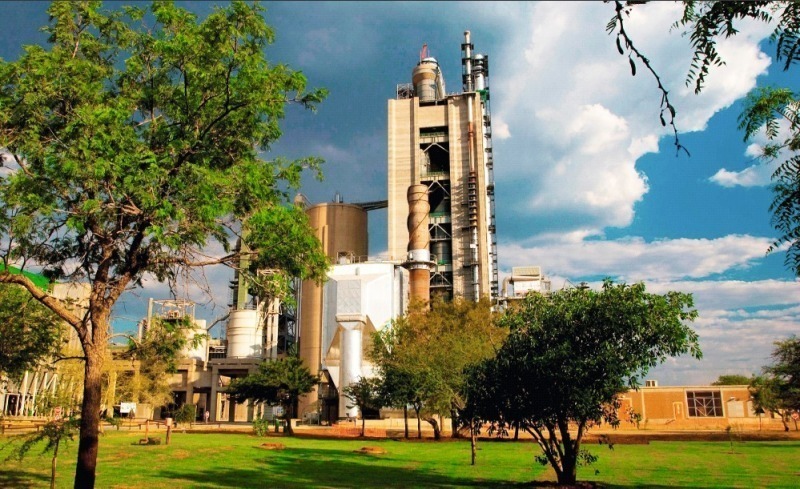
After 1984 no new kiln lines were built in South Africa for many years. That changed because of the good prospects since 2005, which prompted the construction of a number of kiln lines and the realization of cement capacity expansion projects (Fig. 19). At Cimpor, for example, a 2nd kiln line with a capacity of 0.6 Mta was put into operation at the Simuna factory in July 2008. In 2010, new clinker production capacities are to be implemented at Lafarge Lichtenburg and cement grinding facilities are to be extended at PPC and AfriSam. PCC is also planning further projects. The only remaining project of a newcomer to the market is the 2.1 Mta cement factory of
Sephaku Holdings, a company in which Dangote Cement holds a strategic equity interest. The project planned by Orascom Construction Industries had earlier been cancelled after Orascom Cement had been taken over by Lafarge.
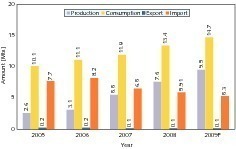
A number of contradictory reports about the cement industry in Nigeria have been published in recent years. One reason for this confusion is the lack of precise data regarding the country’s economic development. Recently, there has been a growth in gross national product of 6.2 %. Despite the country’s high revenue from the oil industry, the average per capita income is only about US$ 2100 (PPP). The annual inflation rate is approx. 11 %. The cement industry is still largely characterized by imports, which, as shown in Figure 20, reached a peak of
8.2 Mta in 2006 [2]. Cement output rose to 7.6 Mta in 2008, while cement consumption increased to 13.4 Mta, corresponding to a per capita cement consumption of 90 kg. For 2009 a further increase of 9.5 % is anticipated.
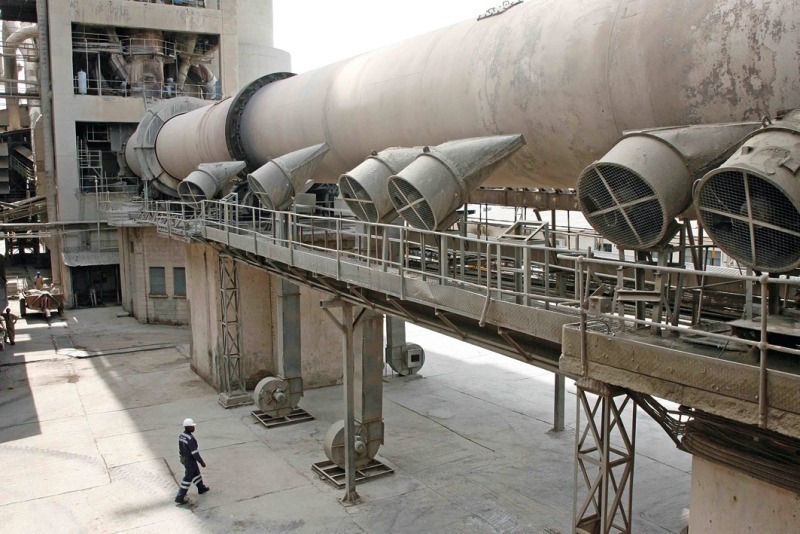
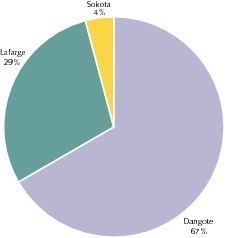
Nigeria currently has a cement import capacity of approx. 13 Mta and a cement production capacity of 12 Mta. Considering the already existent clinker production capacity of 10.65 Mta, the cement production capacity could be significantly increased by extending grinding plants. Dangote Cement is market leader (Fig. 21) with 67 % of the cement production capacity from two integrated cement plants. Its Obajana cement factory (Figs. 22 and 23), which has a capacity of 5.2 Mta, is the biggest cement plant south of the Sahara. Lafarge, through its subsidiaries Ashaka and WAPCO (West African Portland Cement), operates three integrated plants (Fig. 24) with a cement production capacity of 3.5 Mta. One further 0.5 Mta factory is operated by Sokoto Cement.
In May 2009 a further player entered the market with the commissioning of United Cement‘s (UniCem) 2.5 Mta cement plant. This plant was originally ordered by Orascom in 2005 and completed in 2009. Lafarge and Holcim each have a 28 % stake in UniCem, while Dangote Cement and Floor Mills each have a 22 % holding. Dangote is also planning to expand the capacities of its Obajana and Benue plants and to install new capacities in Ibese. Lafarge is also planning to significantly expand capacity. Several projects are also being planned by newcomers. It is expected that Nigeria will change from being a cement importing country to being a cement exporting country in 2012/2013.
The political crisis in Kenya after the elections in December 2007 severely damaged the reputation of the country as a factor for stability in Africa. Nevertheless, it achieved a relatively high economic growth of 2.6 % in 2008. The exceptionally long dry season this year has resulted in a severe drought and mass animal mortality in the Rift Valley and other areas. On the cement sector, the growth in cement consumption dropped from 16 % in 2007 to 12.5 % in 2008 (Fig. 25). For 2009 the growth rate will be just under 9 % [2]. While exports are in decline, imports are showing an increasing trend. One of the reasons for this growth in imports is the cut in import tax, but on the other hand the high inflation rate of 26 % in 2008 raised the cost of fuels and electricity, which made locally manufactured cement more expensive than imported cement.
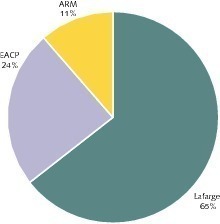
The per capita cement consumption is 61 kg (2008), which is still comparatively low, as it is in the entire region. For this reason, high expectations are being placed in the increase in per-capita consumption and the associated rise in cement sales that are expected in the coming years. The existing cement production capacity of 3.1 Mta is owned by three producers (Fig. 26). Lafarge is the market leader with 2.0 Mta or 65 % from an integrated cement plant in Bamburi (Fig. 27) and a grinding plant in Nairobi. Lafarge also has a stake in the two other cement producers in Kenya. It has a 41.7 % holding in the East African Portland Cement Co. (EAPC), which has a production capacity of 0.75 Mta. Its holding in Athi River Mining (ARM), which has a cement production capacity of 0.36 Mta in Kenya, is 17 %.
In the coming years Kenya’s cement production capacity will increase significantly. Mombasa Cement is a newcomer with a 3,000 tpd clinker production line in Mombasa and a grinding plant in Nairobi. The plant was placed in operation in July 2009. EAPC has increased its capacity to 1.3 Mta by installing a further grinding plant. Lafarge also eliminated a bottleneck by installing a new cooler. ARM is going to put a second clinker production plant and a further grinding plant into operation in the near future. Moreover, two Indian firms (Mehta Group and Cemtech Sanghi) are also planning to enter the market in the Pokot District. Although both companies received agreement for their projects, it appears that only one will ultimately be granted a license.
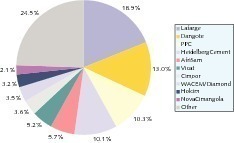
The TOP 10 cement producers in Sub-Saharan Africa in 2008 have a total share of almost 85 % of the cement production capacity (Fig. 28, Table 1). The market leader, with a capacity of 12.5 Mta from a total of 11 integrated cement plants and
4 grinding plants, is Lafarge. The company is represented in South Africa, Zambia, Malawi, Tanzania, Kenya, Uganda, Nigeria, Cameroon and Benin. As is the case with the other companies, this statistic does not take the company’s minority shareholdings or cement terminals into account. The next two places are taken by Dangote Cement and PPC with production capacities of 8.6 Mta and 6.8 Mta respectively. Both of these local African cement manufacturers have cement plants in only two countries. HeidelbergCement’s capacity of 6.7 Mta gives it a market share of 10.2 %. The company is represented in
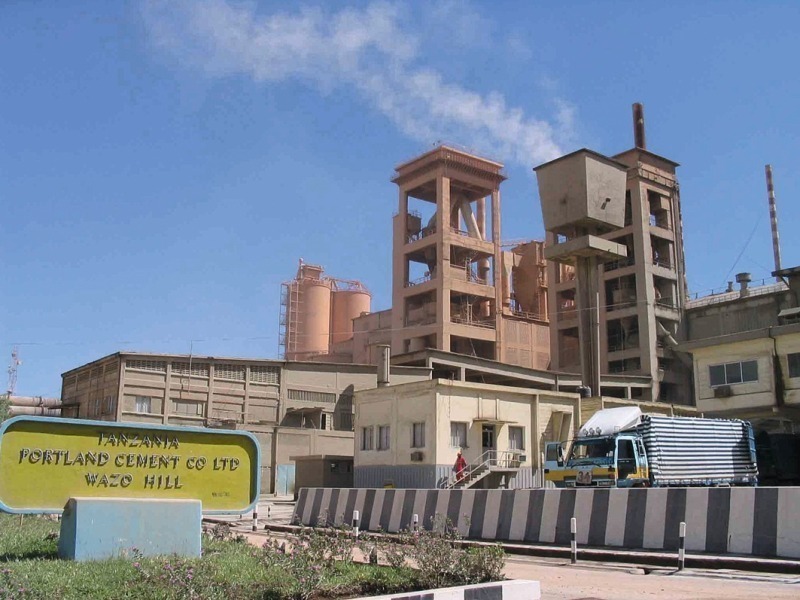
7 countries: in Gabon and Tanzania (Fig. 29) it operates integrated plants, while in Benin, Ghana, Liberia, Sierra Leone and Togo it only owns grinding plants.
The remaining TOP 10 places are occupied by several other local companies, such as AfriSam, WACEM/Diamond and NovaCimangola, as well as international firms like Vicat, Cimpor and Holcim. In 2007, Holcim sold 85 % of its shares in the former Holcim SA (Pty) Ltd. to the AfriSam Consortium. Afrisam thus became the fifth largest producer in the region with a capacity of 3.8 Mta. Vicat currently has a capacity of
3.5 Mta with its plants in Senegal and Mauritania and thus has a market share of 5.2 %. Cimpor and Holcim only achieve market shares of 3.6 % and 3.2 % respectively with their 2.4 Mta
and 2.1 Mta capacities. All the other companies only reach
a total capacity of 16.3 Mta from 30 integrated plants plus
14 grinding plants. This means that the average capacity of their plants is only 0.37 Mta or 1,120 tpd, which certainly results in high specific production costs.
Currently, Sub-Saharan Africa only has a per capita cement consumption of 82 kg. Based on this fact, high expectations are placed in the region’s further development. In a new
multi-client market study [2], OneStone Consulting reaches the conclusion that the per capita cement consumption in the region will increase to 125 kg by 2020. This approximately corresponds to a doubling of the cement consumption from the present 65.9 Mta to 132 Mta. Currently, imports make up 16 % of the cement consumption in the region. Based on the assumption that imports rise to 20 %, approx. 26.4 Mta would be imported to the region in 2020. This means that the cement production rate would be 105.6 Mta. At the present capacity utilisation of 72.4 %, a cement production capacity of 145.9 Mta would be required in 2020. If the capacity utilisation rises to 77 %, a capacity of 137.1 Mta would still be needed, making new capacity (i.e. without shutdowns of existing lines) of 70.8 Mta necessary. When the planned new capacities for the period up to 2013 are totalled up,
the new capacity installed in the region would already be
56 Mta, almost 80 % of the required new capacity.
Überschrift Bezahlschranke (EN)
tab ZKG KOMBI EN
This is a trial offer for programming testing only. It does not entitle you to a valid subscription and is intended purely for testing purposes. Please do not follow this process.
This is a trial offer for programming testing only. It does not entitle you to a valid subscription and is intended purely for testing purposes. Please do not follow this process.
tab ZKG KOMBI Study test
This is a trial offer for programming testing only. It does not entitle you to a valid subscription and is intended purely for testing purposes. Please do not follow this process.
This is a trial offer for programming testing only. It does not entitle you to a valid subscription and is intended purely for testing purposes. Please do not follow this process.