Improving early-age strength of fly ash cement and increasing fly ash content by inter-grinding


Thermal power plants have a significant role in energy production. Within the combustion process, a by-product called fly ash is obtained and can be utilized by the cement industry as an additive for improving the overall economy of the manufacturing process. This study focuses on evaluating the performance of a fly ash classification plant with regard to quality development in the streams of material through the classifier. Within that scope, the cementitious properties of raw, fine and coarse ash were determined in dependence on changes in their degree of fineness. The values of fineness were adjusted both by changing the operating conditions of the classifier and by way of laboratory-scale grinding tests in which inter-grinding of cement and fly ash was taken into consideration. The study showed that the streams of material through the classifier had similar quality results, and that inter-grinding could increase the ash content by up to 45 % with 14 % improvement in strength. Moreover, it proved possible to nullify the negative effect of fly ash addition on early-age strength of fly ash cement mixture by means of inter-grinding.
1 Introduction
Fly ash is a by-product of coal-fired power plants. In Turkey, around 650 000 t of fly ash is produced annually, requiring around 60 000 m2 of land area for storage [1]. Depending on the lifetime of the power plants and the utilization rate of the fly ash, this area can be even larger.
The cement manufacturing process is known as energy intensive. The total energy consumption of the cement production process varies between 110 kWh/t and 150 kWh/t, roughly 60 % of which is utilized for grinding the raw material and cement clinker. Therefore, cement producers aim to utilize...
1 Introduction
Fly ash is a by-product of coal-fired power plants. In Turkey, around 650 000 t of fly ash is produced annually, requiring around 60 000 m2 of land area for storage [1]. Depending on the lifetime of the power plants and the utilization rate of the fly ash, this area can be even larger.
The cement manufacturing process is known as energy intensive. The total energy consumption of the cement production process varies between 110 kWh/t and 150 kWh/t, roughly 60 % of which is utilized for grinding the raw material and cement clinker. Therefore, cement producers aim to utilize different kinds of additives in place of the clinker. Adding fly ash improves the economy of the process while greatly reducing the release of greenhouse gases. Pertinent studies imply that 1 ton of cement clinker production is responsible for 1 t of CO2 release [2].
Fly ashes have different classifications, and several studies have been performed to date on their use in both cement and concrete applications [3]. Atakay [4] conducted studies on C-type fly ash, where different size distributions and ash contents were produced and then subjected to strength testing. The study concluded that, the finer the fly ash, the higher the strength values. However; the early-age effects were very limited. On the other hand, it was also found that increasing the fly ash content of cement mortar reduced its ultimate strength. Siddique [5] undertook studies on F-type fly ash with varied ash contents (40 % to 50 %) to investigate the resultant differences in strength. It was indicated that none of the results were higher than the reference sample. Paya et al. [6] investigated the effects of F- type fly ash on the strength of concrete. In their study, fly ashes having different size distributions were prepared by an air classification technique, after which the strength of the corresponding concretes were evaluated. They concluded that an ash content of 30 % was able to maintain the same 28-day strength of the concrete. Kiattikimol et al. [7], in their study, classified original fly ash samples obtained from five different sources. In their procedure, the original sample was initially air separated. Then, the coarse fraction was ground and re-separated, and the fine fraction was subjected to strength testing. They summarized that, apart from the chemical composition, the fineness of the fly ash had significant effects on strength development. It was indicated that similar-sized fly ash samples had similar strength properties. Bentz et al. [8] studied various sample mixtures of cement and fly ash. In their study, 19 types of cement mortar having different size distributions and ash contents were prepared. The results suggested that, by adjusting the fineness of the mortar, fly ash can be substituted for 35 % of cement and still obtain the same strength values.
To date, numerous researches have been undertaken to reveal the benefits of fly ash utilization, including discussion of the influence of the degree of fineness and ash content. The present study is believed to contribute to the related literature by assessing the performance of ash classification plant regarding the strength development of different streams. Within that scope, the degrees of fineness of different streams were adjusted by means of classification and laboratory grinding tests to investigate the impacts on their cementitious properties. The loss in early-age strength of cement due to fly ash addition is one of the foremost factors that prevent the use of fly ash. During the laboratory grinding tests, the inter-grinding of fly ash with cement was also considered, as it had been the subject of only very limited research in the literature. The studies implied that it is possible to eliminate the loss of early-age strength, if the fly ash is inter-ground with cement.
This study, with its extensive evaluations and discussions pertinent to fly ash classification plants, is believed to be beneficial from both the academic and industrial points of view The detailed analysis of different streams also yielded improved knowledge regarding the effects of different chemical compositions on concrete strength properties. That stands as another novelty of this study. Such a study can also lead to a more optimized performance of ash classification operations, a fact that can be counted as yet another contribution to the literature.
2 Experimental studies
2.1 Materials
The research was undertaken at a fly ash classification plant, where F-type fly ash is processed to supply material for the cement/concrete business. The plant processes the ash supplied from the Seyitömer power plant located in Kütahya/Turkey. A simplified flow sheet of the classification unit and one of the obtained size distributions, as well as the technical properties of the unit, are depicted in Figure 1 and Table 1. It should be emphasized that, within the plant, only the fine stream of the classifier (Figure 1) is processed as an end product, while the coarse stream is termed as waste and, hence, not utilized.
The chemical compositions of the fly ashes used within this study are given in Table 2. As can be understood, the classification process affected the chemical compositions of the materials. Specifically, the SiO2, SO3 and CaO contents, as well as the L.O.I., differed significantly, depending on the changes in size distribution. The coarse stream of the classifier had less SO3, less CaO, higher L.O.I. and higher SiO2 than that of the fine stream. In the literature, there have been different publications commenting on the variations in the chemical compositions following the classification process. Erdogdu and Turker [9] and Jaturapitakkul et al. [10] concluded that the coarse fraction had less SO3 than the fine fraction. That is in agreement with the results obtained in this study. Kumar et al. [11] studied the fractionated fly ash. The chemical analysis performed by them proved that, as the product became coarser, the L.O.I. of the material increased. That may be an indication of increased carbon content. Similar results were also obtained within this study, since the coarse stream of the classifier had a higher L.O.I. value (Table 3). The changes in L.O.I. may also be indicative of the carbon content. Yılmaz [12] proved that L.O.I. and carbon content were directly proportional to each other.
The impact of the fly ashes on the strength of the cement mortar was determined by a standard test as prescribed in TS-EN 450-1, where a mixture containing 25 % ash and 75 % cement was prepared. Consequently, the type of cement is also an important factor in the evaluations. Table 3 gives the specifications of the cement used in this study. It should be emphasized that this type of cement already contains 18 % fly ash.
2.2 Methods
The study was undertaken in three parts. Initially, the air classifier was operated under different operating conditions to obtain different values of fineness. The aim was to investigate the impacts of product fineness on the quality figures without inclusion of a grinding operation (Part 1).
The second part of the study focussed on the strength improvement of all the streams as a result of grinding. In this context, materials were ground to different sizes in a laboratory Bond ball mill [13]. For Part 1 and Part 2, strength tests were performed in accordance with TS EN 450-,1 meaning that all tests were performed at the same ash contents (25 %).
Part 3 focussed solely on the fine stream of the classifier (separated or fine ash), in which the effects of inter-grinding (with cement) and changing amounts of fly ash in the cement mortar were investigated. Since the economy of a cement manufacturing process can be improved by replacing the clinker, this part of the study attempted to give an impression of its high utilization potential.
The test matrices are summarized in Table 4 and Table 5. As seen in Part 3, the fly ash content was altered considerably to investigate the possibility of utilizing the larger amounts in the cement recipe.
Throughout the evaluations, the size distributions, the surface-area measurements, the strengths of the cement mortars and the setting times were considered as presented in the following sections.
3 Results and discussion
3.1 Particle size distributions and surface area measurements
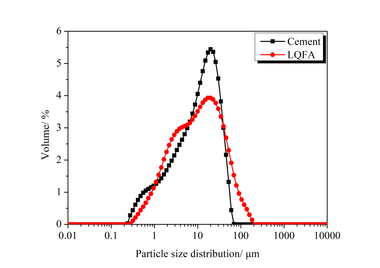
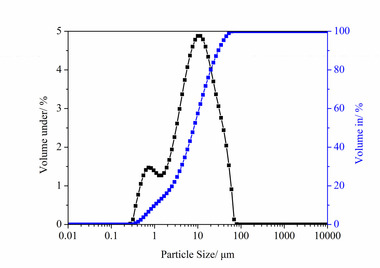
The size and surface area measurements were undertaken via laser diffractometry and Blaine techniques. Figures 2 through 4 depict the measured size distributions of the samples obtained in Part 1 to 3 as defined in Tables 4 and 5.
As can be understood, there is considerable difference between the size distribution curves. Hence, a comprehensive data interpretation could be undertaken for the quality developments. Figure 2 represents the size distributions of the classification process. Figure 3 illustrates the size distributions obtained as a result of grinding the different streams. As shown within the test matrices, there were samples having similar median sizes but different chemical compositions, since each stream had its own characteristics (Table 3). Consequently, the influences of the chemical ingredients could also be discussed. Figure 4 illustrates the size distributions of the tests in which the focus was on increasing the use of fly ash, either by inter-grinding the fly ash with cement or by grinding only the fly ash and then mixing it with unground cement. The impacts of inter-grinding can be evaluated by way of Figure 4a and Figure 4b. As a precedent, the median size of the mixture with 30 % ash content (ground fly ash + unground cement) was 17.5 μm (Figure 4a). However, it dropped to 8.4 μm when the inter-grinding procedure was applied for the same ash content (Figure 4b). Such results indicate that the components behave in a different manner when they are processed together. The softer component of the mixture tends to be ground to a finer degree. Similar conclusions have also been drawn by other researchers, who focussed on developing multi-component model structures for the cement grinding processes [14, 15].
Surface area measurements of the samples, together with their median sizes, are tabulated in Table 6. For Part 1 and Part 2, the measurements of the fly ash samples are given. Part 3 dealt with the measurements of the mixed samples (cement and fly ash).
It is a very well-known fact that, the finer the material, the higher the surface area will be [16, 17, 18]. Within the study, similar observations were made. However, it was understood that the trends varied, depending on the type of material being investigated. In other words, the trends of the separator’s fine, feed and coarse streams differ considerably from each other (Figure 5). Similar conclusions were drawn by Kiattikomol et al. [7], who indicated that the shape characteristics of the ash samples i.e., irregularity and porosity, had effects on the surface area measurements.
In order to investigate the shapes of the particles, images of the ground and unground ashes were processed via SEM, as depicted in Figures 6 through 8. For the ground products, attention was paid to ensuring that the median sizes were similar (20 μm) for each of the materials.
The subject images show that the grinding operation had effects on the shape characteristics of the products, since the sphericity of the particles was found to have deteriorated. For the classifier fine stream, more of the spherical and glassy particles were found in the 10 μm range, while the coarse stream had spherical but no glassy particles in the 45 μm size. Paya [6] and Bouzoubaa [19] reached similar conclusions and stated that the grinding process has adverse effects on the sphericity of the particles.
This study also revealed that there were more spherical particles in the classifier fine stream that had the lowest Blaine value for the same target size. By way of contrast, the classifier coarse stream had the least number of spherical particles and the highest Blaine-fineness level. The variance in Blaine number can be attributed to the changes in particle shape. It can be stated that, the higher the number of spherical particles in the structure, the higher the Blaine number. However, further investigations will be necessary to validate these assumptions.
3.2 Strength results
3.2.1 Strength results of Part 1 samples
The results of the strength tests are illustrated in Figure 9. As can be understood, the fineness and strength of cement mortar are inversely proportional to each other, meaning that, as the separated fly ash becomes finer, higher strength values are obtained. When the 28-day strength results are compared for d50s below 25 μm, the strength values are higher than that of the reference sample. For a d50 of 23 μm, the increase in 28-day strength was around 7.8 %, while it was 11 % for a d50 of 19 μm. Atakay [4] also reached similar conclusions and a study with F-type fly ash, in which it was proven that decreasing the d50 from 32 μm to 20 μm improved the 28-day strength by 12 % for a fly ash content of 25 %.
3.2.2 Strength results of Part 2 samples
Within this part of the work, feed, coarse and fine fly ashes were ground to different sizes and then mixed with unground cement to follow the resultant strength developments (Table 7).
As can be understood, for each of the materials, the finer the product, the higher the strength of the cement mortar. As a further evaluation, the strength values obtained at similar median sizes of different streams were compared to reveal whether the chemical composition had any effects on the results (Figure 10).
As depicted in Figure 9, from the feed stream to the fine stream, 7-day and 28-day strength results increased by 14.7 % and 5.8 %, respectively. However, for the median size 10 μm, the 28-day strength value of the coarse stream was lower than that of the feed (Table 7). Consequently, for the fly ashes, it is not convenient to draw any absolute conclusions about the effects of the chemical composition. Kiattikomol et al. [7] also drew similar conclusions. In their study, they commented that, for the fly ashes, the chemical composition had no significant effect of on the strength of the cement mortar. Such an outcome encourages the use of the classifier coarse stream as an additive for cement mortar. Hence, the optimization point regarding increased throughput can be achieved with recourse to fine grinding technology.
3.2.3 Strength results of Part 3 samples
Within the section, the inter-grinding of cement and fly ash samples was also discussed and compared with the results of ground ash mixed with unground cement. Within these assessments, the early-strength results (1-day, 2-day) were also incorporated into the test matrices. The results are depicted in Figures 11 and 12.
Figure 11 indicates that both the size distribution and the ash content have an influence on the strength results. It is seen that, when the ash content in the reference sample was increased from 18 % to 30 %, the strength at any age decreased considerably. For the 28-day results, it declined from 56.1 MPa to 51.2 MPa, corresponding to an 8.7 % decrease. Similar conclusions have been arrived at by Songpiriyakij and Jaturapitakkul [21], who conducted strength tests with F-type fly ash. They found that adding 15 % fly ash to the concrete structure decreased its strength by 10 % and that there was a 15 % loss when the fly ash content increased to 25 %. Karahan and Atiş [22] changed the fly ash content gradually from 10 % to 45 %, showing that the 28-day strength of the concrete fell by 6 % when 10 % fly ash was added into the structure. In the case of 45 % fly ash, the reduction in strength at that age was pegged at around 28 %.
Figure 11 depicts not only the strength values, but also the median sizes of the mixtures. Since these tests included mixtures of ground fly ash and unground cement, the median sizes of the mixtures are actually functions of the changes in the fineness values of the fly ash. Consequently, it could be beneficial to show the median sizes of the fly ashes, as well (Table 8).
For a 30 % ash content, the results implied that, as the fly ash became finer, higher strength values were obtained with the exception of the 1-day strength results. Another outcome of the results was the impact on the early strength of the cement. Decreasing the d50 fineness of fly ash 15.4 μm to 10 μm improved the 2-day strength by 19 %. When the 7-day strength results were considered, the improvement was 10.3 %. In contrast to the differences at early ages, the 28-day results were similar to each other. However, as a conclusion, except for the results of fly ash having a d50 of 6.3 μm, most of them were below the reference sample, the 28-day strength of which was 56.1 MPa. For the finest product, a 7.1 % gain was achieved for the 28-day strength (from 56.1 MPa to 60.1 MPa).
Figure 12 illustrates the results of the trials involving higher fly ash contents. Here, the performance is compared for inter-grinding and grinding the fly ash alone. Firstly, it is seen that the strength of the reference mixed sample is lower than that of the reference cement sample. That can be attributed to the higher fly ash content. Secondly, it can be concluded that, for the cases in which only the fly ash was ground, the results of the strength tests were lower than those of the reference cement sample. For a 45 % ash content (d50 of 11.2 μm), a 5.1 % decrease was determined. The behaviour of the cement mortar was found to change when the fly ash and cement were inter-ground. As can be gathered from the plots, in the cases marked by ash contents of 30 % and 45 %, the respective 28-day strength values were determined as 66.9 MPa and 58.8 MPa. Both were well above the strength of the reference cement sample (56.1 MPa). It can be concluded that inter-grinding is beneficial for strength development and counts among the available options for utilizing larger amounts of fly ash in cement production with no loss of early-age strength. In these cases, the behaviour of the cement mortar can be attributed to the formation of new cement surfaces. This study is deemed to be a contribution to the overall investigative effort regarding the effects of inter-grinding on product quality. Grinding the fly ash together with the cement particles could contribute much more to strength development.
3.3 Setting time
Within the scope of this study, the influences on the initial and the final setting times of the cement mortar were also discussed. The results are tabulated in Table 9.
The data given in Table 9 conclude that the results are sensitive to changes in the mode of grinding, the fineness of the product and the ash content of the cement mortar. The differences between the ash contents can be followed from the results obtained for the reference cement sample and the reference mix sample. As the fly ash content increased from 18 % to 30 %, the setting times changed drastically. In addition, for the cases in which only the fly ash was ground, increasing the content from 30 % to 45 % further lengthened the setting times. Atakay [4] reached similar conclusions when the setting time was found to increase in dependence on increases in the ash content. Celik et al. [23] proved that adding 30 % fly ash to cement mortar extended the initial and final setting times by 50 min. and 75 min. respectively. Further increases in fly ash content also led to higher setting times. In their study, Songpiriyakij and Jaturapitakkul [18] assessed the setting times as functions of changes in the fly ash content. They concluded that the setting times increased gradually from 15% to 35 % fly ash.
The influence of variations in fineness on the setting time can be deduced from the results of 30 % contents with only the fly ash having been ground. As can be seen, reducing d50 from 19.2 μm to 16.6 μm decreased the initial and final setting times by 30 min and 55 min, respectively. Final evaluations revealed the influences of inter-grinding. The inter-grinding of fly ash and cement was found to have yielded greater fineness than for the rest of the samples, and such a change reduced the setting time to near the results obtained for the reference cement sample. As a conclusion, in terms of setting time properties, using a larger amount of fly ash was only possible when inter-grinding took place. In that case, a 30 % fly ash content was found to be the limit for this type of fly ash in cement, since a 45 % content was seen to have increased the setting time.
3.4 Grinding behaviour of cement and fly ash in the mixture
In the further analysis, the grinding behaviour of the fly ash and cement were investigated in a laboratory batch operated mill. In this context, the mixture was ground for 15 min and 30 min, respectively, then the size by distribution of the components was calculated. Such analysis was believed to give an explanatory impression of why inter-grinding was more beneficial regarding strength improvement.
A Bond ball mill was utilized for the grinding tests, and a mixture containing 15% fly ash and 85 % CEM II/A-M (P-L) 42.5R was prepared. In that mixture, the total fly ash content actually reached 32 %, as 20 % of the CEM II type cement consisted of fly ash. The size distributions of the feed and the ground products are tabulated in Table 10.
Following the grinding tests, the obtained products were separated into their components as fly ash and others, since the main objective was to study the behaviour of the fly ash. The fly ash content of cement is determined as prescribed in CEN/TR 196-4. Table 11 summarizes the results of the measurements, while Table 12 gives the results of the size-by calculations.
As can be understood from Table 11 and Table 12, the fly ash and the other components show different behaviour. For the 15 min of grinding time, the fly ash had a coarser size distribution than did the other components. This means that there is a certain energy level for the fly ash to be ground so finely that the strength properties can develop. On the other hand, the results of 30 min of grinding showed that the fly ash had a finer size distribution compared to the rest of the components. As a result, the improvement in strength properties with the size of the mixture can be attributed to this behaviour on the part of fly ash. Therefore, the size limit for strength development can be investigated with this procedure.
3.5 Optimization of the ash classification plant
Comprehensive studies conducted around the ash classification plant ensured evaluation of the alternatives for improving the production efficiency of the circuit. As tabulated in Table 7, the streams through the classifier displayed mutually similar size-quality development, meaning that all the streams can be used as additives in cement mortar when they are ground down to the desired degree of fineness. For these cases, the production rate could be accelerated. That will certainly lead to reduced energy consumption within the classification operation while increasing the throughput of the circuit. Figures 13 and 14 depict some possible applications for fine grinding technologies in the ash classification plant. In the assessments of the circuit configurations, attention was focussed on dry stirred milling, which had previously been studied by Altun et al. in 2013 for the cement grinding operations.
As can be seen, the coarse product of the classifier can be processed in a downstream mill and forwarded from there to the final product silo, since the qualities of both products (fine and ground coarse) are supposed to be mutually similar (Figure 13). In addition, it was found that inter-grinding the fine ash could improve the strength of the cement. Hence, this option was also considered (Figure 14). For a more detailed evaluation, it will be necessary to determine the energy consumption of the dry stirred milling technology for this specific application. That will be given closer study in the future.
4 Conclusions
This study evaluates the performance of an ash classification plant by analyzing the quality developments of the streams running through the classifiers. In brief, the studies were conducted in three parts, i.e.:
Part 1, the size distribution of the classifier fine stream was varied by adjusting the classification parameters, after which the sample strengths were determined by mixing with unground cement (25 % ash – 75 % cement)
Part 2 investigated the grinding of the classifier feed, fine and coarse streams and mixing them with unground cement to monitor the quality developments (25 % ash – 75% cement)
Part 3 evaluated the differences between inter-grinding of ash-cement samples and grinding of fly ash only for mixing with unground cement. These studies were confined to the fine ash
In Part 1, it was concluded that, as the fine stream became increasingly fine, the 7-day and 28-day strength increased, with 10 % and 7.8 % yielding the finest product.
In Part 2, the studies showed that the strength values of all streams increased as a function of fineness. In addition, it was proven that, for one and the same median size of stream, the similar strength values were obtained. Consequently, the coarse stream, which had been termed as waste, can be utilized if it is ground to the desired degree of fineness.
Part 3 of the test program was aimed at investigating the influences of inter-grinding increasing proportions of fly ash with cement. The results proved that the strength of inter-ground samples was higher than that of the mixed samples, which included ground fly ash and unground cement. As a result, the proportion of fly ash was able to be increased up to 45 % and still show a 4.6 % higher 28-day strength value than the reference sample. For a 30 % fly ash content, the 1-day strength of the inter-ground mixture was 57 % higher than that of the non-ground mixture and 29 % higher than that of the reference cement sample. Consequently, it can be concluded that inter-grinding is beneficial for strength development and can be regarded as an optional solution for utilizing larger amounts of fly ash in cement production. Taking the quality findings into account, the optimization options for ash classification plants were discussed in terms of fine grinding technology. This evaluation may lead a plant to better capacity utilization and improved energy efficiency.
Within the context of this study, the behaviours of the components after the grinding operation were investigated to explain how inter-grinding affected their distribution. The studies concluded that fly ash and the other components of the cement behaved in different ways, depending on the length of grinding. As the grinding period lengthened, the size distribution of the fly ash in the mixture became finer than that of the other components. That, ultimately, could have a beneficial effect on product strength properties.
Überschrift Bezahlschranke (EN)
tab ZKG KOMBI EN
This is a trial offer for programming testing only. It does not entitle you to a valid subscription and is intended purely for testing purposes. Please do not follow this process.
This is a trial offer for programming testing only. It does not entitle you to a valid subscription and is intended purely for testing purposes. Please do not follow this process.
tab ZKG KOMBI Study test
This is a trial offer for programming testing only. It does not entitle you to a valid subscription and is intended purely for testing purposes. Please do not follow this process.
This is a trial offer for programming testing only. It does not entitle you to a valid subscription and is intended purely for testing purposes. Please do not follow this process.