The development of the Chinese cement industry in 2013 and 2014
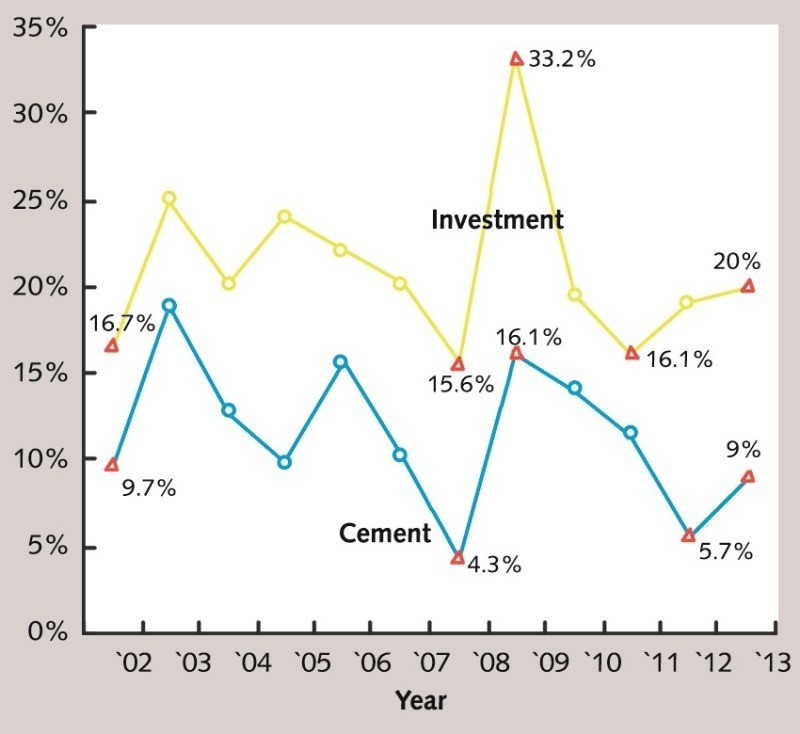
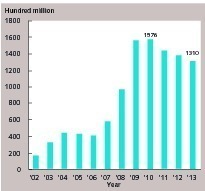
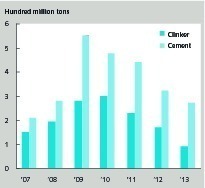
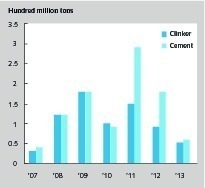
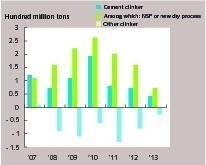
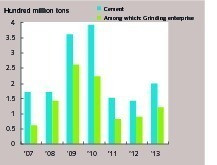
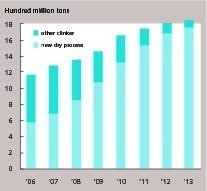
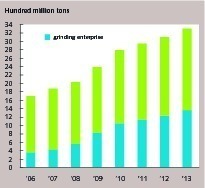
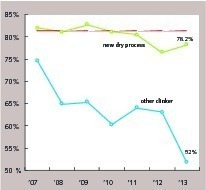
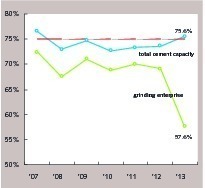
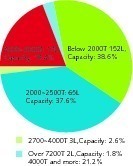
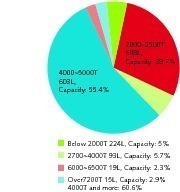
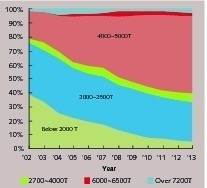
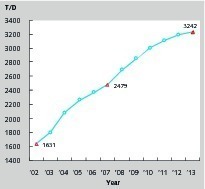
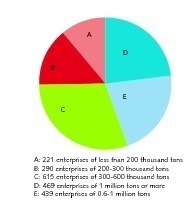
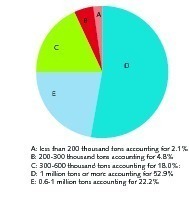
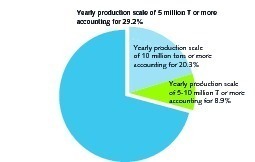
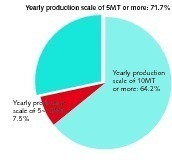
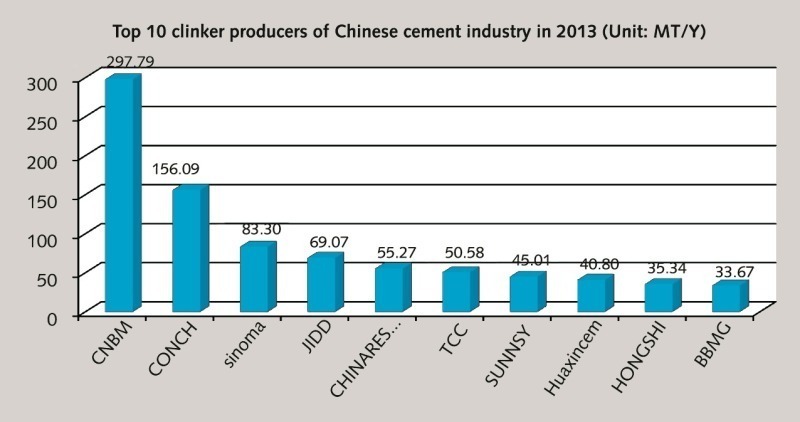
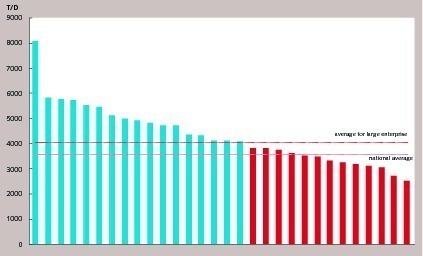
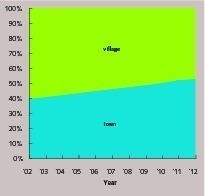 Fig. 21 Composition of national population in towns and villages
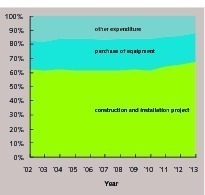 Fig. 22 Composition of national fixed assets investment (exclusive of rural household)
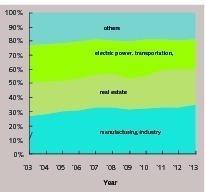 Fig. 23 Composition of national fixed assets investment industries

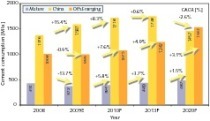
In China, the national cement output grew at 9 %, reaching more than 2.4 billion tons in 2013. However, the growth rate of cement capacity began to slow. The output in 2014 is estimated to be nearly 2.6 billion tons, with a growth rate between 6 % and 8 %. The proportion of large new dry process production line capacity is more than 60 %, with a cement production integration degree of more than 70 %. The growth of cement output is beginning to reach its peak.
1 Introduction
According to preliminary statistics, China’s cement output will be more than 2.4 billion tons and account for over 60 % of the global cement in 2013. Such high output induces concerns and questions as to whether China’s cement production is near its peak limit or whether there will be a marked decline. This article provides a comprehensive introduction of the development history during the past few years, current development status, and expectations for the next few years with regards to China’s cement industry.
In recent years, a serious overcapacity has occurred in China’s...
1 Introduction
According to preliminary statistics, China’s cement output will be more than 2.4 billion tons and account for over 60 % of the global cement in 2013. Such high output induces concerns and questions as to whether China’s cement production is near its peak limit or whether there will be a marked decline. This article provides a comprehensive introduction of the development history during the past few years, current development status, and expectations for the next few years with regards to China’s cement industry.
In recent years, a serious overcapacity has occurred in China’s cement industry. This is due to the investment stimulation used for years to boost economic growth, especially in confrontation with the global financial crisis in 2008. Government and industry are correcting these issues, and in the past 3 years, the investment in the cement industry has slowed. However, due to the economic development stimulus, which has occurred for many years, the cement industry continues to have relatively high growth inertia. The national cement growth peak is estimated to reach its upper limit in 2015. From 2016 to 2020, the cement industry will experience a stable development state. Forecasts indicate that beginning in the year 2020, China’s cement industry will experience a great decline.
In the following section, China’s cement status in 2013 and its expectations after 2014 will be introduced in detail.
2 Government starts to control the fixed assets
investment in cement
The cement industry’s growth is strongly correlated to fixed assets investment. After the financial crisis, the national economy changed the industry structure in 2011 and the yearly growth rate of fixed assets investment of the whole society (exclusive of variable factors of investment price) fell back to 16.1 %, therefore, the yearly growth rate of cement output for 2012 was reduced at once to 5.7 %. After 2012, in order to sustain steady economic growth, fixed assets investment was increased to 18-20 % again, which leads to a national cement production of 2.4 billion tons in 2013. This is an estimated increase of 9 % compared to 2012, which shows a slight rebound in the growth rate (Fig. 1). Despite the decline in cement investment, compared to that before 2010, the fixed assets investment in cement remains higher than the level before 2008 (Fig. 2).
As shown in Fig. 2, to deal with the financial crisis, the investment in infrastructure increased beginning in 2008. This increase led the national cement capacity to increase for three consecutive years, which leads to severe industrial overcapacity. Beginning in 2011, the nation set out to control the investment in the cement industry.
However, it is difficult to realize a national economic transition. The growth mode powered by multi-year investment is difficult to transform into consumption stimulation especially in a very short period of time. Due to the annual population growth of more than 10 million people in previous years, the economic growth has to be kept above 7 % to ensure their employment. At least half of this growth must result from investment stimulation. Therefore, in order to sustain stable growth in the economy in the latter half of 2013, the national credit investment was increased for a second time, allowing the available cement capacity to grow from 70 % to above 75 % again.
The government is currently in a dilemma with regards to its policy. Should investments diminish, the annual population growth of nearly 10 million and their employment will be in jeopardy. Should the economic growth mode powered by investment continue, the growth of cement capacity and production will remain high. This could result in a collapse of the market when saturation is reached because up to 60 % of the global output will suddenly be unutilized.
According to our estimation, the average urban footprint per person in China is close to 40 square meters in terms of building area for living, with an annual growth rate of more than one square meter and will reach a saturation level of nearly 45 square meters per capita in 3 to 5 years. The infrastructure per capita has a great deal of room to grow as it is currently only 1/2-1/3 of that of developed countries.
2.1 The increment in cement capacity is obviously reduced
China has realized the potential damage incurred by high growth in the cement industry and issued a series of policies that prevent the growth of the cement capacity, which has led to a continuous decline in fixed assets investment in the cement industry for 3 years. The sum of fixed assets investment above normal in the cement manufacturing industry is estimated to be 131 billion yuan, reduced by 5 % compared to that in 2012 (Fig. 2). However, due to the decline of the national macro-economy and for the economy to continuously grow, China began increasing the investment in the infrastructure and expanded the credit to realize “volume and price simultaneously rising” for the cement industry in the latter half of 2013. Parts of the production lines that could be commissioned began production at the end of the year and amounted to more than 70 additional lines producing an increase in cement clinker capacity of more than 80 million tons. By November 2013, the capacity of cement increased by 247 million tons, of which the cement preparation capacity for grinding stations was 100 million tons. The increased cement capacity during the year was estimated to be over 270 million tons.
By November 2013, 136 new cement production enterprises had emerged and 26.23 million tons of cement clinker capacity was added, which included 23 new dry process (NSP) production lines, 24.79 million tons of capacity, and 1.44 million tons of other clinker capacity. The newly added cement capacity was 93.23 million tons, of which there were 107 cement grinding enterprises and 61.69 million tons of cement preparation capacity.
Nevertheless, compared to the past, the growth in 2013 was marginal. For example, 237 new dry process production lines and 300 million tons of clinker capacity were added during 2010. After 2010, the investment in new capacity lines and, therefore, clinker capacity decreased each year. The increased production line amount and capacity of cement in 2013 were at the level of 2003 (Fig. 1, Fig. 3 and Fig. 4). After introducing the policy of “four billion” investment stimulation in 2009, the increased capacity of cement for that year reached 550 million tons. The annual increase in cement capacity gradually reduced after 2009 and the growth capacity in 2013 was even lower than that in 2008 when the financial crisis took place (Fig. 3).
China needs to control the cement industry growth which is difficult to do because it depends on the growth to support overall growth in the economy. In all, the industry is in a dilemma.
According to the latest news, the Ministry of Industry & Information Technology decided that for the next 3 years (2014-2017), the state will no longer approve new cement production line construction.
2.2 The pace of reducing/eliminating the backward cement capacity is slowed
Based on the situation in the first 11 months in 2013, the backward clinker capacity was estimated to be reduced by 52.26 million tons in 2013; of which there were 34 small NSP production lines, 17.58 million tons of clinker capacity, and 34.68 million tons of capacity of other clinker, such as that from vertical kilns, etc. Cement capacity was reduced by 61.50 million tons, of which there were 109 grinding enterprises and a cement preparation capacity of 31.83 million tons.
There were 118 enterprises that shutdown clinker production lines in 2013 affecting 28.87 million tons of clinker capacity while retaining a cement preparation capacity of 49.11 million tons. There were 157 enterprises that completely shutdown the clinker and cement capacity affecting 16.76 million tons of cement clinker capacity and 55.15 million tons of cement capacity.
After 2008, with the rapid development of the new dry process capacity, the capacity of non-new dry processes, such as vertical kilns, were gradually eliminated and replaced. The years 2008 and 2009 experienced the peak of cement clinker capacity reduction, with 120 million and 180 million tons of reduced cement clinker capacity respectively. The accrued reduction of cement clinker capacity in 2008-2012 was 650 million tons. The year 2010 saw the peak of cement capacity reduction with 290 million tons of reduced cement capacity. The accrued reduction of backward cement capacity in 2008-2012 was 870 million tons. The proportion of NSP cement production is now more than 90 % indicating the elimination and replacement of traditional process capacity by cement production with the NSP process. After 2011, the yearly reduction of backward clinker and cement capacity gradually decreased (Fig. 4).
2.3 Current clinker and cement capacity and number of enterprises
After 2003, even though the new dry process clinker capacity and corresponding cement capacity rapidly grew, the yearly net increase of clinker and corresponding cement capacity remained stable. This is attributed to the reduction of other clinker production methods, such as in the vertical kiln, and the corresponding cement capacity. After the yearly increment of clinker and cement capacity reached its peak in 2010, the yearly net increment gradually reduced (Fig. 5 and Fig. 6).
With the continuous construction of new dry processes and the continuous elimination of vertical kilns, the final result is that the capacity increase is more than the replaced capacity. The yearly net increment of cement clinker in 2008-2010 gradually increased by year, however it decreased yearly after 2010. In 2013, the new dry process clinker capacity was estimated to have a net increase of 70 million tons while other clinker capacity was reduced by 30 million tons. Therefore, the total cement clinker capacity had a net increase of more than 40 million tons as compared to that in 2012 and the total capacity of clinker reached more than 1.84 billion tons by the end of the year (Fig. 5 and Fig. 7). After 2010, the yearly increment of cement capacity reduced, but in 2013, the cement capacity reduction slowed and the newly increased grinding enterprises capacity continued to increase. In addition, the cement preparation capacity that should have been shut down from the kiln production line enterprise continues to exist, and therefore the overall cement capacity increased to some extent. In 2013, the net increment of cement capacity was estimated to reach more than 200 million tons, of which the net increment of grinding enterprises reached over 120 million tons. By the end of the year, the total cement capacity was expected to exceed 3.27 billion tons, of which the cement preparation capacity of grinding enterprises was expected to surpass 1.35 billion tons (Fig. 6 and Fig. 8).
Before 2008, the number of cement production enterprises in China was steady at around 5000 and reduced to less than 4000 in 2011. By November 2013, there were 136 new cement production enterprises added and 157 were shutdown bringing the total number of cement production enterprises to approximately 3500 at the end of 2013.
2.4 The availability of cement capacity rises again
In 2013, the extreme growth in cement capacity was relatively contained, but due to continued economic growth and the increase in credit investment, the utilization rate of cement capacity rose again. In 2013, the availability of cement clinker capacity was estimated to reach more than 78 %, which is a rebound compared to 2012, but remains lower than the average level in years 2007-2011 (Fig. 9). In 2013, the utilization rate of cement capacity is expected to recover to above 75 %, and this is the first time the utilization rate will surpass 75 % since 2007. However, due to the rapid increase of newly added grinding enterprise’s capacity, as well as the partial backward cement enterprise’s shutdown, while a part of them transformed into grinding stations, so, the utilization rate of cement grinding enterprises greatly declined in 2013 (Fig. 10).
3 Current technical structure of cement production
The first NSP production line for cement in mainland China was put into operation in November 1983. By November 2013, 1733 new dry process production lines had been constructed in mainland China. Since 2002, there have been 171 low-effective NSP kilns successively shutdown and 1562 new dry process production lines (NSP) brought into operation. The development of the new dry process for cement production in China, especially the rapid development after 2003, effectively replaced the traditional vertical kiln process. The cement production process structure in China has significantly changed.
3.1 Enlargement of new dry process production line scale
The development of a new dry process production line boosts the expansion of the production scale of domestic cement enterprises. At the end of 2002, among the 238 operational new dry process production lines, there were only 18 production lines with a daily production of 4,000 tons or more each, and the capacity accounted for only 21.2 % of new dry process clinker capacity (Fig. 11). The average daily production scale of the 238 production lines was only 1,631 tons (Fig. 14). After 2008, the daily production scales of the newly constructed new dry process production lines were all above 3,000 tons and the domestic new dry process production line of cement tended to be large (Fig. 13). By November 2013, among the 1562 new dry process production lines in operation, 637 were production lines with a daily production of 4,000 tons or more. That capacity accounted for 60.6 % of new dry process clinker capacity (Fig. 12). The average daily production scale of new dry process production lines increases to 3,242 tons (Fig. 14).
3.2 The cement technical structure still has an adjustment space
It is estimated that by the end of 2013, the capacity of non-new dry process cement clinker, such as from vertical kilns, will be reduced to less than 100 million tons, accounting for 5 % of the national clinker production. There are more than 400 production enterprises, of which there could be more than 300 enterprises with a yearly clinker capacity of less than 300 thousand tons and their yearly clinker capacity nearly 50 million tons.
By November 2013, there were 224 new dry process production lines in operation with a daily production of less than 2,000 tons, a capacity accounting for 5 % of new dry process clinker capacity (Fig. 12), and actual yearly clinker productivity of about 90 million tons.
Since 2003, the increasing price of energy and the constantly rising energy consumption costs for cement enterprises have facilitated the rapid development of the new dry process. From now on, the energy costs will still be the main factor that boosts the adjustment of capacity, process, and scale structure of cement and clinker. The production lines with high energy consumption will be eliminated by the market due to high costs.
3.3 The technical structure of cement grinding enterprises
By November 2013, there were 2034 cement grinding enterprises with a cement capacity of 1.34 billion tons, accounting for 41.1 % of the total cement capacity. This includes 469 cement grinding enterprises with a yearly production scale of over 1 million tons and productivity accounting for 52.9 % of the grinding enterprises capacity; 439 enterprises of 0.6-1 million tons with capacity accounting for 22.2 %. The grinding enterprises with a capacity of more than 0.6 million tons account for 75.1 % and the 1126 enterprises of less than 0.6 million tons account for more than half of all grinding enterprises, but their capacity accounts for only 24.1 % of the total (Fig. 15 and Fig. 16).
Limited by the production scale, the overall power consumption of small grinding enterprises is much higher than that of large enterprises and the labor productivity is much lower than that of large enterprises. Similarly, due to the same limitation of production scale, the environmental protection investment and operation costs of unit products are also much higher than those for large enterprises. An increasingly harsh demand for environmental protection of cement production, high operation costs, and environmental protection expenditures together will lead small grinding enterprises to gradually cease cement production and retract from the market, further reducing the amount of cement grinding enterprises in the industry.
4 The production concentration of
cement enterprises increases
Since 2003, especially after 2007, with the development of the new dry process and large cement grinding stations, the intensive degree of cement production has significantly improved and the large enterprise groups have established their dominant status in the cement industry.
4.1 The production intensive degree of enterprises in Top 57 is over 70 %
In 2007, there were 31 enterprises and enterprise groups with yearly production scales over 5 million tons, and the cement clinker productivity accounted for 29.2 % of national cement clinker productivity that year, with cement productivity accounting for 22.8 %. The amount of enterprises and enterprise groups that have a yearly production scale of more than 10 million tons were only 11 (Fig. 17) and cement clinker productivity accounted for only 20.3 % of national cement clinker productivity that year with cement capacity accounting for only 15.6 % of the total.
In 2013, there were 57 enterprises and enterprise groups with a yearly production scale of more than 5 million tons and more than 1000 new dry process production lines. The cement clinker productivity by the end of the year will surpass 1.3 billion tons accounting for 71.7 % of the national cement clinker capacity (Fig. 18). The cement capacity will surpass 1.7 billion tons accounting for 52.3 % of national cement productivity and the produced cement clinker for the year will exceed 1 billion tons accounting for 74.9 % of the national cement clinker production. In addition, cement production will surpass 1.3 billion tons accounting for 55.4 % of the national cement production. In 2013, there were 3 enterprise groups with a cement production scale which exceeded 100 million tons in China. The number of enterprises and enterprise groups with a yearly production scale of more than 10 million tons was 30 (Fig. 18 and Fig. 19) and the cement clinker productivity accounts for 64.2 % of the national cement clinker capacity, with cement productivity accounting for 46.9 % of the total.
4.2 Obvious gap in technical management level among large enterprise groups
Since 2007, the large cement groups have experienced rapid development and established their dominance in the cement industry. However, the contradictions and problems during the development process of the cement industry in China can be partially attributed to the large enterprise groups. There are obviously some gaps between cement enterprises and enterprise groups in China with respect to average scale of production line, energy consumption of unit product, and labor productivity, as well as enterprise techniques and management level reflected in unit product cost. Due to the existence of these gaps, further competition, elimination, and integration of the industry are forthcoming. The superior enterprises will merge with the inferior ones, which will further improve the concentration of this industry.
The average daily production scale for the new dry process production lines of 57 enterprises and enterprise groups with a production scale of more than 5 million tons is 4024 tons, higher than the average daily production scale of 3575 tons for national new dry process production lines. The difference in the daily production scales for the new dry process production lines in large enterprise groups is very obvious. In the former 30 enterprises and enterprise groups, Hainan Huasheng and Yadong both have production lines with a daily production of 4000 tons or more and the average daily scale for the new dry process production lines of Hainan Huasheng, Tianrui, Taini, Yadong, Conch, Jiangsu Jinfeng and Henan Tongli surpasses 5,000 tons. Meanwhile, there are also 9 enterprise groups with production line capacity of a daily production of 4,000 tons or more and 13 enterprises and enterprise groups with an average daily production scale for the new dry process production lines of less than 4000 tons (Fig. 19 and Fig. 20). The difference in average daily production scale for the production lines reflects the difference in aspects of the technical economical index such as unit products’ consumption and labor productivity among large enterprise groups. This attributes to the difference in unit products’ costs among large enterprise groups and highlights those enterprises that are competitively strong and those that are competitively weak.
5 Prediction of national cement production
and sales in 2014
By November 2013, a preliminary statistic showed that there are currently 376 new dry process production lines for cement under construction with a clinker capacity of 330 million tons and a cement capacity of 520 million tons. The cement industry is still faced with a huge pressure of capacity under construction. However, the release of the growth rate and capacity under construction of cement production remains dependent on the growth of the cement market demand. In 2013, the national cement output was expected to exceed 2.4 billion tons, an increase of 9 % compared to 2012. In 2012, the growth rate of cement production for the year fell to 5.7 % due to cement sales being influenced by the reduced growth rate of national fixed assets investment in the previous year as well as climatic factors in some regions. The 9 % growth in national cement production in 2013 was a rebound based on the low growth in the previous year (Fig. 1). In 2013, the growth rate of national fixed assets investment was expected to be further reduced by1 to 2 percentage points.
Beginning in August 2013, the cumulative year-on-year growth rate of national fixed assets investment was expected to be reduced continuously for 3 months. The year-on-year growth rate from January to November was 19.9 % and initially fell below 20 %. Looking towards 2014, the growth rate of national fixed investments may fall back to 18-20 %. Market demand for cement in 2014 is steady, but its increasing space is limited. Hopefully, the yearly growth rate of national cement production will not reach double-digit growth as it has in several previous years.
China remains in the process of urbanization and industrialization. In 2010, the proportion of population in towns surpassed 50 % for the first time and reached 52.6 % by the end of 2012. To reach a 70 % rate of urbanization, the new urbanization of the country will take 15-20 years (Fig. 21). According to the composition of fixed assets investment in China, the weight of construction and installation projects has long remained above 60 %. Furthermore, it has increased in recent years reaching 64.9 % in 2012 and is expected to increase to more than 67 % in 2013 (Fig. 22). The weight of the purchase costs of equipment and instruments in fixed assets investment in China has been kept at around 20 % for years, which indicates the investment organic composition is not high and the investment is mainly focused on industry, infrastructure, and real estate. Calculated based on the construction and installation project costs of more than 20 trillion yuan, construction material, including steel and cement, worth more than 8 trillion yuan will be needed annually. It is confirmed that in the future 3-5 years; the need for cement will be kept at a relatively high level. Even if the peak may come, the need for cement will remain at a relatively high level within 10 to 20 years of uncompleted urbanization. Even though it will decrease, and it will be a gradual reduction if controlling well by the industry and the government policy.
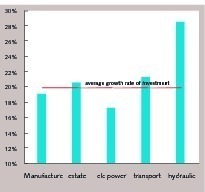
The manufacturing industry, real estate, and infrastructure such as electrical and heating power industry, transportation, hydraulic, and environment, are the industries in which China mainly invests fixed assets. In 2013, the investment in the manufacturing industry and in real estate accounted for 34.5 % and 25.5 % respectively of fixed assets in China. Infrastructure such as electrical and heating power, transportation, water resource, and environment accounted for 20.9 % (Fig. 23). For the first 11 months in 2013, the investment in the manufacturing industry and the electrical, thermal power industry was lower than the average growth rate of national fixed assets investment. Conversely, real estate and transportation, especially the water conservancy and environment investment is higher than the average growth rate (Fig. 24). In 2014, the stimulation factor of national fixed assets investment to cement demand remains active.
In summary, the national cement production may be close to 2.6 billion tons with a yearly growth rate of 6 % to 8 % in 2014. According to our estimate, the peak of China’s cement industry will be reached before or after 2015 but no later than 2018-2020.
Überschrift Bezahlschranke (EN)
tab ZKG KOMBI EN
This is a trial offer for programming testing only. It does not entitle you to a valid subscription and is intended purely for testing purposes. Please do not follow this process.
This is a trial offer for programming testing only. It does not entitle you to a valid subscription and is intended purely for testing purposes. Please do not follow this process.
tab ZKG KOMBI Study test
This is a trial offer for programming testing only. It does not entitle you to a valid subscription and is intended purely for testing purposes. Please do not follow this process.
This is a trial offer for programming testing only. It does not entitle you to a valid subscription and is intended purely for testing purposes. Please do not follow this process.