Mathematical separator performance evaluation
Separators in the cement industry have the task of separating coarse from fine material, and it is worthwhile to fully understand the function of separators in raw and cement mills. Consequent troubleshooting, the elimination of technical barriers and optimum processing will result in an increase in the final product of the mill.
1 Introduction
For the stable operation of a cement mill it is essential to know its...
1 Introduction
For the stable operation of a cement mill it is essential to know its performance. For this purpose first a number of parameters is selected, then the information obtained is evaluated by calculating each parameter. These parameters include: circulating load, throughput of coarse and fine material per hour, separating efficiency, softness parameters and uniformity coefficients as well as the position of the cut point and the bypass point.
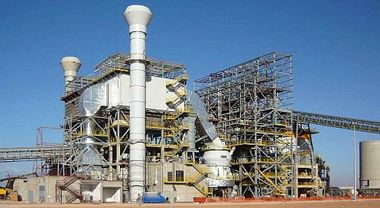
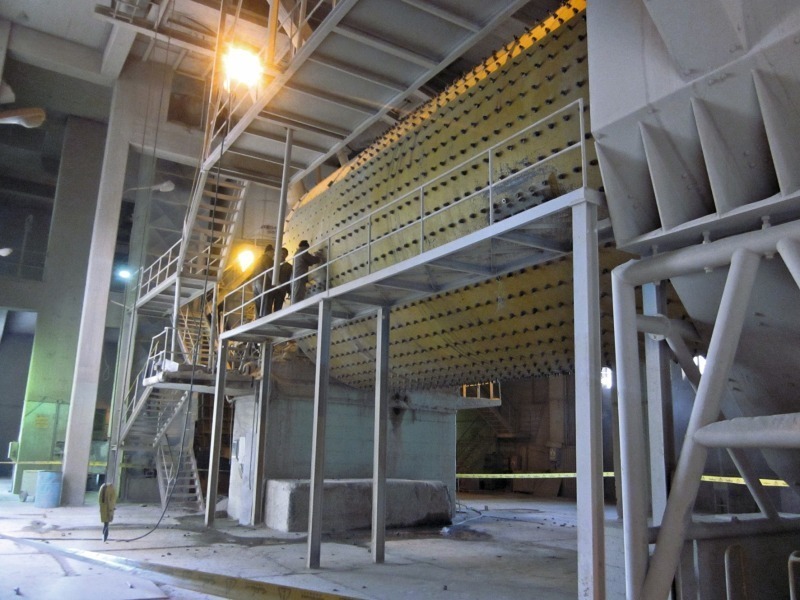
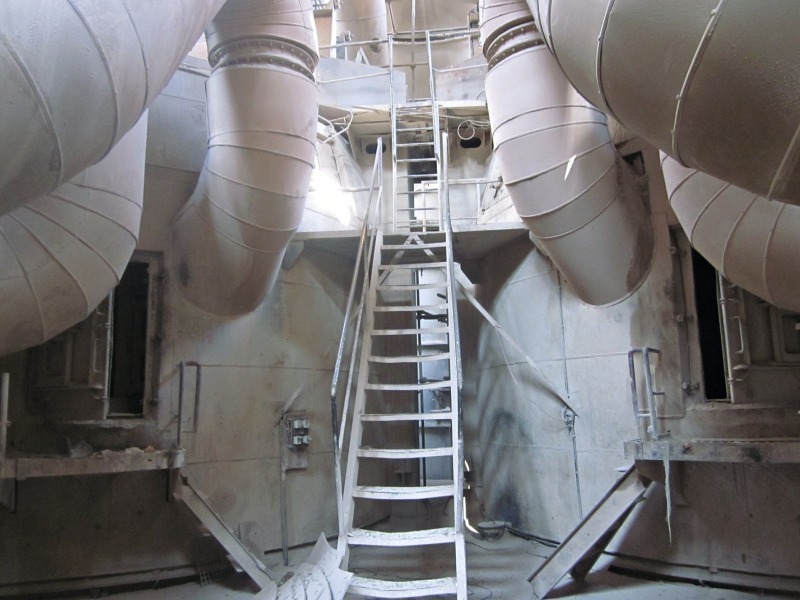
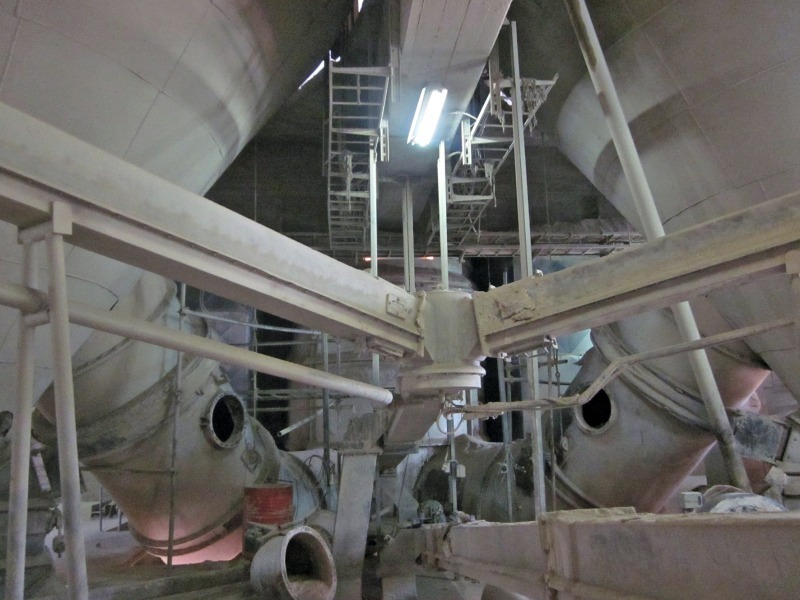
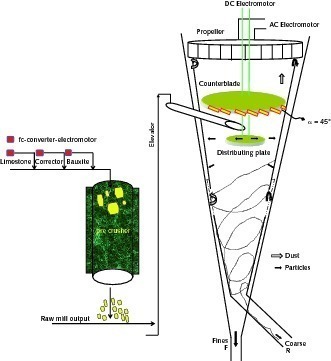
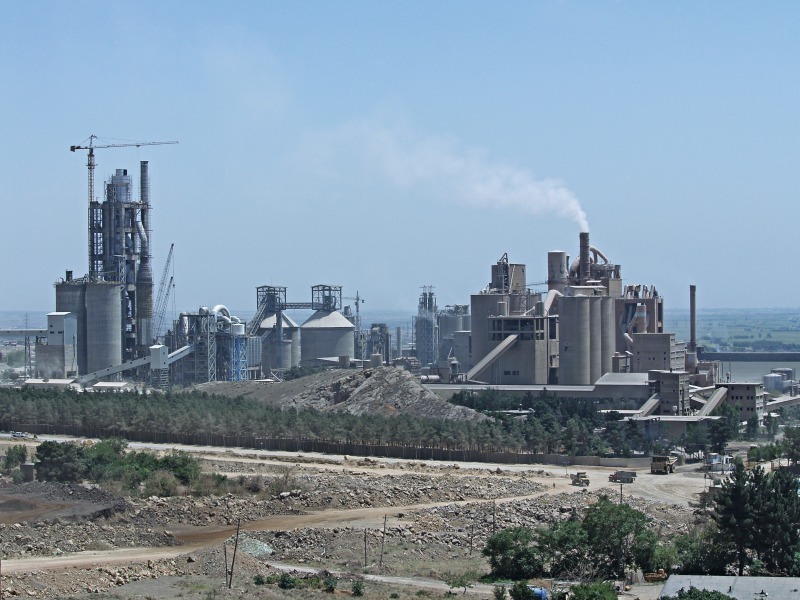
The plant raw material includes limestone, clay, bauxite, iron ore, pozzolan, gypsum and other addi-tives. Most of these materials are supplied from open pit mines, which lie close to the factory. Bauxite, iron ore and gypsum are purchased. Today, the sales of cement have risen to an overall amount of 13 000 t/d. The total number of staff including the head office is 1651 persons. Detailed views of some of the raw mill no. 6 are shown in Figures 1–3.
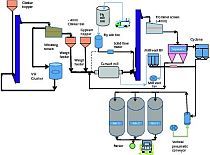
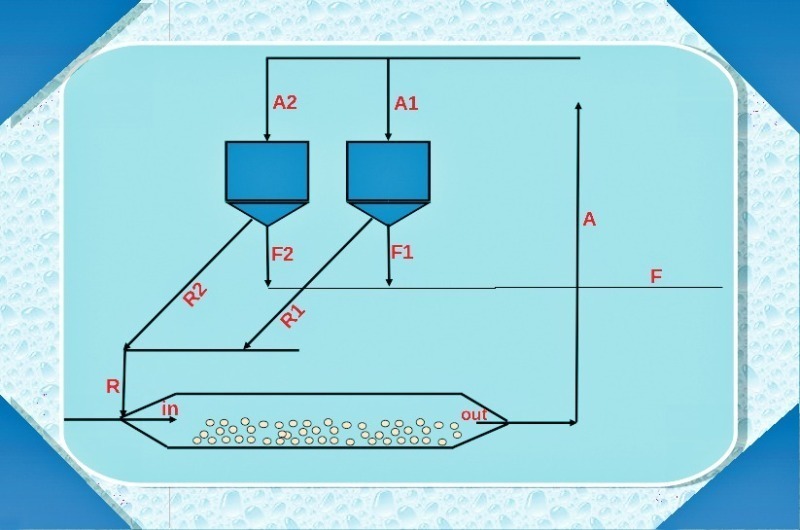
Line 6 of the Teheran cement factory presents the most important unit of the plant. At a nominal capacity of 4000 t/d clinker, it is equipped with a single chamber ball mill. The capacity of this mill is 385 t/h. The output of the mill crusher and the output of the ball mill enter two elevators, each forwarding the material to two separators. Figure 4 shows schematically the route of the input and output through the mill and the separators.
2 Separator settings
Set point limestone = 270 t/h
Set point corrector = 25 t/h
Set point bauxite = 10 t/h
In connection with the separator, the following cases are considered:
The propeller is driven by an AC electric motor with invariable rotation.
The angle of the blades in the counter is invariable and equivalent to 45 degrees. The blades are embedded to break up large particles and deliver them to the inner wall of the separator.
The distributing plate is driven by a DC electric motor with variable speed.
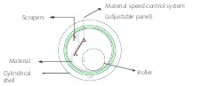
The suction fan separator is changed by a DC electromotor with variable rotation. So there are two regulators where the operator can adjust the fineness of the product (different parts of the separator are shown in Figure 5.).
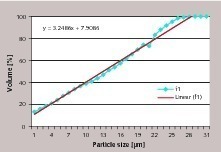
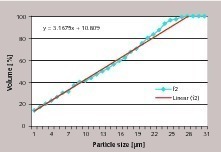
3 Particle size distribution curve
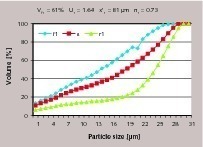
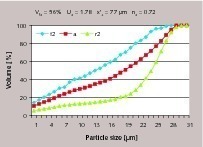
Based on Table 1, the percentage of the feed passing through the sieve of 9 μm is equivalent to 19.45 %. Obviously, the percentage of coarse material passing through this sieve is lower and the percentage of fine material passing through it is higher. As shown in Table 1, the passing percentage of fine samples from separator 1 on sieve No. 615 μm is 100 %. The sieve referred for the separator 2 is 515 μm.
As shown, the passing percentage of coarse samples from the separators 1 and 2 on sieve No. 735 μm is 100 %, but passing percentage of feed sample on sieve within No. 515 and 735 μm is 100 % (sieve 615 μm). Figures 6 and 7 show the particle size distribution for samples of the separators 1 and 2.
4 Circulating load
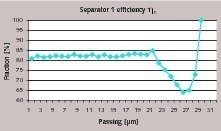
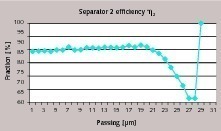
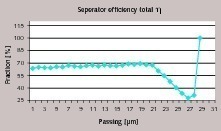
5 Separator efficiency [2]
Regarding figures 8, 9 and 10, the following results can be concluded:
Highest efficiency of the separator 1 for a diameter of 150 μm is achieved.
Highest efficiency of the separator 2 for diameters 75 and 105 μm is achieved.
Highest efficiency of both separators with diameters 75 and 105 μm is achieved.
6 Percent of the fine and coarse separator [2]
1806.15 – 933.39
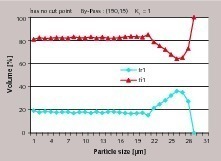
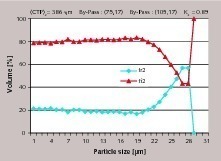
7 Tromp curve
8 Cut point, bypass and separation of sharpness
For the effective and accurate separation and distribution d25 and d75 should have close values. Low value of k means that distribution is appropriate. The ideal value of k is 1 (kideal = 1), so the separation of sharpness for the separators1 and 2 is obtained as follows:
9 Softness parameters and uniformity coefficient
So, softness parameter and uniformity coefficient for the separators1 and 2 are as follows:
10 Analysis
The percentage of fine material passing through the sieves should be greater than the percentage of the separator feed. Also, the percentage of feed passing should be greater than the coarse material.
Numbers smaller than 1 for the circulating load are not acceptable.
Numbers greater than 100 for the separator efficiency and the tromp curves are not acceptable.
The cut point for the separators can exist or not.
The separator can have more than one bypass.
The separation of sharpness (k) can be smaller or larger or equal to 1.
The circulating load of the mill is equal to 1.7. The concept is, that grinding of the charge distribution is appropriate, and the mill feed material size is not larger than standard.
The separator efficiency is desirable. This means that the fine and the coarse material are well separated.
Furthermore, because the output of the mill reduces as a result of the small circulating load in the mill, thus the elevator’s amps reduce and power consumption is optimized.
Also the elevators will require less time for inspection and mechanical repairs. The decrease in the wear rate of equipment and separator’s amps should also be considered.
According to the tromp curves (Figures 11, 12), it is clear that the separator1 does not have a cut point, in other words, the probability of the particle being placed in fine and coarse section at the same time is negligible.
The percentage of fines in the separator1 is more than separator 2, so that the conclusion is that the efficiency of separator1 is greater than separator 2.
It should be noted that, apart from softness parameter, main modules, mineral and chemical analysis, geometry minerals forms and other variables influences on the cooking, that is out of the scope of this article. Of course due to the uniformity coefficient, it is clear that uniformity of the final product and the mill performance is desirable. Therefore higher uniformity in fines of separator 1, again confirms the better performance of separator 1.
Generally, the mill performance was good, on the other hand, in all cases, the performance of separator 1 is better than the separator 2, so with inspection of the separator department and the evaluation of the operational parameters, the performance of the separator 2 will be upgraded.
Überschrift Bezahlschranke (EN)
tab ZKG KOMBI EN
This is a trial offer for programming testing only. It does not entitle you to a valid subscription and is intended purely for testing purposes. Please do not follow this process.
This is a trial offer for programming testing only. It does not entitle you to a valid subscription and is intended purely for testing purposes. Please do not follow this process.
tab ZKG KOMBI Study test
This is a trial offer for programming testing only. It does not entitle you to a valid subscription and is intended purely for testing purposes. Please do not follow this process.
This is a trial offer for programming testing only. It does not entitle you to a valid subscription and is intended purely for testing purposes. Please do not follow this process.