Latest trends in cement and clinker trade
 McInnis Cement
 Holcim Germany
 HeidelbergCement
 HeidelbergCement
 ElPais
 McInnis Cement
 Argos Cementos
 Argos Cementos
 Shun Shing Group
 Shun Shing Group
The cement and clinker trade is under pressure. In this market review global trading patterns are given, main market players are profiled, the Chinese influence is described, examples for sustainable investments and how to become a regional market leader are given and the power of independents is also briefly outlined.
1 Introduction
At the moment, cement and clinker are being traded so cheap that often it does not make much sense to install new local clinker capacity along many coastal areas of the world. Often, it is possible there to source cement for less than 55 US$/t, including freight costs. Clinker can even be sourced for 10 US$/t less than that, or still lower. The situation has resulted in an asset-light approach by a number of cement producers. Instead of new integrated cement plants, grinding facilities are installed which use imported clinker. On the other hand, the large clinker capacity...
1 Introduction
At the moment, cement and clinker are being traded so cheap that often it does not make much sense to install new local clinker capacity along many coastal areas of the world. Often, it is possible there to source cement for less than 55 US$/t, including freight costs. Clinker can even be sourced for 10 US$/t less than that, or still lower. The situation has resulted in an asset-light approach by a number of cement producers. Instead of new integrated cement plants, grinding facilities are installed which use imported clinker. On the other hand, the large clinker capacity additions in recent years have led to an oversupply situation in many world areas. Countries which had previously been important cement importers have become cement exporters. However, there is still room for capacity additions. Investors argue that if they install a big new plant, they are more competitive compared to older and smaller plants and that excess capacity can easily be exported. But this approach is very risky in today’s environment.
2 Global trading patterns
Figure 1 shows how the total global cement and clinker exports (cross-border) have developed in the last five years. The data were derived country by country from the many cement producers’ associations and major cement producers, or from the statistical offices of the countries if the other data were not available. It shows a dynamic and not static market with large fluctuations. The trade volume increased from 175.6 million tons per year (Mt/a) in 2012 to 197.6 Mt/a in 2014 with Compound Annual Growth Rates (CAGR) of 8.8 % and 3.8 %, respectively, before the trade volume contracted by 4.8 % to 188.2 Mt/a. Finally, last year an increase by 1.8 % led to a trade volume of 191.2 Mt/a. As mentioned before, these volumes comprise all kind of cements and clinker. Other cementitious products such as slag or flyash are not included.
A breakdown of the cross-border trade volumes into cement and clinker is shown in Figure 2. Our revised market figures, with an update of inconsistencies in the figures for cement and clinker by the associations, show that the trade volumes for cement increased only slightly over the years from 132.6 Mt/a to 133.5 Mt/a, while the trade volumes for clinker significantly increased from about 43 Mt/a to 58 Mt/a, which corresponds to an increase of almost 35 %. Accordingly, the clinker share in the sales volumes increased from 24.5 % to 30.3 %. Figure 3 shows how seaborne and land-based trade volumes developed. Seaborne transportation benefited from low shipping rates and were able to slightly increase their market share to 69.7 %. The seaborne trade includes the Great Lakes in North America and Black Sea between Turkey, Russia and Ukraine, while land-based comprises cross-border transportation by rail, trucks and river (barges). Air-based transportation is negligible.
The markets are dynamic and an analysis of the last five years shows that only a few countries have had nearly stable exports or imports. Figure 4 shows the ten countries with major export gains and losses. The largest gains were achieved by Vietnam with plus 6.00 Mt from 2012 to 2016, leading to cement and clinker exports of about 14.7 Mt/a in 2016. Vietnam is followed by China with gains of 5.78 Mt, leading to 17.6 Mt/a in 2016 and Spain with gains of 3.61 Mt, leading to almost 9.8 Mt/a in 2016. Other countries with significant gains were Thailand, Japan, Greece, Indonesia and Morocco, of which the last two are new net exporting nations. South Korea had major losses with 3.79 Mt, leading to cement and clinker exports of 5.03 Mt/a in 2016, down from 8.82 Mt/a in 2012. Accordingly, the losses here are 43 %. The other country with similar losses was Pakistan (-3.71 Mt) leading to losses of 44 % over 2012.
The ten countries with major import gains and losses (2012-2016) are shown in Figure 5. The United States (USA) had the largest gains with 6.46 Mt. In 2016, about 13.5 Mt/a cement and clinker were imported and this figure is expected to increase. The Philippines’ imports increased by 5.6 Mt after a rapid growth in demand. Colombia, with its plus 2.56 Mt is another example for rapid demand growth arising from large infrastructure and housing deficits. The other countries with significant gains were Oman, Algeria, Kuwait, Guyana, Cote d’Ivoire and Kenya. Algeria, however, is another example that in two years the country could become an exporter. Iraq, Russia, Libya, Indonesia and Brazil are the countries with the main import losses. Iraq and Libya are still conflict countries and Indonesia and Brazil are characterized by slow/negative demand growth and large capacity expansions.
It is interesting to see how the regions have developed (Figure 6). Western Europe was able to improve low cement and clinker capacity utilization rates with remarkable export achievements. Exports increased from 31.4 Mt/a in 2012 to 37.3 Mt/a in 2016. Over the five years, Western Europe was responsible for 19.4 % of all global exports, including many within the region to defend against imports from other regions. The terminal and cement carrier situation is excellent (Figure 7). The Far East (excl. China) has the major share in the global exports with 27.5 % and about 260 Mt in 5 years, followed by the Middle East (incl. Turkey) with 20.8 %. The lowest export shares are to be found in Africa (4.4 %), the Americas (5.8 %) and South Asia (India, Pakistan, Bangladesh, etc. with 6.3 %). China’s exports (which also include Hongkong and Macao) increased from 12.5 Mt/a in 2012 to 18.1 Mt/a in 2016 but made up “only” 8.1 of the global trade, a figure which is, however, expected to increase significantly.
3 The main market players
Figure 8 shows the major players in the cement and clinker trade. The TOP3 cement producers LafargeHolcim, HeidelbergCement and Cemex have market shares of 10.1 %, 6.9 % and 4.2 %, respectively or 21.2 % combined. The influence of these three players is widely overestimated after the merger of Lafarge and Holcim and the takeover of Italcementi by HeidelbergCement, because not all trade is within the group companies [1]. Anyhow, the TOP3 have an impressive trading network. According to Cement Distribution Consultants, LafargeHolcim alone has approximately 200 coastal facilities (about 16 % of the global total of coastal terminals, grinding stations and cement plants) and HeidelbergCement has approximately 135 (Figure 9) (about 11 % of the global total, which is quite a large concentration of facility capacity.
In 2016, HeidelbergCement’s HC Trading increased its trade volume by 10.3 % to 24 Mt/a. Cement, clinker and other cementitious products accounted for 16.5 Mt/a, The balance is made up of fuels (coal and petcoke). According to our estimation, 13.2 Mt cover cement and clinker. In 2016, more than 1100 shipments were conducted. The key supplies of the cement products were from China, Turkey, Spain and Scandinavia (Figure 10). The deliveries went mainly to Africa, Asia and North America. In addition to group-owned cement plants, HC Trading also supplied other cement customers in Europe, the Middle East, Asia and Africa. Only around one-third of all deliveries were within the Group, while two-thirds went to other cement companies. In 2016, the activities of Interbulk Trading (Italcementi) were also consolidated in the market figures.
Cemex had trading relations with 100 countries in 2016. The trading volume totaled more than 10.5 Mt/a of products, of which about 8.1 Mt/a were cement and clinker, 1.6 Mt/a were granulated blast furnace slag and 0.9 were other products (flyash, gypsum, etc.). Their own Cemex-chartered fleets transported about 64 % of the traded cement and clinker volume. The global trading operations were helpful towards optimizing the worldwide production capacity, delivering surplus cement to where it is more needed and exploring new markets without the necessity of making large capital investment. Moreover, the freight services to third parties generated additional profit for the trading department when spare fleet capacity was available. The group of other cement producers has similar objectives with their trading activities.
The group of other cement producers combines a large number of other players. The most well-known are other multinationals such as CRH, Taiheiyo, Titan, Vicat, Votorantim, Intercement, Eurocement of Russia or Conch and CNBM of China. At the moment, even the biggest of these companies only achieve cement and clinker trades of less than 5 Mt/a. However, there are many examples of emerging players such as Argos Cementos, Dangote, Medcem, McInnis, etc., which are on the way to getting their share in regional markets. Furthermore, almost 40 % of the cement and clinker trade is under the influence of the growing list of independent trading companies. These companies predominantly trade cement from third parties and include names such as Cemco, Chebli, CNC Trading, IMI, PSE Cement, Shun Shing and many others.
4 The Chinese influence
Will China flood the market with cheap cement and clinker? In recent years the answer was negative, because it was argued that China has almost no cement plants at deep water locations, exports are via general ports and the country does not have the international trading network [2]. However, the latest market figures show something else. China increased its cement and clinker exports from 13.9 Mt/a in 2014 to 17.8 Mt/a in 2016. Compared to peak export years in 2006 and 2007 with up to 36.1 Mt/a of exports [3], today’s market figures are small, but the situation in China has changed dramatically. China’s cement demand has declined, large overcapacities have been created and China’s capacity is much more modern and advanced than it was ten years ago. The situation is that China will have large surplus capacities available for the next 20 years at least and exports are more than an option for achieving higher utilization rates and fit perfectly into the “One Belt One Road” strategy.
China’s largest cement producer is CNBM with more than 400 Mt/a cement capacity and utilization rates of less than 72 % (excluding the merger with Sinoma Cement) [3]. Sinocem, which is based in Hangzhou in China, is one of the trading arms of CNBM and has become China’s leading cement exporter. The company offers a “door to door” service and combines the logistic strength of the two shipping companies Sinobulk and Leomax Maritime. At the moment, four cement carriers are operated from China to West and Southeast Africa, and the West and East coasts of Latin America. The exports involve dozens of ports and terminals. One of the countries that have been entered recently is Costa Rica (Figure 11). In 2015, cement imports from China were for the first time larger than those from Mexico. The prices for 50 kg cement bags dropped from 6600 CRC at the beginning of 2015 to about 5800 CRC at the beginning of 2017. Since April this year, import prices have significantly increased.
5 Sustainable investments
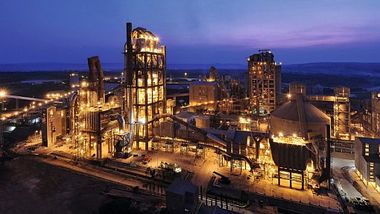
In the last ten years, economies of scale aspects were mostly behind the decisions for large new integrated cement plants of 10 000 t/d and larger [1]. The investors for such plants were always optimistic that the local market growth would absorb the new capacities and that a surplus could easily be exported. One such example is the greenfield Al Ain cement factory (ACF) of Abu-Dhabi-based Arkan, which was commissioned in 2012 and allows the production of about 3.5 Mt/a of clinker and more than 4.0 Mt/a of cement. At the stage of planning it was estimated that 90 % of ACF’s output would be consumed domestically, while 10 % would have to be exported. Another example is Eren Holding’s Medcem cement plant in Turkey , which was commissioned in 2015 and has a production capacity of 11 500 t/d. MedCem Global is currently investing in import facilities (cement terminals and grinding plants) in different regions of the world to increase its network to ten countries within two years.
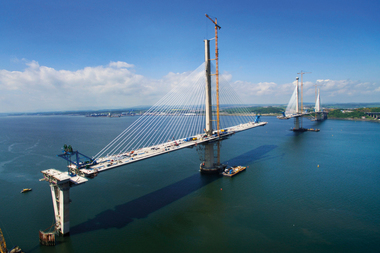
In the coming years we definitely see a trend to smaller integrated plant capacities of up to 6000 t/d due to a decreasing import demand and a decreasing clinker ratio in cement. One such example for sustainable investment is McInnis Cement’s new 2.2 Mt/a cement plant at Port Daniel-Gascons in the Quebec province of Canada. The cement plant has just been commissioned and is a model of environmental performance, meeting the highest standards. The deep-water marine terminal (Figure 12) reduces transportation costs and makes cement shipping cost-effective and highly competitive. Tremendous efforts have been made to set up the company’s own distribution network with a number of strategically located cement terminals along North America’s eastern seaboard in Canada and the USA. In September 2017, McInnis acquired two further cement terminals from CRH to expand its network.
6 Becoming a regional leader
In the cement industry, global and regional trade markets have become very competitive. Clinker and cement prices are at an all-time low. Due to cheap Chinese cement on the market, this situation can be expected to continue in the future. The outlook for shipping rates is also not very optimistic. The gap between exportable surplus capacity and import needs is increasing. Global imports have been falling since 2014 and there are only a few regions, such as North America, with significant growth.
Generally, the situation differs greatly from region to region and depends on the import/export volumes, the cement plant and terminal network and last but not least on the amount of experience the companies have in logistics. While in some regions it will be easier to become a leader, it will be very difficult in stagnating markets with a number of established trading companies.
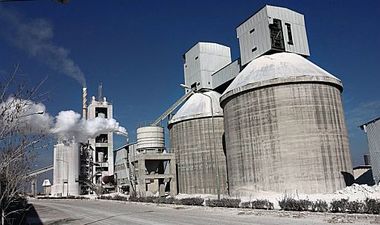
The Caribbean is such a stagnating and established market. However, Argos Cementos was able to become a regional leader, controlling 47 % (2015) of the seaborne cement and clinker trade, according to company sources, despite strong competition by Cemex/Caribe Cement and LafargeHolcim. The company’s strongpoints are its distribution network (Figure 13) with a presence in a number of countries and islands, including 32 ports/terminals and 94 dispatch facilities and warehouses. Up to now, most of the markets are only supplied from the Cartagena plant (Figure 14) in Colombia, which has a capacity of 2.3 Mt/a and completed its brownfield expansion in 2011. Cartagena supplies the local market as well as export markets in Panama in Central America, Suriname and French Guiana in South America and a number of countries and islands in the Caribbean including Puerto Rico. Potentially, the company could also supply from plants in southern USA.
7 The power of independents
The market power of independent traders in the cement industry is enormous, as they are a price corrective to local producers. The biggest independents achieve trade volumes in the range of the TOP3 cement producers. However it is not quite clear which companies can be called independents. In our definition this comprises companies which can produce their own cement, but source the majority of their cement and clinker trade from third parties. The Shun Shing Group is one example. They operate two cement grinding facilities with a combined capacity of 3.5 Mt/a in Bangladesh (Figure 15) using imported clinker. However their trading volume of cement and clinker is estimated to be 11.5 Mt/a in 2016. HC Trading is, from our point of view, not an independent trading company, even though the company states that only around one third of the deliveries are within the group. We estimate that more than 80 % of the cement and clinker traded are from its own or associated plants.
Shun Shing, which is headquartered in Hongkong, began its journey as a trading house that handled shipments of bagged cement and bulk materials in selected countries in the Asia-Pacific region. After 30 years, its core business is still cement but the company has been able to expand to related products such as slag, flyash, limestone, gypsum and steam coal. Figure 16 shows the clinker distribution network of Shun Shing as one example. The clinker sources are from cement producers in Japan, South Korea, China, Vietnam, Indonesia, Thailand, India and the Middle East, while the destinations are grinding plants in Bangladesh, Hongkong/Macao, Singapore, the Philippines, India, Egypt and Mozambique. The company specializes in transportation by 45 000-50 000 dwt bulk carriers and delivers multi-client shipment solutions for highest cost efficiency.
8 Outlook
According to our market research, the global cement and clinker trade volumes will decline. China will increase its global share and also the markets and prices will be largely affected by the Chinese supply. Cement trades will decrease and clinker trades will further increase. Accordingly, the markets will become more competitive and the influence of the TOP3 cement trading companies Lafarge-Holcim, HeidelbergCement and Cemex will further decline. If potential investors make decisions more wisely, then large cement plants with capacities of 10 000 t/d and more will not be installed, due to the risk of surplus capacity and limited export opportunities.
//www.onestone.eu" target="_blank" >www.onestone.eu:www.onestone.eu
Überschrift Bezahlschranke (EN)
tab ZKG KOMBI EN
This is a trial offer for programming testing only. It does not entitle you to a valid subscription and is intended purely for testing purposes. Please do not follow this process.
This is a trial offer for programming testing only. It does not entitle you to a valid subscription and is intended purely for testing purposes. Please do not follow this process.
tab ZKG KOMBI Study test
This is a trial offer for programming testing only. It does not entitle you to a valid subscription and is intended purely for testing purposes. Please do not follow this process.
This is a trial offer for programming testing only. It does not entitle you to a valid subscription and is intended purely for testing purposes. Please do not follow this process.