Cement quality control system: application of X-ray diffractometry
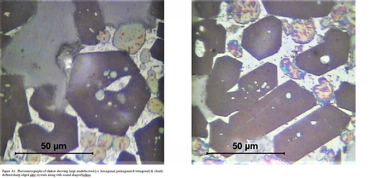
Microscopy has been widely used for phase identification and estimation in cement mineralogy. Over time, a few variations of microscopic methods particularly for strength predication have been reported by different laboratories. Recently attempts have also been made to utilize X-ray Diffractometry (XRD) for quality control in cement manufacturing process. This paper presents the salient points of these methods.
1 Introduction
The main features of a cement quality control system involve raw mix composition, burning of the cement clinker, fineness and finally the strength of the cement produced. The ultimate quality of cement primarily depends on the quantity and characteristics of different mineral phases present in it, which in turn are controlled by the raw mix composition and burning process. Identical raw mix compositions even with a more or less similar burning process may not be expected to produce the same mineral assemblages. Hence evaluation of the clinker mineral phases is regarded as very...
1 Introduction
The main features of a cement quality control system involve raw mix composition, burning of the cement clinker, fineness and finally the strength of the cement produced. The ultimate quality of cement primarily depends on the quantity and characteristics of different mineral phases present in it, which in turn are controlled by the raw mix composition and burning process. Identical raw mix compositions even with a more or less similar burning process may not be expected to produce the same mineral assemblages. Hence evaluation of the clinker mineral phases is regarded as very crucial for the quality control of cement.
Microscopy and X-ray Diffractometry (XRD) are widely used in the field of cement mineralogy, particularly for phase identification and estimation. Prof. Ono of Japan was the first to introduce clinker microscopy for characterization of the clinker burning condition and prediction of 28-days cement strength [1, 2]. Since then, a few variations of microscopic methods particularly for strength predication have been reported by different laboratories.
Recently attempts have also been made to utilize XRD for quality control in the cement manufacturing process. Free CaO content in the cement clinker is still regarded as an index of clinker quality. A very rapid estimation of free CaO in clinker by XRD is possible [3] and quite a number of cement plants are known to adopt this method [4]. Aldridge [5] used XRD for quantitative estimation of cement phases for prediction of cement strength applying the equation earlier formulated by Alexander [6]. Beilmann and Bruggemann have developed a method for on-line determination of clinker phases using XRD, which can be incorporated into the POLAB system for cement quality control [7].
However quantitative estimation of clinker phases by XRD is a complex and time consuming method and on-line determination has not yet been perfected [8]. Keeping this in view, attempts were made in the Dalmia Institute of Scientific and Industrial Research, Rajgangpur to develop some rapid XRD methods for quality control of cement clinker which do not necessitate quantitative estimation of the phases. The salient points of the methods developed are presented in this paper.
2 Characterization of the burning condition
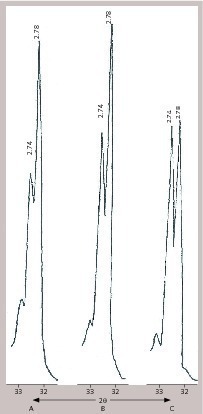
Examination of a large number of clinker samples from different plants and of laboratory fired clinkers demonstrate that the ratio between the XRD pulse counts (Cu-Kά) corresponding to ‘d’ 2.78 (2 θ = 32.2) and ‘d’ 2.74 (2 θ = 32.7) bears a distinct relationship with the clinkering process (9). Laboratory experiments show that this ratio (termed as ‘Cn’ index) is dependent on the burning temperature and retention time (Table 1, Fig. 1).
From the examination of industrial clinkers from different plants it is observed that, to achieve normal cement properties, the ‘Cn’ index must not be above 1.5 [9]. The two ‘d’ values taken for calculation of ‘Cn’ index belong to alite (C3S) and belite (C2S) and it is to be noted that in the case of perfect crystallization, both alite and belite should have ‘Cn’ index around 1.0 to 1.1 only [10]. Thus ‘Cn’ index reflects the degree of crystallization, and the higher the ‘Cn’ values the less is the degree of crystallization. Accordingly there exists a distinct relationship between the ‘Cn’ index, burning condition and degree of crystallization of cement phases. As the burning condition determines the cement quality, the ‘Cn’ index can be used directly for predicting the cement properties. For example, during the production of the clinker 1.1 with ‘Cn’ index ranging from 1.6 to 3.7 (Table 2) the kiln atmospheres was very dusty, and the cement produced showed abnormal properties.
3 Prediction of cement strength
3.1 3-days strength
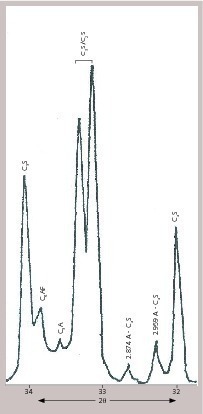
From an examination [11] of a large number of cement samples, a relationship has been established between the 3-days compressive strength (CCS) of cement mortar and an XRD index ‘Xn’ of the corresponding clinker derived from the ratio of the XRD pulse counts (Cu-Kά) at 2 θ = 30.2 (d = 2.959 A) and 31.1 (d = 2.874 A) corresponding to alite (hkl = 202) and belite (hkl = 120) respectively (Fig. 2).
The regressive equations derived for a particular plant:
3-days-CCS- Xn x 240 kg/cm2, when Xn ≤ 1
and 240 + 26 (Xn – 1) kg/cm2, when Xn > 1,
and Xn maximum = 5.5
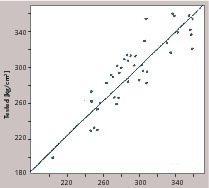
The correlation co-efficient between the conventionally tested CCS values of the cement mortar cubes and the calculated CCS values bases on Xn index for 42 samples of the particular plant was found to be 0.88 (Fig. 3).
The average tested and calculated CCS values of 42 samples were 296.4 and 294.7 kg/cm2 respectively. In average calculated CCS values varied from tested values by +5.9 to –5.4 percent only. Root mean square error was 6.33. In spite of having a wide variation in tested values (195 to 360 kg/cm2), predicted strength values for 80 % samples were within 10 kg/cm2.
3.2 Increase of strength from 3 days
to 28 days curing
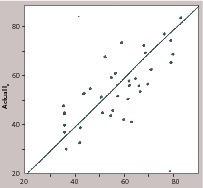
It is found that the Index Xn, as defined in 3.1 also bears a distinct relationship with the strength development of cement mortar cubes in the period between 3 and 28 days [12]. In an examination of 37 samples from a particular plant, the correlation co-efficient between the Xn and In, (the latter being the increase of CCS from 3 to 28 days curing, expressed as the percentage of the 3-days-CCS) was found to be 0.88. From this relationship a regressive equation was derived to calculate the possible increase in strength (In) from the index Xn:
In = 90-10 Xn,
where Xn maximum is 5.5
Actual In, derived from the tested 3 days and 28 days cement strength, bear a high degree of positive linear correlation with the calculated In bases on Xn (Fig. 4).
3.3 28 days strength
As In, derived from Xn-(3.2) is the increase of CCS from 3 to 28 days curing, expressed as the percentage of the former, it is conceivable that:
3-days-CCS x In
28-days-CCS = 3-days-CCS + 100
where 3-days-CCS is derived from the index Xn (3.1)
Determination of 28 days CCS of 35 industrial samples on the basis of the index Xn, showed that the calculated CCS values were on average within +3.8 % and –3.5 % of the tested values [13]. The predicted CCS values for 50 % of the test samples were within 10 kg/cm2 or about ± 2 % of the tested values (Table 3).
3.3 Modification of the equation
As each kiln and the kilns in each plant are known to have their individual characters, which control the clinker quality, it is accepted that any regressive equation for strength prediction based on clinker analysis is limited to one kiln only [2]. Furthermore, a number of studies have shown that none of the proposed regressive equations, without any modification is universally acceptable. Keeping this in view the applicability of the present method was further examined by testing clinkers and corresponding cement samples from a second plant. It is found that while the basic principle of the equation remains the same, co-efficients are to be changed [14]. For example, the equations derived for the second plant were:
(1) when Xn ≤ 1, 3-days-CCS = Xn x 276 kg/cm2
and when Xn > 1, 3-days-CCS = 276 + 90 (Xn – 0.5)
where Xn maximum = 2.0
(2) In = 65 – 10 Xn
where Xn maximum = 2.0
As the 28-days-CCS is derived from the calculated 3-days-CCS and In, the equation for 28-days-CCS does not need any modification.
4 Advantage of the XRD metods
Determination of burning condition and prediction of both 3-days- and 28-days-cement-strengths can ensure the quality of the cement produced. In the developed method, XRD of a single representative clinker sample can provide the data for both the burning condition and CCS values. Both the XRD indices, Cn and Xn can be derived within a period of around 20 minutes. The data are collected from the display of the XRD unit and thus the methods avoid any element of personal judgment involved in the microscopic method. As the test results are achievable within a very short time, the two XRD indices Cn and Xn, combined together can be used for any corrective measures that may be necessary in the kiln for the control of the clinker quality.
5 An observation
At present, most of the cement manufacturers possess sophisticated analytical instruments like the X-Ray Fluorescence (XRF) for the elemental analysis, but not often instruments for the phase analysis. This is because of the fact that the cement technologists generally intend to control the cement quality based on the chemistry of the raw meal. However in recent years it is being widely realized that in order to make the process control effective, it is necessary to combine it with the quality control system and that it is not the chemistry of the raw mix, but the clinker phase assemblages and their crystallography that determine the ultimate cement properties. No doubt, potential phases of the clinker could be estimated from chemical analysis. But it is well known that contents of actual clinker phases, as determined by physical methods, always differ from the chemically estimated potential phase contents.
Both microscopy and XRD are widely used for physical estimation of clinker phases and clinker microscopy has already been in use for characterization of the clinker burning condition and prediction of cement strength. However the drawbacks of the clinker microscopy lie in the method of sample preparation and in the microscopic visual evaluation. Determination of different microscopic indices is a complex process, which involves some personal judgments also. Accordingly the method needs an analyst with a significantly wide experience in the application of petrological microscopy. On the other hand, in the XRD method, the required data are collected from the display unit of the XRD system and thus it avoids any element of personal judgment and does not need any highly qualified analyst. Furthermore part of the sample prepared for chemical analysis can be used for the XRD.
The only hindrance to a wide application of the XRD system is the relatively high cost of the instrument. Even then, many cement manufactures are reported to procure XRD units only for rapid estimation of free CaO [4]. XRD systems are powerful analytical instruments with many and varied capabilities and in the cement manufacturing process they can be used for evaluation of raw materials and final products, and in addition for fundamental studies for understanding different cement characteristics [15]. So it is natural that with the increased quality consciousness, the XRD system will be more and more popular amongst cement technologists. Because of its rapidity and lack of ambiguity, the XRD method is expected to play the most crucial role in the field of cement quality control system in the coming years.
Überschrift Bezahlschranke (EN)
tab ZKG KOMBI EN
This is a trial offer for programming testing only. It does not entitle you to a valid subscription and is intended purely for testing purposes. Please do not follow this process.
This is a trial offer for programming testing only. It does not entitle you to a valid subscription and is intended purely for testing purposes. Please do not follow this process.
tab ZKG KOMBI Study test
This is a trial offer for programming testing only. It does not entitle you to a valid subscription and is intended purely for testing purposes. Please do not follow this process.
This is a trial offer for programming testing only. It does not entitle you to a valid subscription and is intended purely for testing purposes. Please do not follow this process.