Latest trends in the lime industry
 Nordkalk
 OneStone Research
 OneStone Research
 OneStone Research
 OneStone Research
 UN Comtrade
 OneStone Research
 Carmeuse
 Fels Werke
 Leube Baustoffe
 Eurostat
 Eurostat
 Eurostat


 OneStone Research
 Cimprogetti
 Maerz
Maerz
 SIC
SIC
The lime industry is a 21 US$ billion business. Further growth depends largely on the development of the major application sectors, such as the steel and construction industries. There are only a very few global players. Not much information is getting outside from these houses. However, the industry is not static at all. The article provides insights into the market and latest industry trends.
1 Introduction
Lime is a versatile high-quality product used in different applications such as environmental, metallurgical, construction, and chemical/industrial applications, and more [1]. Calcium oxide (quicklime, burnt lime, or unslaked lime) is produced by burning limestone in a kiln at temperatures above 900°C. By grinding quicklime and adding water, the calcium oxide is transformed into calcium hydroxide, which is either supplied as hydrated lime (powder) or as slaked lime. Globally, in 2017, about 335 million t (Mt/a) of lime (quicklime, hydrated lime, slaked lime) were produced,...
1 Introduction
Lime is a versatile high-quality product used in different applications such as environmental, metallurgical, construction, and chemical/industrial applications, and more [1]. Calcium oxide (quicklime, burnt lime, or unslaked lime) is produced by burning limestone in a kiln at temperatures above 900°C. By grinding quicklime and adding water, the calcium oxide is transformed into calcium hydroxide, which is either supplied as hydrated lime (powder) or as slaked lime. Globally, in 2017, about 335 million t (Mt/a) of lime (quicklime, hydrated lime, slaked lime) were produced, including China. The production has to be distinguished according to the industry and product type to get a better idea about the markets and applications.
Figure 1 shows a breakdown of the production into type of industry/use. Commercial lime production accounts for more than 58 % of the market. Commercial use covers the production for third parties and the suppliers of commercial lime compete with each other in the markets. Captive lime production is for the producers’ own use. At the moment this covers about 35 % of the market. Such captive production is found e.g. in the steel industry, pulp & paper industry and building material manufacturers and is mostly found in countries like China, Russia, Ukraine and India. An estimated almost 7 % is grey market. This is defined as mostly captive, but the excess production is sold to third parties for achieving higher capacity utilisation rates and to earn an extra income from the product sale to external customers.
In terms of the type of lime, 245 Mt/a or 73 % of the global production is produced as quicklime (Figure 2). However, also all other types of lime is produced first as quicklime, before being further processed into added value products. Hydrated lime makes up 50 Mt/a or 15 % of the market, while slaked lime accounts for about 40 Mt/a or 12 % of the market. Some buyers of quicklime operate their own hydrators such as companies in the mining industry, in the metal and steel industries or companies, which use lime for construction purposes. Although the final product is hydrated lime or slaked lime, such proportions of the market are here by definition covered in the quicklime market segment.
2 Breakdown of major lime applications
For the manufacturing of 1 t of pig iron about 20 to 30 kg of quicklime are used in blast furnaces. Quicklime also enjoys an extensive use as a flux in purifying steel in the electric arc furnace (EAF) and basic oxygen furnace (BOF). Here about 40-60 kg/t steel are used. Lime is particularly effective in removing phosphorus, sulphur, and silica, and, to a lesser extent, manganese. Lime also has important uses in secondary refining of steel and in the manufacture of steel products. Furthermore, it is used in aluminium refining and the refining of other metals. The global steel consumption is forecast by the World Steel Association to increase in 2018 by 1.8 % to 1616 Mt/a and to increase in 2019 by 0.7 % to 1627 Mt/a. However, the growth rates in the world regions are very different with largest growth in Latin America and lowest in Asia/Oceania and so are the growth rates for the lime use in the sector.
Figure 3 shows the breakdown of the major lime application by 2017, worldwide. The metal and steel industries cover 43 % of the market, followed by the construction and civil engineering segment with 20 % and the environmental industry/applications with about 15 %. In the construction industry, quicklime is used for the production of sand-lime bricks and for the production of lime mortar and lime plaster in lightweight and high insulation construction materials or as a filler or bonding agent. In civil engineering lime is used as an additive to asphalt and to soil, to improve the durability of asphalt and the stability and load bearing capacity of soil. Environmental applications cover the use of hydrated lime or slaked lime for flue-gas desulphurisation (FGD) in power plants, drinking water treatment and waste water treatment, when e.g. heavy metals or other impurities are to be removed.
Chemical and petrochemical (incl. oil industry) applications make up 5 % on a global scale, while agriculture makes up another 4 %. The other industrial applications (pulp & paper, mining, glass industries, sugar refining etc. have a combined 13 % market share. In the chemical industry lime is used as a feedstock material for calcium carbide production, as versatile filler in PVC, paints and pharmaceutical products and neutralizing agent or for pH-regulation. Agriculture covers the use as nutrient in fertilizers, animal nutrition and animal hygiene to prevent diseases. In the pulp & paper industry the main use is for lime reburning as a causticizing agent in kraft pulp mills. In the mining sector lime and hydrated lime are important additives for regulating various processes.
However, the use of lime products varies largely from region to region and country to country and by the sales of the suppliers. In the USA in 2015 metal & steel industries had a 34 % market share, environmental applications had 31 %, civil engineering & construction had 10.2 % and other industries accounted for 23.1 %. In Europe iron & steel had 38 % market share, followed by civil & construction with 18 %, environmental with 16 % and chemical industry with 7%. In Sweden, 2016 e.g., metal & steel industries accounted for 45 % of the burnt products, pulp & paper accounted for another 37 %, environmental applications for 10 % and agriculture for 5 %. All other applications combined just 3 % of the market.
3 Breakdown of major lime production countries
There are a number of new market reports about the lime industry available, mostly forecasting market volumes of more than 500 Mt/a by 2025 with annual growth rates of more than 5 %. The most transparent market figures are still provided by the US Geological Services (USGS). For 2017 the USGS provided a global lime production figure of 350 Mt/a, after also 350 Mt/a in 2016. OneStone adapted the figures in countries with better market information and comes to a worldwide production of 335 Mt/a in 2017. Figure 4 shows the breakdown of the market by major countries. China is the leading producer with a production of 215 Mt/a (230 Mt/a USGS) and 64 % market share (68 % USGS). Nevertheless, the figure is from a local Chinese source, but the problem in China is a high and not very well defined captive lime production.
The next two places in the ranking go to the USA and India, which were responsible for a production of 18 Mt/a and 15 Mt/a, respectively or a global market share of 5.4 % and 4.5 %. In the USA there are still 75 lime plants operational. 21 plants are for captive production, mainly in the sugar and steel industries. In India the captive production is relatively high, which makes it difficult to calculate the real production quantities. A production quantity of 15 Mt/a in 2017 was calculated (16.0 Mt/a by USGS). India has a relatively high amount of lime imports. In the TOP5 in lime production are also Russia and Japan. The production in Russia was slightly increasing from 10.0 Mt/a in 2016 to 10.5 Mt/a in 2017. Most of the 55 lime plants in Russia are for the captive production, only 21 plants produce for commercial sale.
In Japan the 2017 lime production reached 9.1 Mt/a, of which 7.4 Mt/a are quicklime.
The TOP10 list is completed by Brazil, Germany, South Korea, Turkey and Italy. In the last few years, most of these markets stagnated or had only a small production increase. Brazil declined from 8.5 Mt/a before the economic crisis in 2014 to 8.3 Mt/a in 2017, Germany declined from 7.0 Mt/a in 2011 to 6.9 Mt/a in 2017and Italy significantly declined from a level of 6.6 Mt/a in 2011 to 3.6 Mt/a in 2017. The markets are very fragmented. In Germany 79 lime plants correspond to almost 100 % of the producers. Many of them represent small production quantities, which indicates the local structure of the market. The TOP10 countries account for more than 88 % of the global production. Other significant lime producers are Australia, Belgium, Canada, France, Iran, Poland, Romania, Spain, Thailand and Ukraine
Up to now only 2.5 % of the quicklime is traded from country to country. If only the commercial available quicklime is taken into account, then the trading share increases to about 4.5 % globally. The TOP7 countries exporting quicklime are illustrated in Figure 5 for the year 2015. France is the TOP exporter with 0.72 Mt/a, closely followed by Germany (0.69 Mt/a) and Belgium (0.63 Mt/a). The exports of these three countries had a value of 92 US$ million, 70 and 71 US$ million, respectively, leading to average quicklime prices of 129, 101 and 113 US$/t. The TOP7 achieved an export volume of 3.5 Mt/a with a value of 417 US$ million, which corresponds to an average price level of 121 US$/t. However, according to estimates in 2017 all quicklime exports increased to 6.7 Mt/a, including new significant exporters such as Thailand and Oman. By 2020 the global export rate of commercial quicklime is expected to be in the range of 7 %.
4 Breakdown of main lime producers
The global lime industry is highly fragmented. Figure 6 shows the market shares and lime capacities of the TOP5 players for commercial lime production, which is projected to be about 250 Mt/a capacity, including China. The TOP5, outside China, combine less than 20 % of the capacity. The Lhoist Group is the global leader with 20.3 Mt/a capacity and a global market share of only 8.1 %. No. 2 in the ranking is Carmeuse, which have an estimated 16.5 Mt/a capacity and 6.6 % market share. The Belgium based Lhoist and Carmeuse can be regarded as the only global players in the lime industry. Next places in the ranking go to Graymont (USA), CRH (Ireland) and Yoshizawa (Japan). They have global market shares of 2.2 %, 1.5 % and 0.9 % respectively, but are only operating in a few countries or just in one country.
Founded by Hippolyte Dumont in 1889, the Hermalle site in Belgium was the starting point of the Lhoist Group. A first international expansion was made to France in 1926, in the 1980s Lhoist gained a footprint in North America. The nineties offered significant expansion opportunities across Western and Eastern Europe, Germany and Scandinavia. The new millennium led to an expansion in Southern Europe, Brazil and progressively in Asia. Now the group is present in 25 countries and operates more than 100 plants, of which about more than half are lime burning plants. The Group has a net turnover of about 2.2 € billion. Latest acquisitions were Streetley Dolomite in the UK in 2014, NSL in Malaysia in 2015 and Heidelberg-Cement’s Walhalla and Idstein lime plants in Germany. In Malaysia Lhoist is investing 170 € million to build one of Asia’s largest lime plants.
Carmeuse, which is 20 % owned by Cobepa, an investment company in Belgium, has about 90 production facilities and is present in 25 countries across Western and Central Europe, North and South America, the Middle East, Asia and Africa and employs more than 4000 people. The company owns and operates an international network of lime plants (Figure 7), producing high calcium, dolomitic and hydrated lime. The net turnover of the Group was 1.15 € billion (from the website). Carmeuse started its Middle East development through a joint-venture and new lime production facility in Salalah Free Zone in Oman in 2015. The total production of the plant was projected with 1 Mt/a, provided by 8 kilns of 400 t/d, each. In 2016, Carmeuse acquired Golden Lime, one of Thailand’s leading lime producer.
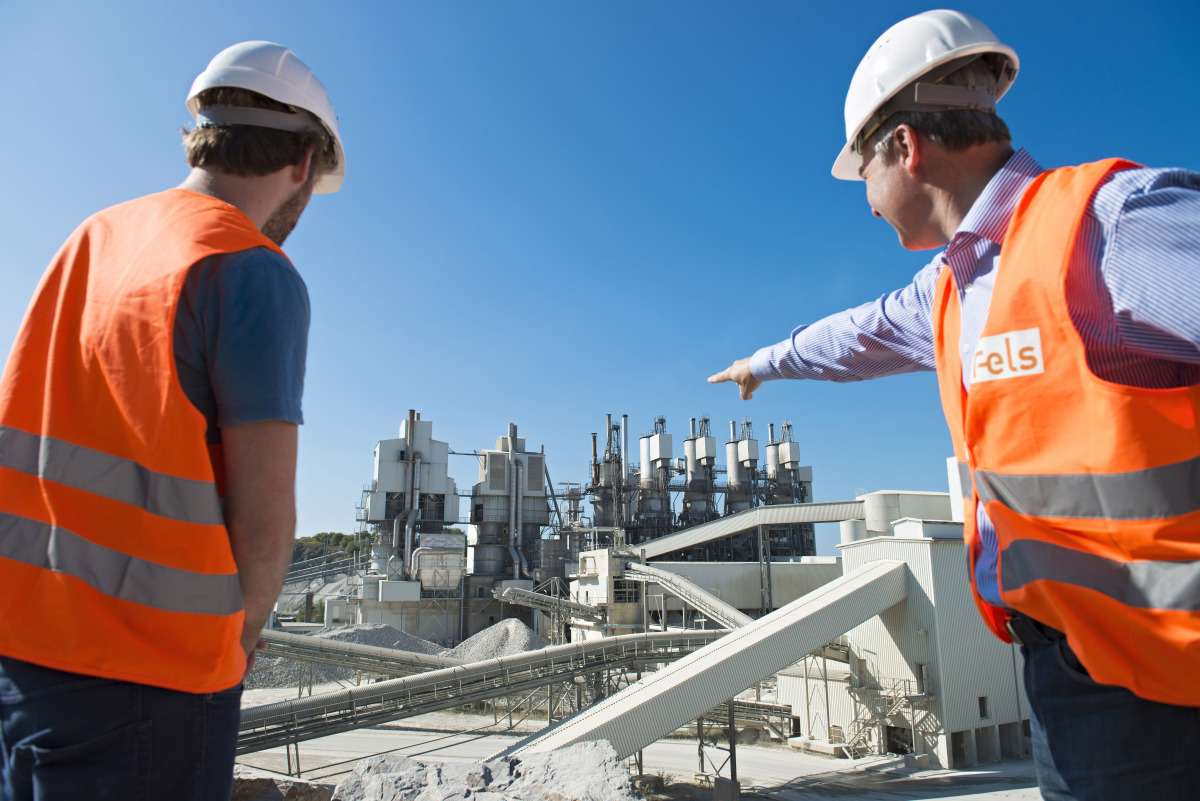
The no. 3 in the global ranking is Graymont with its own 16 lime kilns in the USA and Canada and the minority ownership in Mexico’s largest lime producer Grupo Calidra. In 2015 Graymont purchased two lime producers in New Zealand. CRH has become the global No. 4, after the acquisition of German headquartered Fels Werke (Figure 8) for an investment of 0.6 € billion. Fels 2.1 Mt/a capacity was integrated in the CRH’s Europe Heavyside business, which is now according to the company’s estimates the second largest lime producer in Europe, with production volumes of 1.2 Mt/a in the UK, Ireland and Poland, before the acquisition. Yoshizawa, which is Japan’s largest lime producer is the final member of the world’s TOP5, with an estimated lime production capacity of 2.3 Mt/a.
There are more than 500 commercial lime producers, worldwide, excluding China. In the cement industry alone, there are more than 100 producers who own lime kilns and manufacture for the trade. One such example is Leube Baustoffe in Austria (Figure 9) with a production of about 0.1 Mt/a quicklime and 0.6 Mt/a cement. However, in recent years there has been a wave of disinvestment on the part of most of the larger cement firms. However, there are also a number of new players in the lime business. One example is Chememan in Thailand. The company was established in 2004 and has three lime plants with 0.8 Mt/a kiln capacity and 0.09 Mt/a hydration capacity. In 2017 the company achieved 0.57 Mt/a sales of quicklime and hydrated lime, of which almost 0.25 Mt/a was exported. Now the company expands to India, with first commercial lime operations expected to start in 2019.
5 Lime production in Europe
Lime production in the EU28 is in a decline since 2010/11 (Figure 10). In 2007 in the EU member states still 34.7 Mt/a lime were produced, in 2009 due to the economic crisis this figure dropped to 21.4 Mt/a. 2016 saw a recovery by 9.5 % to 26.6 Mt/a. 2012 and 2013 were also years with more significant decline by 3.0 % and 4.2 %, respectively. In 2016 the market decline came to an end and in 2017 it is projected that the market recovered by 0.8 % to 23.8 Mt/a with a value of about 2.1 € billion. These data were generated from the Eurostat Prodcom market information. There are also data provided by EuLA, the European Lime Association, which show data by the Association’s 19 EU members and two non-EU members. As the EuLA membership does not correspond to EU28, a direct comparison of the data is not possible.
A breakdown of the lime production into quicklime, hydrated lime and slaked lime is shown in Figure 11. By far, most of the lime production is sold or getting to the market as quicklime. The amount of quicklime varied over the years from 71.1 % in 2005 to 73.5 % in 2017. However, there is a slight trend of increasing quicklime shares with a maximum share of 75.3 % in 2013, but since 2013 the share has again declined. Slaked lime surprisingly, has a higher market share than hydrated lime with 5.7 Mt/a in 2005 and 4.7 Mt/a in 2017, against 2.6 Mt/a in 2005 and 1.6 Mt/a in 2017 for hydrated lime. On the global scale the figures show a higher proportion of hydrated lime than slaked lime. Nevertheless, in the EU28 the share of all hydrated lime (incl. slaked lime) is with 28.9 % in 2005 and 26.5 % in 2017 nearly in the range of the global share (27 %).
Figure 12 (a-c) illustrates the main producers for quicklime, hydrated lime and slaked lime within the EU28. Germany has a leading position in all three segments. In the quicklime segment Germany has 29 % market share, followed by France with 14 % and three countries with 8 %, each. In the slaked lime segment Germany leads with 29 % before Italy with 13 %, and France, the UK and Spain with 9 to 7 %. The hydrated lime segment is dominated by Italy and Germany, which combine 73 % of the EU market. France, Bulgaria and Finland comprise 19 % market share and all others only 8 %.
Countries which also have a significant lime production, but which could not be found in any of the TOP5 lists include Belgium, Poland, Austria, Czech Rep., Slovakia and Romania.
6 Technology development
Lime kilns achieve an operational lifetime of 50 years and more. An investigation into the age of the lime kilns in the EU28 shows that 65 % have already been in operation for more than 40 years [2]. Accordingly, the efficiency of these kilns is low when compared to modern kilns. In the USA about 40 % of the operational kilns are older than 40 years. The kiln efficiency is also an issue here, because most of the kilns in the USA are rotary kilns of which many are still operated without a preheater. The average thermal energy requirement of such kilns is in a range of 7.5 GJ/t CaO, which is much higher than the average thermal energy requirement for modern parallel flow regenerative (PFR) kilns of 3.5 GJ/t CaO, or lower. Accordingly, with the discussion of energy use and CO2 emissions, the switch from rotary kilns to modern shaft kilns (horizontal to vertical switch) and the upgrade of shaft kilns is on the agenda.
Figure 13 shows the number of operational kilns in the EU28 by kiln type. The numbers have been adapted from [3] and upgraded by the latest supply lists of kiln suppliers, information about kiln closures and additional information about specific industries, such as pulp & paper, which use lime reburning kilns. According to the list, 465 kilns were operational in the EU28 in 2017. About 84 % are vertical kilns and 16 % are horizontal kilns. PFR kilns already account for 198 units and a market share of 42.6 % of all kilns and almost 51 % of the shaft kilns. The rotary kilns in the pulp & paper industry were not adequately covered in the statistics before. There are 47 P+P kilns operational in Kraft pulp mills, which corresponds to 10.1 % of all kilns in the EU28 and almost 63 % of all rotary kilns.
The number of lime kiln suppliers is shrinking when the Chinese suppliers are excluded. Rotary kilns are still supplied by Andritz, Chisaki, Metso and thyssenkrupp Industrial Solutions. Metso took over the lime kiln and recausticizing business of FLSmidth in 2013. In the sector of shaft kilns the main suppliers on the market are Chisaki, Cimprogetti, Maerz, Societa Impianti Calce (SIC), Terruzzi Fercalx (including Beckenbach technology) and QualiCal. Four of the six shaft kiln suppliers, including Cimprogetti (Figure 14), are located in Italy. There is no single technology which fits all applications and requirements. Accordingly, the technology offered by these suppliers differs widely, including single shaft and twin shaft technologies. The other differentiator is the type of the quicklime to be burnt and size of the kilns, which are offered and supplied to the market [1].
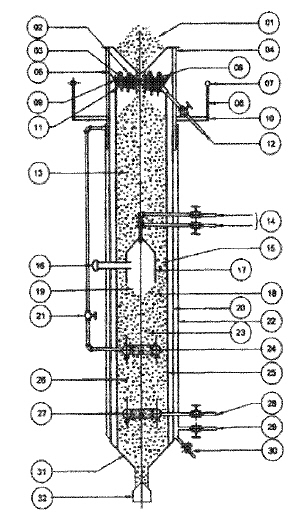
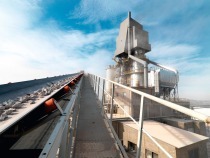
PFR kilns supplied by Maerz (Figure 15) for high-reactive quicklime have some of the lowest specific thermal energy consumption in the market with 3.39 to 3.65 GJ/t CaO for rectangular and circular kilns and even lower for finelime kilns, which require a shorter residence time of the product in the kiln. Circular PFR kilns from Maerz with 600 t/d capacity have become the largest market segment at this company. Twin shaft kilns from Cimprogetti and and SIC (Figure 16) more fit into the smaller to medium size market segment and kilns with 400 t/d capacity. The reference lists of the major suppliers show also a clear shift of captive lime producers in the steel industry with the requirement of larger capacities from rotary to shaft kilns. Markets are developing fastest in Asia (including China, India, Thailand, Vietnam), the Middle East (Saudi Arabia, UAE), Latin America (Mexico) and Africa (Algeria, Egypt, South Africa), whereas in Western and Eastern Europe and North America few replacements are taking place.
Innovations in the lime sector are very much driven by process emissions, kiln and process efficiency, improved use of waste heat, energy recovery in hydration and electricity savings, according to a report by EuLA from 2017 [4]. Another issue is still the conversion of conventional gas-fired kilns to coal, petcoke and alternative fuels.
However, the lime industry does not offer the same opportunities for alternative fuels as the cement industry, where conventional fuels can be replaced by up to 100 %. In CO2 emissions abatement, lime producers participate in some of the projects, which have been set up by the cement industry, such as the LEILAC project (Low Emissions Intensity Lime & Cement), which is a breakthrough technology in direct separation of CO2 by indirect limestone heating and calcination.
7 Outlook
The global lime market is expected to grow with a CAGR of about 2.0-2.5 % in the next few years. Accordingly, the market will grow from 335 Mt/a in 2017 to about 350 to 360 Mt/a by 2020. The share of commercial lime will increase, while the share of captive lime will decrease. Developing markets in Asia, the Middle East and Africa will see the fastest lime consumption growth in the next few years. Developed markets in Europe and Americas will only have a slight growth, because here markets from the steel industry and environmental industry (FGD application) will further decline. With increasing CO2 abatement discussion more efficient and larger PFR kilns will take precedence over all other kiln types in new installations and upgrades.
//www.onestone.eu" target="_blank" >www.onestone.eu:www.onestone.eu
Überschrift Bezahlschranke (EN)
tab ZKG KOMBI EN
This is a trial offer for programming testing only. It does not entitle you to a valid subscription and is intended purely for testing purposes. Please do not follow this process.
This is a trial offer for programming testing only. It does not entitle you to a valid subscription and is intended purely for testing purposes. Please do not follow this process.
tab ZKG KOMBI Study test
This is a trial offer for programming testing only. It does not entitle you to a valid subscription and is intended purely for testing purposes. Please do not follow this process.
This is a trial offer for programming testing only. It does not entitle you to a valid subscription and is intended purely for testing purposes. Please do not follow this process.