Characterizing the decomposition of
sulfatic phases as a function of the gas
atmosphere


A method of evaluation is described with which the upper temperature limit of the stability can be determined with the aid of thermogravimetric data records for different heating rates. The dependence of the decomposition behaviour of calcium sulfate anhydrite on the oxygen partial pressure was investigated.
1 Introduction
The thermal decomposition of sulfatic phases takes place in accordance with (1), in which Me can represent the metals beryllium, magnesium or calcium. No hydrate phases occur with the sulfates of strontium, barium and radium so reaction 1a does not apply and only 1b takes place.
MeSO4 · nH2O → MeSO4 + nH2O↑ ⇥(1a)
MeSO4 → MeO + SO2↑ + ½O2↑ ⇥(1b)
The dewatering/dehydration takes place typically at temperatures above about 80 ºC and is complete at about 300 ºC. The water-free phase, anhydrite, remains but with further heating it also decomposes with the release of SO2. Knowledge of the...
1 Introduction
The thermal decomposition of sulfatic phases takes place in accordance with (1), in which Me can represent the metals beryllium, magnesium or calcium. No hydrate phases occur with the sulfates of strontium, barium and radium so reaction 1a does not apply and only 1b takes place.
MeSO4 · nH2O → MeSO4 + nH2O↑ ⇥(1a)
MeSO4 → MeO + SO2↑ + ½O2↑ ⇥(1b)
The dewatering/dehydration takes place typically at temperatures above about 80 ºC and is complete at about 300 ºC. The water-free phase, anhydrite, remains but with further heating it also decomposes with the release of SO2. Knowledge of the decomposition temperatures of the metal sulfates permits carefully controlled management of the process wherever these are involved. This facilitates not only reduction of SOx emissions but also stabilization of critical process stages at high temperatures.
2 Thermal decomposition of sulfatic
crystalline phases
2.1 The principle of thermogravimetry
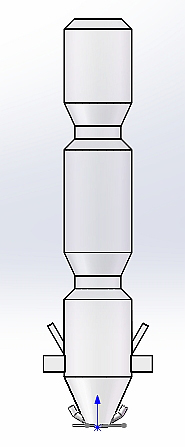
In the Institute of Non-Metallic Materials at Clausthal University of Technology there is a TGA that is connected with a mass spectrometer for gas analysis by a hot gas line. The schematic setup is shown in Figure 1.
It is possible to use different flush gases that can be matched to the composition of the kiln atmosphere. Determination of the evaporation products, which can be differentiated into gas species, takes place in the mass spectrometer. The gas composition is measured continuously during the entire measuring period. This makes it possible to assign the masses that have been detected to the temperature and time of the measurement. An understanding of the decomposition gases permits extended evaluation of the decomposition stages. The main influencing factors are the heating rate and the gas atmosphere. With increasing heating rate the decomposition is apparently displaced towards higher temperatures. This effect is shown in Figure 2.
This is connected with the delayed kinetics of the heating of the test material. The lower the chosen heating rate the less marked is the displacement. The weight of the test material used also affects the inertia of the system. It is necessary to establish a compromise between inertia and relative weighing error.
The investigations on which this report is based were carried out with a Simultaneous Thermo-analysis Apparatus (STA) from Netzsch (STA 409 PC Luxx with QMS 403 C Aëolos). The parameters that were chosen and kept constant are listed in Table 1.
2.2 Determination of the gas composition by MS
The results of the gas mass spectroscopy measurements are given in Figure 3. Typically, they are plotted on a logarithmic ordinate as the gas constituents come in proportions that differ by orders of magnitude. Dewatering of the dehydrate results in a rise in the detected mass m18. The anhydrite (CaSO4) decomposes into two reaction products. On the one hand, new peaks occur for the masses 48 and 64 (corresponding to SO and SO2), on the other hand there is a rise in the signal for mass 32 (corresponding to O2). This confirms the decomposition mechanism postulated in Equation 1.
No mass 80 (corresponding to SO3) was detected during the measurements. It was not possible to determine whether SO3 gas is present briefly or whether thermally initiated disproportionation to SO2 and O2 takes place.
The quadropol mass spectrometer detects gas molecules selectively by mass. There is no characterization of the gases with respect to species (such as, for example, by UV or IR spectroscopy). Allocation of the type of gas to the detected mass is possible only on the basis of molecular weight and plausibility considerations. The allocation in the investigations described here was undertaken as in Table 2.
The detection of fragments is based on the measurement of partially ionized molecular parts. The percentages of the gas species are quantified in accordance with (2):
⇥
⇥(2)
3 Thermokinetic calculations
3.1 Calculation of thermokinetic parameters
For a more extensive evaluation the measured results of the thermogravimetric investigation were converted into a degree of decomposition α of the CaSO4. The calculation was based on (3), where mii describes the behaviour pattern of the remaining mass in mass %.
⇥
⇥3)
The molecular masses of the educts and of the intermediate and end products are used in the calculation, in which the high level of purity of the sample material was utilized. Both forms of plotting are shown superimposed in Figure 4. It is clear that the starting material was composed 100 % of calcium sulfate dihydrate as the decomposition residue consists of more than 34 mass %, instead of the theoretically expected 32.57 mass %. This means that only purely mathematically was a degree of decomposition of 1.00 not achieved.
The thermokinetic parameters are calculated by evaluating the Arrhenius diagrams. A review of various methods of calculation known from the literature is given in [1]. The methods used in these investigations (acc. to Kissinger-Akahira-Sunose (KAS), acc. to Starink and acc. to Doyle) count as isoconvertional methods. These do not require any assumptions about the reaction or decomposition mechanisms. Instead of this the material behaviour is evaluated at different heating rates. The basis for all three methods is an equation of the type (4).
⇥ (4)
β...heating rate
T...absolute temperature
ΔEact...activation energy
R...gas constant
A, B, C...parameters
The parameters that apply for the three methods are listed in Table 3. The entire decomposition reaction is divided into 100 steps (α1=0.01; αii=0.ii; α100=1.00) with respect to the degree of decomposition α. The associated temperatures are recorded in a table. The temperatures assigned to the discrete decomposition steps αii are then used for the calculations in (4).
About 100 points are therefore generated for each heating rate βj. Because of the available temperature range of the test apparatus it was not possible to measure the complete decomposition at all heating rates. About 400 points are shown in black in Figure 5. The decomposition behaviour patterns of about 100 steps in the advance of decomposition aii are evaluated for all four heating rates βj. The points of each aii are approximated by linear trend lines. This resulted in the sequence in Figure 5.
Only those fits that exhibit a coefficient of determination R2>0.95 were used for calculating the mean values. For very slight progress of the decomposition αii any errors in the weighing equipment have a predominant effect because, with finite re-solution, it can become ever harder to differentiate between background noise and loss of mass.
The heating rate is used in the calculation of thermokinetic parameters (cf. (1)) so particular attention was paid to this value. The heating rate that was used for the calculations was calculated from the recorded temperatures and times. The true heating rates remained about 5 % below the nominal heating rates.
The activation energies were calculated from the gradients in the Arrhenius diagram of the approximately 100 straight lines in each case (Figure 6). The error bars represent the error that is inherent in the approximation with the straight lines. Because of the above-mentioned measurement uncertainty the first two points of the degree of decomposition (shown by hollow points in Figures 5 and 6) were not used for the evaluation.
The mean values that were determined for the thermokinetic parameters are shown in Table 4.
3.2 Calculation of the upper stability temperature
The upper stability temperature, or more accurately the upper temperature limit of stability, is defined as the temperature at which, under the chosen conditions (chiefly ambient pressure and kiln atmosphere), there is just still no decomposition. For this purpose an extrapolation was carried out beyond the measured heating rates to a notional heating rate of 0 K/min. The non-linearity of the tempe-rature-heating rate curve is taken into account by using an exponential function (5) for the extrapolation (I).
⇥(5)
The curve of the mean activation energy is shown in Figure 7 by way of example as extrapolation I in orange. The extrapolations were carried out analogously for all the available degrees of decomposition αii (blue points).
The decomposition begins at the transition α0.00 α0.01. Correspondingly, examination of the behaviour pattern of the reciprocal temperature plotted against the advance of decomposition provides an impression of the critical temperature. Figure 8 shows an example of the evaluation.
The behaviour pattern of the approximately 100 points (blue squares) was approximated with an exponential function and extrapolated to an abscissa value of 0. The values with a high level of uncertainty (hollow symbols) were left out of the calculation. This extrapolation corresponds to extrapolation II to the red star-shaped symbol in Figure 8. The values calculated in this way provide the upper stability temperatures shown in Table 5. The upper stability temperatures were determined independently of one another by the three calculation methods described at the start.
The curve of the upper stability temperature is shown in Figure 9 as a function of the oxygen content in the kiln gas. An extrapolation using (5) is shown by the broken line. With rising oxygen content the curve converges towards 1177 ºC, cf. Figure 9.
The calculation method proves to be very robust when compared with the choice of the model selected for calculating the kinetic parameters. The upper stability temperature that has been determined exhibits a significantly lower temperature value for the oxygen-free kiln atmosphere. The explanation for this behaviour can be found in the law of mass action.
During the thermal decomposition of calcium sulfate anhydrite two formula units of decomposition gas are released for each educt formula unit, see (1b). The percentage of SO2 in the kiln atmosphere was checked during the entire measurement. Before the sulfate decomposition the SO2 ionic current amounted to an order of magnitude of 10-38 A, which corresponds to a percentage of 0 mass %, regardless of the percentage of oxygen present in the kiln atmosphere. The second gas that is formed during the decomposition is oxygen. With rising oxygen partial pressure the equilibrium in (1b) is displaced towards the calcium sulfate anhydrite so that this becomes stabilized.
This effect is particularly marked at low absolute levels of oxygen. An evaluation of the three main constituents in the kiln gas based on mass spectroscopy measurements is shown in Table 6.
Überschrift Bezahlschranke (EN)
tab ZKG KOMBI EN
This is a trial offer for programming testing only. It does not entitle you to a valid subscription and is intended purely for testing purposes. Please do not follow this process.
This is a trial offer for programming testing only. It does not entitle you to a valid subscription and is intended purely for testing purposes. Please do not follow this process.
tab ZKG KOMBI Study test
This is a trial offer for programming testing only. It does not entitle you to a valid subscription and is intended purely for testing purposes. Please do not follow this process.
This is a trial offer for programming testing only. It does not entitle you to a valid subscription and is intended purely for testing purposes. Please do not follow this process.