Calculating economics of lab automation
Financial benefits of automated quality control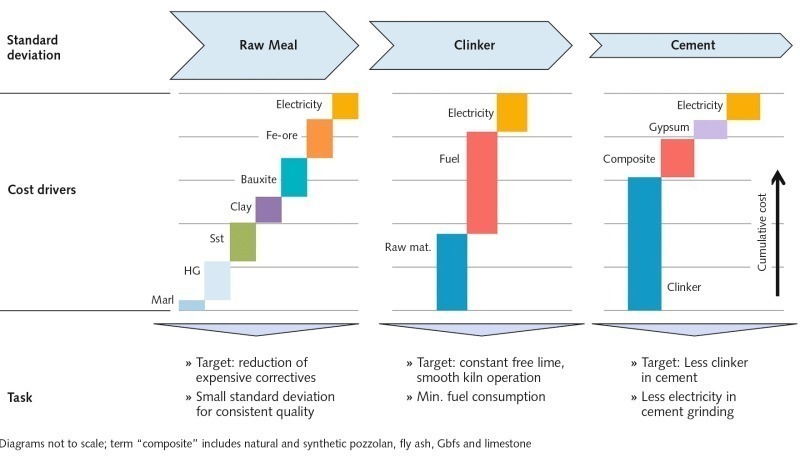
![6 (A) Correlation of reduced kiln stops and clinker production (redrawn from [5]) (B) Modelled lost clinker volume/year](https://www.zkg-online.info/imgs/101542721_f7f77810e1.jpg)
This paper* describes a concept to translate quality parameters into financial benefit. Estimates based on variable cost savings and additional income indicate payback times less than two years. The concept can be used to evaluate CAPEX and return of investment of lab automation systems.
1 Introduction
Automated laboratory automation systems assure quality control at the highest possible consistency of process and product. Automated systems reduce human error and improve frequency, repeatability, and accuracy of the analyses [1]. The investment in lab automation is important when cement producers change from 24/7 lab personnel to day shift only. Continuous chemical, mineralogical and physical data acquisition is crucial to define incremental changes of the current composition relative to a target value (setpoint) [1, 2, 3, 6]. The task of cement suppliers is compliance of the...
1 Introduction
Automated laboratory automation systems assure quality control at the highest possible consistency of process and product. Automated systems reduce human error and improve frequency, repeatability, and accuracy of the analyses [1]. The investment in lab automation is important when cement producers change from 24/7 lab personnel to day shift only. Continuous chemical, mineralogical and physical data acquisition is crucial to define incremental changes of the current composition relative to a target value (setpoint) [1, 2, 3, 6]. The task of cement suppliers is compliance of the final product cement with internal performance requirements and national normalization [e.g. 4],
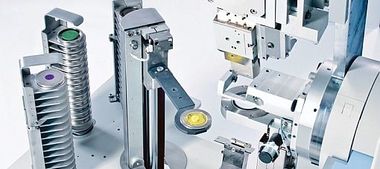
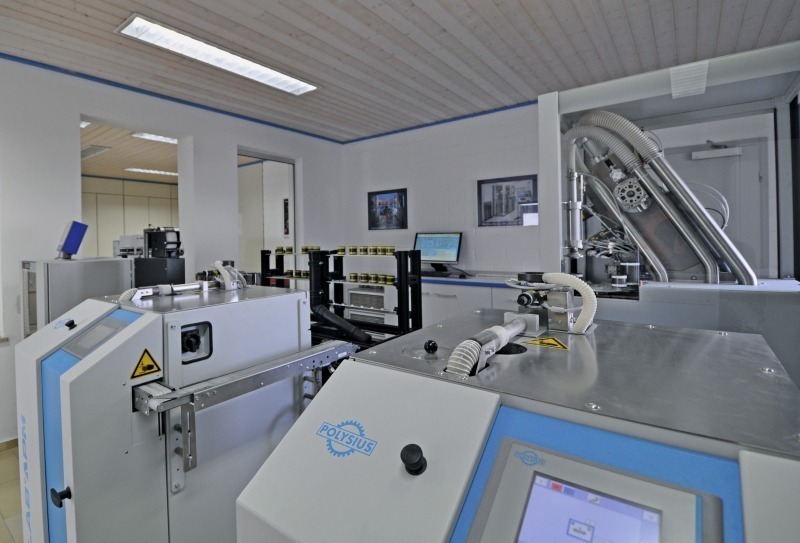
In many places quality control is still completely manual. Other labs realized that complex processes require advanced automated quality control systems with increased availability, efficiency and accuracy. This task is accomplished by reproducible sampling with automatic samplers, scheduled sampling, fast sample transportation with pneumatic tubes, and reproducible sample preparation and instrumental analysis in the lab itself. Fig. 1 shows a state-of-the-art automated lab including automated sampling, pneumatic sample transport and robot-controlled automated sample preparation and analyzers.
In manual systems the data from analyses is typed into spreadsheets or software to calculate target compositions for the time period. Automated systems run unattended with complete control of the plant and weigh-feeders by software code. The capital investment (CAPEX) for lab automation is linked to the degree of automation. In manual systems CAPEX cover analyzers, sample preparation and standard software packages. Advanced automation systems require increased investment. The quality control system is managed and controlled by software adapted to local requirements. The automated lab collects samples from the plant infrastructure and starts analyzers to collect analytical data of intermediate and final products. Finally, physical quality data of cementitious materials (compressive strength, set, workability) is quantified in the physical lab and linked to process data.
A common interest of cement suppliers in quality control projects is the assessment of financial impact of a lab automation system and the payback time to justify expenses during internal discussions. The financial evaluation is often restricted to current and future operating cost (OPEX) and investment. A common statement claims reduced cost for personnel in the lab. Unfortunately this effect is in many places counterbalanced by crucial advanced expertise of the operators.
The effect of lab automation systems is a more consistent (more stable) process and more consistent product. This effect is often not quantified. This paper presents a method based on statistics and cost assumptions to assess potential earnings and savings by quality control systems in terms of standard deviation and variable cost of intermediate and final products. The concept helps to quantify financial benefit of the investment in a state-of-the-art quality control system. For individual plants a software tool can be filled with actual numbers to get a sufficient approximation of the potential benefits for decision makers.
All economic statements and cost assumptions used in this report are based on own estimates and discussions with clients. Each cost number is on purpose rounded and simplified and normalized. The intention of using absolute values is to demonstrate annual potential savings by lab automations systems rather than discussing a specific case.
2 Variable and fixed cost
2.1 Generals
Costs of cement production include fixed costs and variable cost. Variable costs cover consumables, electricity, fuels and raw materials. The variable costs of cement can be reduced by procurement and compositional changes of the products (e.g. composite cements). In a running system variable costs can be reduced by improving process and quality control. Any saving in variable cost will contribute the earnings by lower specific cost of cement.
Fixed costs do not vary with sales volume (e.g. employees, office rents, investments, efficiency of process). Fixed cost optimization is a typical response to underutilization of the equipment and personnel.
2.2 Variable cost drivers
An analysis of variable cost in a cement plant covers three main departments: (A) raw meal preparation, (B) clinker production and (C) cement production.
(A) Raw materials from the own quarry or a third party supply are homogenized in a mixing bed, the raw mill and the silo. Chemical and mineralogical analyses of the raw mix indicate corrective actions to run the process at setpoints [3, 4]. Fig. 2 sketches the cost scheme of raw materials including electricity. Own materials are cost efficient (own supply, quarry cost only) while corrective materials – mined separately or supplied from a third party – are costly.
(B) Variable costs of clinker production include kiln feed, fuel and electricity (Fig. 2). Variable costs savings of clinker can be achieved by reduced expenses on raw material cost, budget fuels and less electricity cost for the kiln process. Clinker is blended into the cement mill regardless of quality to an average product of average variable cost. Variable cost clinker is reduced by improving production volume and long-term kiln availability [e.g. 5].
(C) Variable costs of cement include clinker cost, cost for supplementary cementitious materials (SCM), gypsum, cement additives and electricity cost for grinding (Fig. 2). Composite cements with SCM’s are beneficial in several ways: (A) less use of clinker per ton of cement (specific cost down) and (B) additional cement volume from free clinker for the market and (C) specific application properties introduced by the SCM.
3 Methodology
3.1 Standard deviation
Cement users expect a product of a consistent quality over time at an acceptable price fulfilling application requirements. Chemical and physical analyses assure a proper production process and quality of the final product. Standard deviation over all analyses is a common parameter to evaluate production quality.
Chemical and physical analyses follow a symmetric normal distribution function (Gauss-curve). The shape of the distribution function is described with standard deviation and variance. The normal distribution is centered at the average of the data set. A less consistent production is characterized by a wide standard deviation. A consistent production is characterized by a small standard deviation. In practice two options for process control are available.
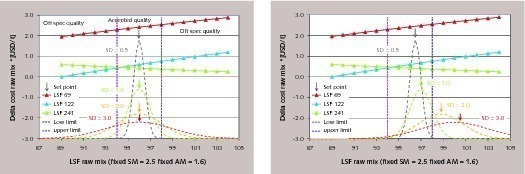
The control of the average composition (setpoint) assures all analyses within acceptable limits (low, upper limit) for small standard deviation (Fig. 3a). For larger standard deviation (> 1) a considerable number of the analyses will appear outside common quality limits (Fig. 3a). Raw mix compositions outside the limits would deteriorate process quality (hard burnability at low LSF, potential free lime at high LSF values). A wide spread (variance) would also require increased efforts to homogenize the raw mix in the silo and might affect the kiln output with negative impact on variable cost clinker.
The second option is moving the setpoint with increasing standard deviation to avoid too many analyses outside a window defined by an upper and a lower boundary (Fig. 3b). As can be seen in the example (Fig 3b) in the case of large standard deviation the setpoint (average composition) is shifted to keep the number of analyses below the lower threshold small.
In the case of high LSF marl as the main raw materials the system is inverted. A high average LSF may cause excess free lime during the clinkering process. In this case the number of analyses above the upper boundary becomes critical and the composition requires correction to lower values of LSF with more costly sand, clay or bauxite.
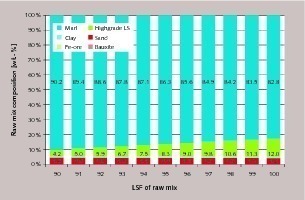
3.2 Cost values Variable costs of raw mix examples are calculated with three different marls to cover a range of rocks present in the field. Tab. 1 lists variable cost estimates as typical. Cements are processed accordingly. Fig 4. shows in one example the changing composition of the raw meal relative to increments of LSF. These changes will be reflected in variable cost.
Raw mix calculation was constrained by constant silica (SM) and alumina modulus (AM) at minimum cost for each increment LSF. The obtained data points plotted in Fig. 3a/3b confirm linear variation of variable costs versus LSF. A first graphical inspection of Fig. 3b confirms the correlation of variable cost and standard deviation. Larger standard deviation causes large variable cost of the raw mix due to increased corrective addition. The annual benefit of lab automation systems can be calculated from the correlation of standard deviation and variable cost by multiplication with total production.
3.3 Calculation of benefit of kiln availability
For clinker benefits a different approach is required. Clinker will never be disposed. Clinker with increased free lime will be stored separately and added in small dosage to the product. Clinker blending leads to an average variable cost of clinker. The specific costs of clinker improve if unintended kiln stops (e.g. clogging, coating) are avoided. Lost clinker volume can be compared to a clinker production volume at optimum conditions. A number given to variable cost clinker can be used to calculate the financial benefit of improved availability relative to current production [5].
4 Results
4.1 Raw meal
If quality control targets to constant average of the raw mix variable cost does not change with standard deviation (Fig. 3a). The symmetric shape of the normal distribution function balances the contribution of costly and less costly LSF values in the raw mix. For large standard deviation this option is accompanied by a wide variance of the raw mix and a loss of homogeneity in the silo. The cost impact of a less uniform raw mix in the clinkering process cannot be quantified here.
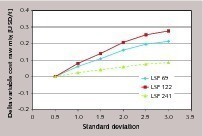
The more common approach is shown in Fig 3b. With an increased standard deviation the clinker producer shifts the average of the raw mix (setpoint) to minimize off-spec material. This shift of the average is accompanied by an increase of variable cost (Fig. 3b). Fig. 5 confirms changes in the order of 0.11 USD per increment of 1 in standard deviation. Automated systems achieve a raw meal LSF standard deviation of < 1.5 and if maintained very well < 1.
In large kilns this small number calculates to annual savings of a few hundred thousand USD/year (Tab. 2). On top – not quantified – are the improved smoother kiln process and the improved acceptance by the cement customer.
However, it still has to be kept in mind, that standard deviation of the quality control system cannot be better than the overall standard deviation of the plant. Careful maintenance and calibration of feeders and silos and quality control complement each other.
4.2 Clinker production
Clinker quality is defined in free lime content and mineralogical composition (e.g. C3S, C2S, C3A, C4AF). Variable costs of clinker increase when kiln feed requires additional fuel to digest free lime completely (overburning). Variable costs also increase with unintended kiln stops due to time and efforts required to clean and to restart the kiln.
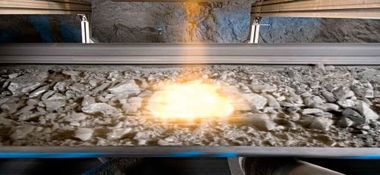
Haeseli [5] correlated unintended kiln stops and clinker loss. Haeseli used automated hotmeal sampling with a POLAB® hot meal sampler [7], to collect hot meal samples and analyze them for mineralogical composition. He found a correlation between clogging in the cyclones and spurrite and Ca-langbeinite concentration in hotmeal. Haeseli controlled the kiln system to maintain spurrite and Ca-langbeinite in concentration with minimum clogging tendency. He managed to use data from quantitative XRD of hot meal to improve the kiln performance by 3 %/year leading to a considerable financial benefit (Fig. 6A).
Kiln availability can be calculated from best observed production values normalized to a time period. The quality of the process can be evaluated from the actual production relative to the achievable production (Fig. 6B). If clinker is given a variable cost value, clinker loss can be used to calculate the economic values of additional clinker (Tab. 2).
4.3 Cement production
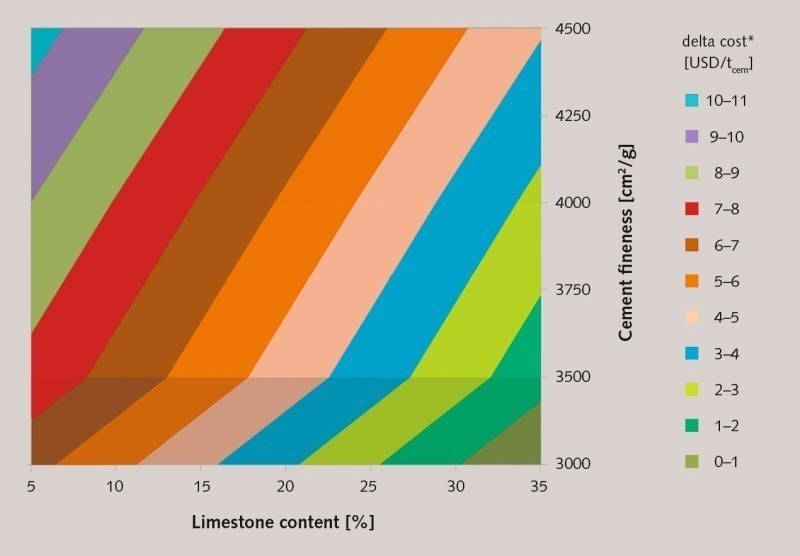
Variable costs of cement are controlled by grinding and cost of cement constituents (Fig. 2). Changing fineness is the first measure when performance of cement is not compliant with targets (e.g. strength at a certain date). If fineness changes are not sufficient to maintain performance of the product also the clinker content will be changed. Both, additional grinding cost and additional clinker change the variable cost of cement (Fig. 2; Fig. 7).
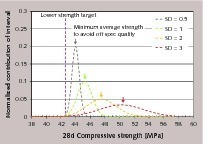
In cement production usually upper and a lower product performance targets are specified in compressive strength. Fig. 8 shows the shift of average performance relative to a minimum target performance. The application of a performance shift is similar to what has been described above for raw mix. A small standard deviation facilitates a minimum performance overhead relative to the targeted value to comply with the specification. A large standard deviation requires adjustment of targets to higher clinker content or fineness to avoid too many analyses not meeting the internal or external requirements [e.g. 4; Fig. 7]. Further, if the additional performance is achieved with clinker also cement volume is lost due to excess clinker consumption.
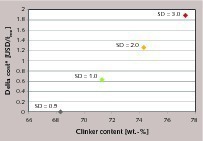
If we assume a standard composite cement made of clinker, a supplementary cementious material (e.g. limestone, fly ash) and gypsum, the variable cost of cement can be calculated for a given cement composition at constant performance. Fig. 9 shows the variable cost of limestone cement relative to the clinker factor at constant fineness and performance. The estimates indicate that in the example roughly 3 % of additional clinker is required to avoid off-spec quality of the cement for an increase of standard deviation by 1. Again the monetary benefit from improved standard deviation can be found from multiplication of the cost change relative to the annual production (Tab. 2). This number does not include the lost cement volume from additional clinker consumption.
5 Conclusion and outlook
This paper presents a combination of statistical tools and cost calculation to evaluate the financial impact of lab automation systems. Better quality performance has a direct impact on variable cost at each step of the cement production process. The potential benefits are listed for one example in Tab. 2.
In the case of raw mix improved standard deviation reduces consumption of costly correctives (Fig. 3b, Fig. 5). If we assume a change of 0.11 ct/tcem per 1 unit standard deviation multiplication for a 6000 t/y clinkering plant would generate potential savings in the order of 300 000 USD/year (Tab. 2).
In clinker production cost are related to kiln availability and constant production (Fig. 6). Additional clinker volumes improve cement volume [5]. If we increase kiln availability from 85 to 90 % the additional income might reach up to 2 700 000 USD/year (Estimate: 25USD/tclinker; Tab. 2) in a 6000 t/year plant.
In cement production a small standard deviation assures a production close to lower performance targets (Fig. 8). In the given example – starting from a CEM II B LL roughly 3 % clinker are required to compensate performance loss for an increase of standard deviation by 0.5 units. The financial effect is twofold – less clinker in cement and more clinker for more cement. Additional income from increased cement volume and less grinding energy due to lower clinker content is not considered.
The analysis clearly confirms that well-maintained quality control systems with a low standard deviation reduce variable costs of intermediate and final products of a cement plant. The numbers in Tab. 2 show large potential benefits from an investment in lab automations system. Lab automation systems can return their cost of investment in less than two years. Values for other kiln sizes can be estimated from specific benefits in Tab. 2.
Cement plants are complex systems. Standard deviation of the automated laboratory system is one factor. For full analysis also the errors of the plant components must be optimized. Silos or samplers not working well limit benefits of the quality control systems. If the plant is maintained well, lab automation systems open potential for high quality cement production fulfilling customer requirements at minimum production cost.
Überschrift Bezahlschranke (EN)
tab ZKG KOMBI EN
This is a trial offer for programming testing only. It does not entitle you to a valid subscription and is intended purely for testing purposes. Please do not follow this process.
This is a trial offer for programming testing only. It does not entitle you to a valid subscription and is intended purely for testing purposes. Please do not follow this process.
tab ZKG KOMBI Study test
This is a trial offer for programming testing only. It does not entitle you to a valid subscription and is intended purely for testing purposes. Please do not follow this process.
This is a trial offer for programming testing only. It does not entitle you to a valid subscription and is intended purely for testing purposes. Please do not follow this process.