Extraction management optimisation with TLS and 3D modelling

The application of structural 3D modelling using TLS datasets improves the extraction management and allows operating companies to differentiate distinct parts of a mineral deposit to be extracted with respect to different products.
1 Introduction
1 Introduction
2 Case study: Carbonate deposit in a graben system
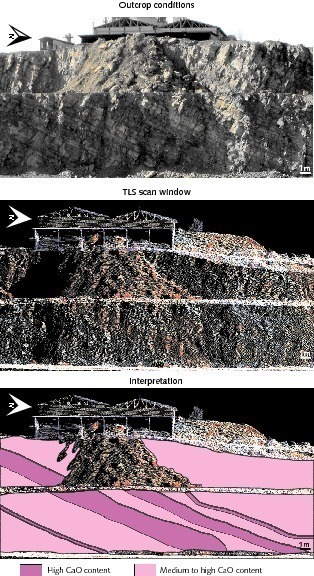
“Werksteinbänke” – bioclastic beds with high CaO content and
“Wellenkalke” – micritic limestones with medium to high CaO content.
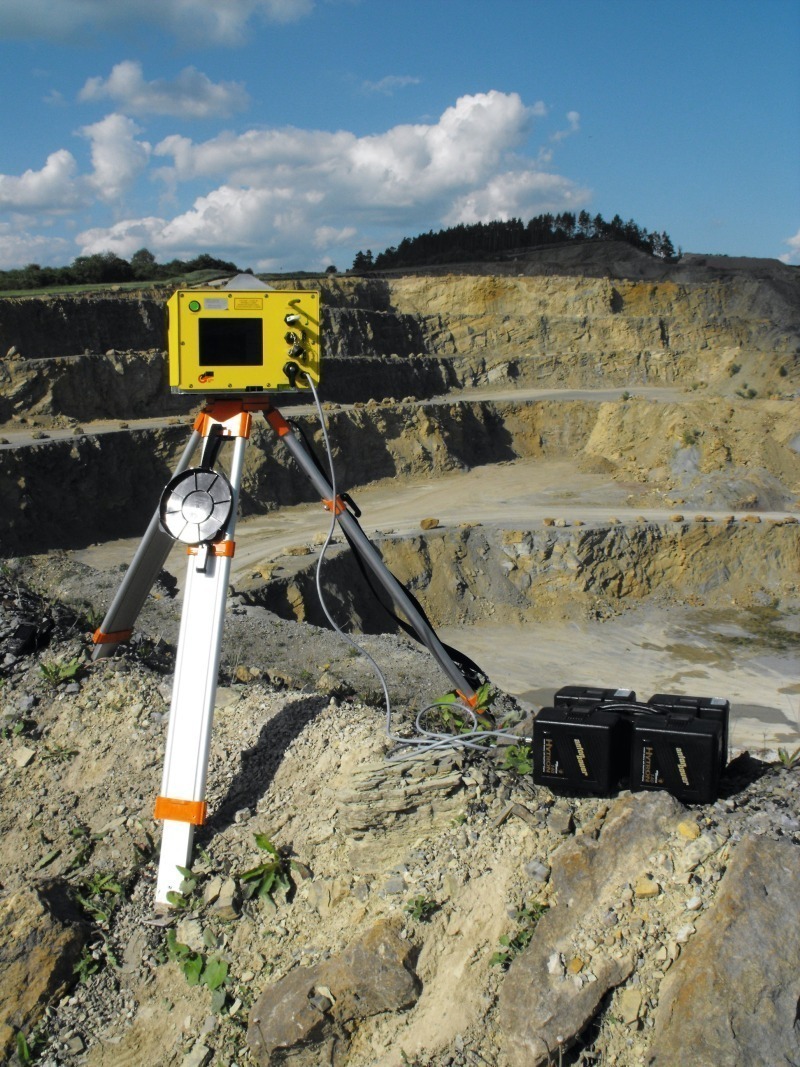
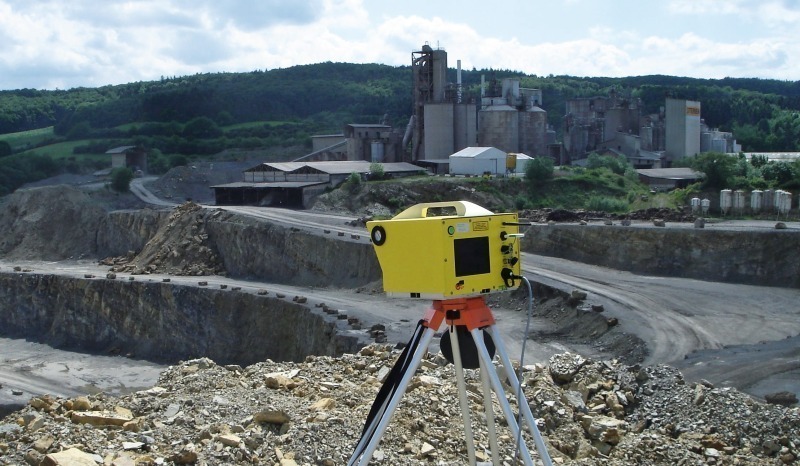
3 Terrestrial Laserscanning (TLS)
4 Characterization of the geology with TLS and
3D modelling
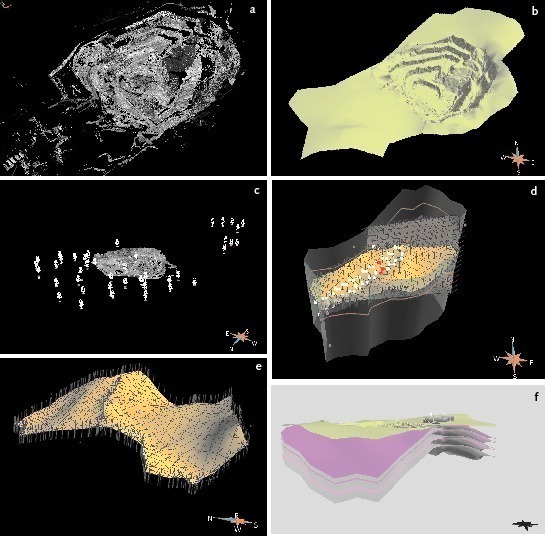
The x-y-z-coordinates of the TLS point cloud (Fig. 3a) were the base for modelling the quarry’s surface plane within the mining claim boundary (Fig. 3b). Together with the measured layer orientations, which are integrated as well objects in GOCAD®, and well data from former prospection drillings the stratigraphic unit planes of the deposit were modelled (Fig 3 c, d, e). Finally, the 3D model of the recent mining state was built by the intersection of the HRDEM with the stratigraphic unit planes (Fig. 3f).
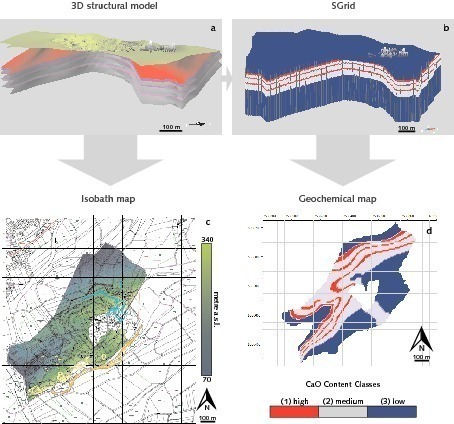
5 From 3D to 2D
Each stratigraphic layer represents a homogeneous geobody and is modelled as 3D grid object, called SGrid in GOCAD®. This allows the combination of structural information and rock specific parameters and can be used to display three dimensional patterns of the integrated parameters. In the present study, the geochemical parameter “CaO content” was implemented into the SGrids. Since the product range of a lime works is not based on accurate CaO contents in percent, a relative scale for the different CaO contents of three classes is used. The “Werksteinbänke” represent the layers with the highest CaO content and thus, are grouped in class 1. The “Wellenkalke” represent class 2, and the economical non considerable overlying “Mittlerer Muschelkalk” and underlying “Röt” represent class 3. 2D maps are created out of the model (Fig. 4), showing either CaO content classes for each extraction level (geochemical maps) or structural data of the different stratigraphic layers (structure maps). Each map provides three types of information: the x-y-coordinates and either the CaO content class or the altitude (z-values). The geochemical maps were created in GOCAD® by intersecting the SGrids with the altitudes of the specific extraction level. The maps show the spatial distribution of the three CaO content classes for each extraction level. Active extraction areas can be displayed as well as different scenarios with possible new extraction levels may be created. The structure maps are created out of the top of each stratigraphic layer.
6 Conclusions
The present study shows how the additional information gained from the backscattered signal intensities during TLS recording can be used within the mining sector (1) to gain more structural and spatial information as input data for 3D modelling, (2) to evaluate structural data from field work, and (3) to conclude on the raw material quality. The interpretation of structures is directly carried out during the 3D modelling process and serves to specify layer orientations in the 3D structural model by using layer specific backscattered intensities. It also allows the digital mapping of inaccessible areas, which minimizes potential risks during field campaigns, e.g. for further explorations and prospections, respectively. The intensities allow an additional discrimination of the raw material quality due to different lithotypes. For most third party users 2D maps are essential for their work. Here, the 3D structural model enables a flexible creation of maps with detailed information on geometry and geochemical properties. These maps allow operating companies to differentiate distinct parts of a mineral deposit to be extracted with respect to different products (e.g., cement, mortar, plaster; see Fig. 5). Hence, the application of our approach enables minimization of the amount of excavated material and supports the extraction management planning in both ongoing mining and future extraction. Lithologic and geochemical data from field work and laboratory analyses (left columns) show a cyclic stacking pattern of the “Unterer Muschelkalk” succession. The “Werksteinbänke” are subdivided in Oolithbänke, Terebratelbänke and Schaumkalkbänke. This information may be visualized in 2D maps and 3D models to define economically exploitation with respect to different products (right column). Third party users obtain a structured overview of the CaO pattern in the stratigraphic succession and additional information on the favoured products for each unit.
Überschrift Bezahlschranke (EN)
tab ZKG KOMBI EN
This is a trial offer for programming testing only. It does not entitle you to a valid subscription and is intended purely for testing purposes. Please do not follow this process.
This is a trial offer for programming testing only. It does not entitle you to a valid subscription and is intended purely for testing purposes. Please do not follow this process.
tab ZKG KOMBI Study test
This is a trial offer for programming testing only. It does not entitle you to a valid subscription and is intended purely for testing purposes. Please do not follow this process.
This is a trial offer for programming testing only. It does not entitle you to a valid subscription and is intended purely for testing purposes. Please do not follow this process.