Modelling of component behaviour around a cement grinding circuit


This paper presents the results of component modelling work performed around a closed-circuit cement grinding operation. In this context, the ball mill and the air classifier were modelled by applying perfect mixing and efficiency curve approaches, respectively. The studies implied that the shape of the efficiency curve varies with the type of material. Since the specific gravities of the components differed between 3 and 2.3, the bypass decreased from 11.69 to 5.24 % (survey 1) and the cut size increased from 29 to 35 µm (survey 1). Finally, the ball mill model was developed on a component basis, and the r/d values were found to be affected by the feed composition and material properties. The results showed that the clinker with the highest hardness value had the lowest rate of breakage.
1 Introduction
Cement is produced by grinding and mixing various types of raw material such as clinker, limestone, gypsum, slag, fly ash, natural pozzolanas, etc. Since different types of cement are found in the market, each type has its own process conditions and product specifications. It is known that the properties of the raw materials have influence on any process, so the grinding performance is also affected. This study aims to illuminate these differences by investigating the ball milling and air classification operations and then developing model structures for use in simulation...
1 Introduction
Cement is produced by grinding and mixing various types of raw material such as clinker, limestone, gypsum, slag, fly ash, natural pozzolanas, etc. Since different types of cement are found in the market, each type has its own process conditions and product specifications. It is known that the properties of the raw materials have influence on any process, so the grinding performance is also affected. This study aims to illuminate these differences by investigating the ball milling and air classification operations and then developing model structures for use in simulation studies. Developing such a tool enables users to predict the response of the grinding circuit with regard to the production rate and, hence, the specific energy consumption in case the product is altered. Therefore, the viability of the applications can be evaluated.
Cement manufacturing is composed of many sub-operations, i.e., quarrying, crushing, raw meal grinding, burning, cooling and cement grinding. The whole operation requires energy utilization of around 110-150 kWh/t, depending both on the extent of process modernization and, certainly, the characteristics of the raw materials. In terms of energy expenditure, cement manufacturing accounts for about 5 % of the global industrial energy consumption [1]. Among the manufacturing stages listed, comminution accounts for the largest fraction of energy utilization (30 %). High energy consumption motivates both manufacturers to develop energy efficient grinding machines, e.g., high pressure grinding rolls and vertical roller mills, and researchers to carry out modelling and simulation work in order to optimize the energy efficiency of existing circuits. This study focuses on the modelling and simulation side by separately studying the behaviour of the individual components.
The current structures of comminution models employed in simulation tools do not consider component behaviour. However, it is a well-known fact that the hard and soft components in a grinding process have different influences on the results of comminution. In addition, materials exhibiting different specific gravities, porosities, shapes, etc. behave differently throughout the classification operation. Considering that the characteristics of run-of-mine ore may change unexpectedly, establishing the response of the process is of importance, and that can be accomplished with the aid of simulation tools. Therefore, it can be concluded that the future of such models lies in multi-component approaches.
A number of prior studies have been devoted to the investigation of component behaviour. Venkataraman and Fuerstenau [2], in carrying out batch grinding tests on calcite, hematite and quartz, observed that the breakage rate of the minerals was dependent on the other mineral components of the mixture. Hosten and Avsar [3] performed kinetic grinding tests with cement clinker and trass and concluded that the breakage rate of trass was affected by the clinker content of the mixture. A study presented by Tsivilis et al. [4] showed that the harder material in the mixture, in the case at hand clinker, was concentrated in the coarser fractions, while the relatively soft material, i.e., limestone, accumulated in the finer size fractions. They concluded that high limestone content (over 30 %) adversely affects the grinding of limestone and clinker. A deleterious effect of the softer component on the grindabilitiy of a mixture was presented by Tavares and Kallemback [5]. Abouzeid and Fuerstenau [6] ground mineral mixtures in high-pressure grinding rolls and concluded that each mineral had different comminution results. Preparing mixtures with soft and hard components, they showed that the soft components affected the transfer of energy to the hard component, thus altering the results of comminution. Bueno et al. [7] worked on developing a multi-component model structure for AG/SAG mills and validated their findings through pilot plant tests and industrial surveys. Shi [8] studied the multi-component breakage of coal and observed that a change in density within a given size fraction influenced the t10 value. The higher the density, the coarser the product would be.
The successive multi-component works performed for mineral grinding applications encouraged similar studies for cement grinding operations. Dundar and Benzer [9] performed a multi-component analysis limited ball mills in cement application. They concluded that the breakage rates of the components changed as a function of differences in their grindabilities. However, no relevant influences on air classification were discussed.
Since cement is composed of various types of raw materials, it is important to separately track component behaviours and develop model structures for use in simulating different cement types e.g., CEM II, CEM III, CEM IV, etc., which are mixtures of various types of raw materials. With a multi-component modelling tool, cement producers can more reliably estimate their production rates and the effects of changes in feed composition.
Within the scope of this study, the results of multi-component modelling works performed around a cement grinding circuit are presented. The behaviours of all of the various components, that is, the performances of the equipment elements, were evaluated on a component basis. In addition, the modelling work for the ball mill and the air classifier was performed in application of perfect mixing and efficiency curve approaches. The studies implied that each component had its own rate of breakage and classification parameters that were correlated to the breakage properties, grindabilities and specific gravities.
2 Material and method
2.1 Sampling studies
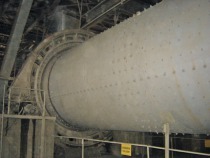
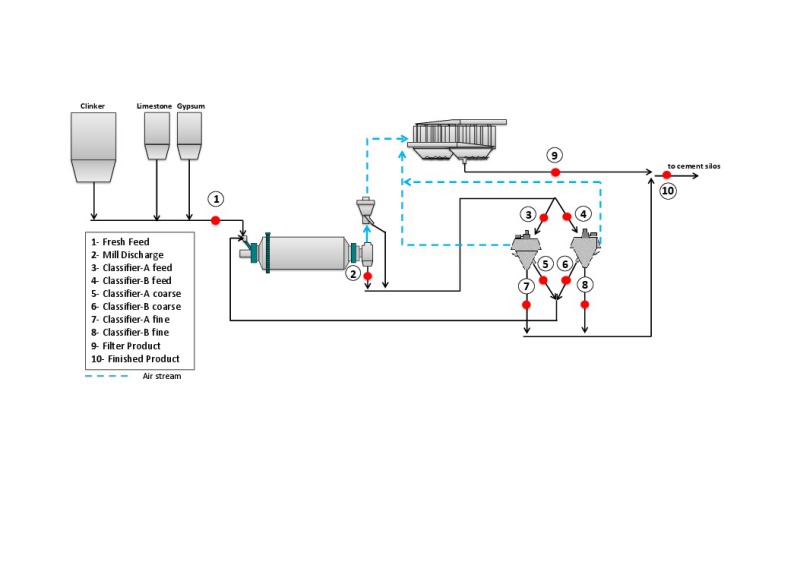
As emphasized, this study was performed around a cement grinding circuit. Figure 1 illustrates the flow sheet of the circuit. In this flow sheet, a single-compartment air-swept ball mill is operated in closed circuit with two parallel dynamic air classifiers. In addition, a static classifier in which the fines are collected by a bag filter is employed at the discharge end of the ball mill. The filter also collects additional fine material from inside the dynamic classifiers. The fines of both the static and the dynamic classifiers are mixed and then sent to the final product silos. The reject streams from the dynamic classifiers are circulated back to the ball mill until the target product size is reached. Table 1 gives the technical specifications of the equipment.
Within the study, two sampling campaigns were performed during CEM II/A-LL 42.5 type cement production to investigate the behaviours of the components. Sampling of the whole circuit was accomplished when steady state milling conditions were established. In this context, the power draws of the machines, e.g., the ball mill, the elevator at the ball mill discharge, the product transportation system and the mill filter, as well as the flow rates of the streams, e.g., fresh feed and classifier reject, were all monitored. Some of the operating conditions are given in Table 2.
As can be seen, the main difference between the two sampling campaigns is the change in raw meal composition. In the second campaign, the amount of limestone used in cement production was increased from 7.5 % to 11 %, and the production rate of the circuit was decreased from 83 t/h to 71.2 t/h. Such a sampling study enabled to observe the influences of both the change in feed composition and the flow rate on behaviours of the components around the circuit.
2.2 Experimental studies
Following the sampling studies, the collected samples were subjected to characterization work. With regard to characterization, the specific gravities, the particle size distributions, the grindabilities, the distributions of the components to different size classes and the breakage distributions of the raw materials were determined.
The size distributions of each stream around the grinding circuit were determined by use of an air jet sieve machine [10]. This technique was preferred mainly because of its ability to complete the dry sieving down to the 20 µm size range. Another advantage of the system lies in its ability to collect the required size classes down to 20 µm, which were then characterized regarding their component content, hence enabling calculation of the distribution. The sieve sizes selected throughout the evaluations are given in Table 3. Figure 2 depicts the obtained size distributions of the two sampling surveys.
As illustrated in Figure 2, there were two dynamic classifiers being operated in parallel, each with its own feed, fine and coarse product streams. When the size distributions obtained around the two units are compared, it is concluded that they were all mutually similar. Consequently, in the following sections the two classifiers are represented as a single unit.
Following determination of the particle size distributions, the collected samples were separated into size classes, after which the gypsum, limestone and clinker contents were determined for each of the streams. Within this context, the test procedure given in TSE CEN/TR 196-4 [11] was applied. In this procedure, the gypsum content was calculated by way of the SO3 assay results, and the limestone content was determined by applying the split-loss-on-ignition technique. In this test, the material is initially heated up to 550°C, then further heated to 975°C and kept at that temperature level for about 45 minutes. The amount weighed in each interval is subtracted and used in calculating the limestone content of the cement. After determination of these two components, the remainder is the clinker content. An example of the calculation results obtained around the circuit is presented in Table 4.
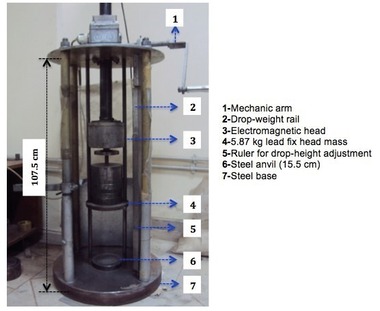
In addition to the determination of size distributions and chemical assays, the breakage characteristics of the raw materials, which are important with regard to the ball mill modelling studies, were determined according to a bed breakage methodology developed by Eksi [12]. In this test, the raw materials were initially separated into five different size classes, after which the prepared samples were subjected to breakage action at three different energy levels of the drop weight test equipment. Afterwards, the particle size distributions of the broken products were determined, and the ore hardness indices (A*b) of the samples were calculated (Table 5). Finally, the size-dependent breakage distribution functions of clinker, limestone and gypsum were calculated. The results of the breakage tests showed that clinker had the highest resistance to impact breakage among the components. Conversely, gypsum was found to be the softest component in cement.
As part of the characterization studies, the grindabilities and specific gravities of the components were determined. The Bond work index values (Table 6) of the components were in good agreement with the results of breakage tests, since again the clinker was the hardest component (with a value of 15.14 kWh/t).
The specific gravities of the components were determined by the pycnometer method [13], where mass and volume measurements are undertaken with a glass container having the specified volume (Table 7). It should be emphasized that the specific gravities determined within the study represent the overall values of the samples for a given size distribution.
3 Results and discussions
In order to evaluate the performance of a grinding circuit and then develop the corresponding model structures, the errors in the measured size distributions should be dispersed and the flow rates of the streams calculated. Within this study, mass balancing was conducted using an in-house software developed on a Microsoft Excel platform, where the size distributions and chemical assays were inputted. The software uses least-squares methodology to obtain the best estimate of flow rates, size distributions and chemical assays.
Briefly, the methodology of mass balancing can be explained as:
-inputting the measured size distributions to calculate the flow rates and distributions
-inputting the calculated flow rates to balance the head assays
-using the calculated flow rates and sizes to balance size by analysis of the components
-separately evaluating each component
-calculating all assays, size distributions and flow rates and comparing them with the measured values to assess the success of mass balancing
Figures 3 and 4 individually illustrate the variations in the calculated size distributions of the gypsum, limestone and clinker streams around the circuit and its components. Both sampling surveys have corrected size distributions that are in good agreement with the measured ones.
Figure 5 depicts the difference between the calculated assays and the measured ones. As can be seen, there is good agreement between the results, hence indicating that a complete balance of the circuit was established. Consequently, the data could be used in developing model structures of the circuit, thus allowing individual assessment of the components’ behaviours.
As a result of the entire studies, the components’ size vs. flow rate data were calculated as given in Table 8. The stream numbers and locations are depicted in Figure 6. As mentioned in the previous sections, since the size distributions around the two dynamic classifiers were similar, they were represented as a single unit.
As can be followed from Table 8, all of the characterization work served to prepare for separate calculation of the component flow rates. As a result, the performances can be evaluated and the model structures developed separately, the details of which are given in the following sections.
3.1 Modelling Studies
3.1.1 Modelling of the dynamic air classifier
To date, several researchers have studied the modelling of air classifiers. Within that scope, a mathematical model of the classifier was developed according to the efficiency curve approach. Basically, this model fits the parameters in the equation of the curve defining the classification performance. Afterwards, the variations of the parameters with the material properties or process conditions are investigated to develop correlations. Figure 7 illustrates the actual and ideal efficiency curves of an air classifier and the expressions of some of the parameters.
Although a number of equations have been developed so far, Altun [14] proved in his study that the approach developed by Whiten [15] had a higher prediction capability of the experimental data among the equations specified in the literature. Consequently, this study focussed on modelling the classifier based on Whiten’s approach. The mathematical expression of Whiten’s approach, which utilizes the overflow efficiency of the separation process, is given in Eq. 1 [15]:
⇥ (1)
Where:
X: d/d50c
β: Parameter controlling the initial rise of the curve
in fine sizes (fish-hook)
α: Sharpness of separation
β*: Parameter preserving the definition of d50c: d=d50c when E=(1/2)C
C: Fraction subjected to real classification; (100-Bypass)
d50c: Corrected cut size
Eoa: Actual efficiency to overflow
The literature reports that the material properties have influence on the performance of the classification operation. It is a well-known fact that different components exhibit different behaviours and that the models should be developed accordingly, so as to improve the predicting capabilities of the models. Since this study focussed on model development based on the efficiency curve, the curves of each component were plotted as depicted in Figures 8 and 9. Differences between the plots indicate that the model can be developed by taking the material properties into account.
Following the experimental studies, the model development stage was commenced. Table 9 summarizes the model-fit parameters of the dynamic air classifiers. As can be seen, the bypass and the corrected cut size parameters vary with the specific gravities of clinker, gypsum and limestone (3, 2.3 and 2.7, respectively). The specific gravity affects the classification performance, since the particles in the classification zone are under the influence of centripetal, drag and gravity forces. For both surveys, the calculations indicated that the component with the higher specific gravity also had the higher bypass value. In addition, the two surveys have different bypass values owing to the variation in classifier feed tonnage. As the literature reports, that bypass is correlated with that tonnage value, and higher throughputs resulted in higher bypass values [16-18]. Relationships between classifier feed tonnage and bypass value for each component are given in Figure10.
It is understood from Figure 10 that increasing the feed flow rate to the classifier increased the bypass percentage of the components. In addition, the component with the higher specific gravity (clinker) also had the higher percentage of bypass.
In another evaluation, the cut size parameter was modelled. In an air classification operation, the cut size is adjusted mainly by changing the rotor speed and airflow rate [18]. Since the components are under the influence of the same rotor and air flow rates, variation of the cut sizes with the bypass parameter was investigated and illustrated in Figure11.
Figure 11 implies that the bypass and the cut size are inversely proportional to each other. Another conclusion to be drawn is that the clinker with the highest specific gravity had the lowest cut-size value among the components, whereas the gypsum had the highest value. The higher the specific gravity, the lower the cut size owing to the increased effect of both the gravitational and the centrifugal forces [16, 19, 20].
3.1.2 Modelling of the ball mill
The ball-mill modelling studies were performed in application of the perfect mixing approach [21], which considers a ball mill or a section of it as a perfectly stirred tank. The process can be described in terms of transport through the mill and breakage within the mill. A simple balance for the size fraction i in the product is calculated as follows:
particles coarser than i size are broken into i size fraction
particles in i size fraction are broken into smaller sizes
a new i size is introduced to the system with fresh feed
The perfect mixing model, which has been widely
accepted for ball mill modelling, is expressed in Eq. 2:
⇥(2)
The equation includes two important parameters: the appearance function of the material (aij) and the rate of breakage/discharge functions (ri//di). In modelling, feed and product-size distributions, together with the appearance functions of the components, are inputted first, after which the r/d function is back calculated. Consequently, the breakage properties of the components, in other words the appearance functions, had to be determined first. Within that scope, size-dependent breakage distributions of each component were determined in application of the methodology developed by Eksi [12]. Eksi [12] proposed that the results of breakage testing were in good agreement with mill modelling, since the product-size distributions can be predicted with the least sum of squares of deviations. Following the breakage tests, r/d parameters of each component were back calculated for each survey. The results of the calculations are depicted in Figure12.
As can be understood from the plots (Figure12), the slope of the curves decreases for finer sizes, which is expected. According to the calculated r/d values of each survey, it can be concluded that the rates of limestone and gypsum are higher than that of the clinker. This can be attributed to the higher grindability and hardness properties of clinker, as presented in Tables 5 and 6. Another conclusion was that the components of the two surveys exhibited different behaviours. In other words the calculated r/d values of the components were different. As summarized in Table 2, the main difference between the two surveys is the amount of the components. The limestone content in the second survey was higher than in the first, while the clinker content was lower. It is assumed that such a difference had an influence on the calculations. The increase in limestone content increased the r/d values of that component. On the other hand, the rate of breakage of gypsum and clinker decreased. This conclusion is considered important, since it proves that the model responds to changes in feed material composition, so the simulation studies are expected to be sensitive in that direction.
4 Conclusions
This study aimed to investigate the size-by-milling and classification behaviours of the components (limestone, clinker and gypsum) utilized in cement production and to then develop their model structures. Within that scope, two sampling campaigns around a closed circuited cement grinding operation were performed under steady state conditions, and the collected materials were subjected to a series of characterization work, including determination of the size distributions, specific gravities, size by assays, and appearance functions.
The studies commenced with mass balancing of the entire circuit. Initially, only the size distributions and the measured flow rates were inputted to calculate the flow rates of the rest of the missing streams and to disperse the errors arising from the sampling studies. Afterwards, head and size by assays were used to calculate the distribution of the components into different size classes.
The model structure of the dynamic air classifier was developed by applying Whiten’s efficiency curve approach. This model first fits the parameters defining the curve, after which variations of the parameters with the material properties and process conditions are investigated. Within that scope, bypass parameter (100-C) was found to be changing with the throughput of the classifier. In other words, increasing the classifier feed tonnage increased the bypass value. When the behaviours of the components were taken into consideration, the component with the higher specific gravity had the higher bypass value. In addition, the cut size of the classification was found to be inversely proportional to the bypass values. Changing the specific gravity from 2.3 (gypsum) to 3 (clinker), decreased the cut size from 38.4 to 34.88 µm for survey 1 and from 37.32 to 35.03 µm for survey 2.
The mill model was developed according to the perfect mixing approach, where the function of breakage rate and discharge was calculated. The studies showed that clinker, as the hardest component, had the lowest value of r/d, while limestone had the highest rate of breakage. The modelling studies also proved that the calculated r/d values changed with the feed-material composition. Since the second survey was performed with a larger amount of limestone, the r/d value was found to be higher than that of the first survey. In addition, increasing the limestone content in the second survey resulted in a lower rate of breakage for both the clinker and the gypsum components. This conclusion is considered important, since it proves that the model responds to changes in feed material composition, so the simulation studies are expected to be sensitive in that direction.
Überschrift Bezahlschranke (EN)
tab ZKG KOMBI EN
This is a trial offer for programming testing only. It does not entitle you to a valid subscription and is intended purely for testing purposes. Please do not follow this process.
This is a trial offer for programming testing only. It does not entitle you to a valid subscription and is intended purely for testing purposes. Please do not follow this process.
tab ZKG KOMBI Study test
This is a trial offer for programming testing only. It does not entitle you to a valid subscription and is intended purely for testing purposes. Please do not follow this process.
This is a trial offer for programming testing only. It does not entitle you to a valid subscription and is intended purely for testing purposes. Please do not follow this process.