Development of sustainability in the cement industry

1 Introduction
Cement production is responsible for approximately 5 % of all man-made global CO2 emissions. The fact that pursuing the objective of sustainability is a rewarding undertaking is shown by the sustainability initiative undertaken by cement producers in partnership with the World Business Council for Sustainable Development (WBCSD). In 1999 the Cement Sustainable Initiative (CSI) was founded by ten leading international companies. These pioneering companies were Lafarge, Holcim, HeidelbergCement, Cemex, Italcementi, Cimpor, RMC, Siam Cement, Taiheiyo and Votorantim. RMC was later...
1 Introduction
Cement production is responsible for approximately 5 % of all man-made global CO2 emissions. The fact that pursuing the objective of sustainability is a rewarding undertaking is shown by the sustainability initiative undertaken by cement producers in partnership with the World Business Council for Sustainable Development (WBCSD). In 1999 the Cement Sustainable Initiative (CSI) was founded by ten leading international companies. These pioneering companies were Lafarge, Holcim, HeidelbergCement, Cemex, Italcementi, Cimpor, RMC, Siam Cement, Taiheiyo and Votorantim. RMC was later taken over by Cemex. CRH has taken RMC‘s place in the TOP 10. Meanwhile, the number of cement producers in the CSI has grown to more than 23 and includes such names as Argos, Cimentos Liz, CNBM, Shree Cement, Sinoma, Titan and Ultratech.
In 2002, the WBCSD published a Battelle Study on the development of sustainability in the cement industry [1]. The related “Substudy 8” concerned the climate change and reduction of CO2 emissions [2]. This examined the strengths and weaknesses of the cement industry in this sector and essentially presented appropriate measures and recommended actions that are still valid today. The companies involved undertook to carry out an action plan [3]. The results of a situation appraisal of more than 40 cement producing companies carried out by the WBCSD were presented in a study published in 2009 [4]. However, the sustainability initiative is still a work in process and the cement industry will have the issue of CO2 emissions on its hands for a long time to come [5]. Aside from the subject of CO2, aspects such as reduction in power consumption, conservation of resources and reduction of other emissions remain interesting from an environment protection point of view.
2 Structural data regarding the sustainability TOP 10
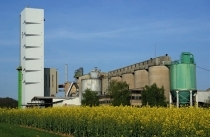
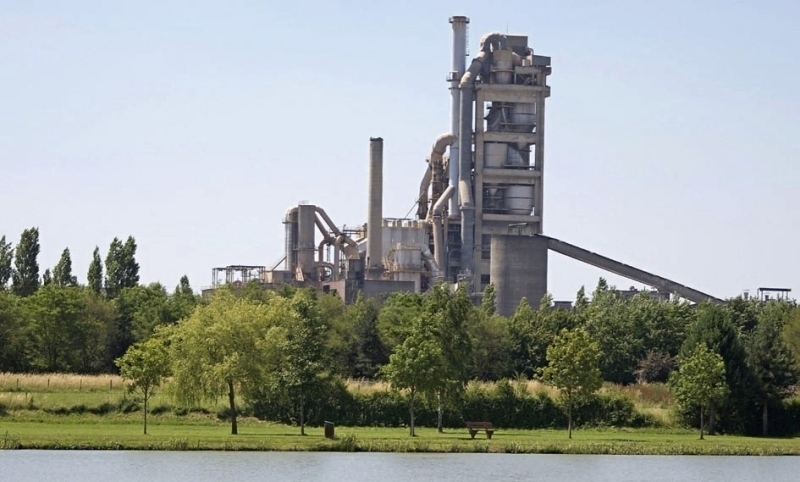
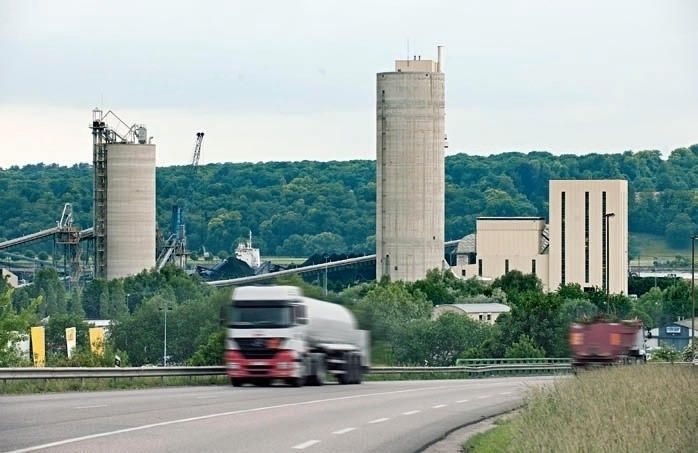
The ten pioneering companies mentioned in Section 1 with respect to sustainability have a total cement production capacity of 883 million tonnes per year (Mta) (Fig. 1). Lafarge ranks as No. 1 with a capacity of 217 Mta, closely followed by Holcim with a capacity of 211.5 Mta. Other members of the TOP 5 are HeidelbergCement (116.4 Mta), Cemex (96.1 Mta) and Italcementi (75.0 Mta). The other pioneering companies Taiheiyo, Cimpor, Votorantim, Siam Cement and CRH have a total cement production capacity of 167 Mta. For the TOP 5, Table 1 shows the cement production capac-ities, the number of integrated cement plants and the number of separate grinding plants. The cement production capacity of 716 Mta is spread over 417 integrated plants and 139 separate grinding plants. With its 125 plants, Lafarge (Fig. 2) owns the largest number of integrated plants, while Holcim has the largest number of separate grinding plants (Fig. 3).
3 Reduction of CO2 emissions
The EU has the most stringent CO2 regulations in the world. Within the framework of the EU‘s climate protection targets and its allocation of CO2 emission rights, a benchmark of 766 kg of CO2 per tonne of clinker was set for the cement manufacturing industry. According to a study by Cembureau, the European cement association, this target is achieved by less than 10 % of all plants. In Western Europe, the average value is 858 kg of CO2 per t of clinker (respectively 643.5 kg of CO2 per t of cement with a clinker/cement factor of 0.75). 5 % of all plants even have emission levels in excess of 1000 kg of CO2 per t of clinker.
As a comparison, Fig. 4 shows the worldwide performance of the TOP 5 sustainability companies. It can be seen that many plants already have CO2 emissions that are substantially below the EU target. Lafarge, for example, achieves an average gross value of only 626 kg of CO2 per t of cement, while Cemex has a net emission of 629 kg of CO2 per t of cement.
It is obvious that, with the exception of Italcementi, the companies have managed to significantly reduce their specific CO2 emissions. Lafarge cut its emissions by 19.7 %, while HeidelbergCement reduced its emissions by 17.9 %, thereby surpassing its self-imposed goal of 15 % to be achieved by 2010. Up to 2015, the company now aims at a reduction by 23 % with reference to 1990. However, it can also be seen that Italcementi‘s CO2 emissions show a relative stagnation since 1990. The emission figures of Taiheiyo and Cimpor (Fig. 5) have also stagnated in recent years. However, another point illustrated by this figure is a failure to publish relevant data, or a lack of data transparency in the sustainability reports of some companies. In some cases, time basis data are missing or no data is provided for individual years.
At present, the average CO2 emission figures of the companies are determined by the respective plant portfolio, the age of the plants and the plant modernization projects that have been completed. Taking the example of Italcementi, it will be noted that considerable differences exist between plants in developed markets and plants in emerging markets (Fig. 6). In emerging countries the latest figures were approximately 7 % worse, which is explained by non-modernized plants, low percentages of alternative fuels and a higher clinker factor. Correspondingly, the most important parameters for emission reduction are the power consumption, the clinker factor and the use of alternative fuels. The “Cement Technology Roadmap” [5] assumed that the CO2 emission rate could be reduced from 750 to 420 kg/t of cement by the year 2050. However, in theory a considerable portion of this would have to be achieved by the employment of CCS technologies (CCS = Carbon Capture & Storage).
4 Energy consumption/waste heat utilization
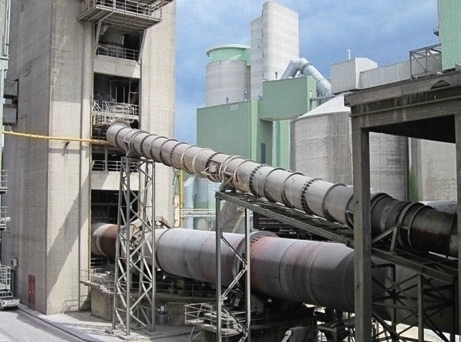
It is no longer possible to improve the thermal efficiency of the clinker production process at will. It is today considered that the lowest possible heat requirement with best available technology and a 6-stage preheater is just under 3000 kJ/kg of clinker [7]. An overview of the heat requirement of German cement plants in recent years (Fig. 7) shows that no further improvements have been achieved since 1995 [8]. Only a few new production lines (Fig. 8) have been constructed and the specific heat requirement has again risen slightly. This may be due to the shutting down of plants that had a comparatively low heat requirement or to older plants gaining a larger market share because other plants have been closed down. On the other hand, in recent years there have been only a few kiln system modernization projects in Germany.
Figure 9 shows the development in specific heat requirement at the TOP 5 sustainability companies. Except for Italcementi whose figures are somewhat higher, the heat requirements of the leading companies are approximately the same. Holcim has the best data, the last published average specific heat consumption figure being 3555 kJ/kg of clinker. One of the reasons for this low heat consumption is the large proportion of Indian plants in the Holcim cement portfolio. For instance, ACC with its 16 cement plants had a specific heat consumption of 3137 kJ/kg of clinker. Last year the consumption figures of 11 production plants in India were reduced even further. However, apart from Holcim no other member of the TOP 5 showed a significant reduction in heat consumption. This also applies to the companies outside the TOP 5. Indeed, the specific heat consumption figures of Taiheiyo and Siam Cement have again risen. From 1990 to 2009, Cimpor reduced its heat consumption continuously from the initial figure of 3794 kJ/kg of clinker, but in 2010 there was again a distinct increase to 3635 kJ/kg of clinker.
The prognosis [5] up to 2050 is that there will be a global reduction in average heat requirement to 3200 to 3300 kJ/kg of clinker (Fig. 10). Although the substitution of older plants could provide the conditions for a relatively quick improvement up to the year 2030, hardly any optimization potential will remain after that date. No technological improvements on today‘s state of the art are in sight. The situation with regard to the specific electrical energy requirement is very different (Fig. 11). In this sector only a slight improvement can be expected up to 2030. This is partly due to the trend to composite cements and finer grinding, which require more grinding work. After 2030, a greater reduction in specific electrical energy requirement will only be achieved if low energy consumption grinding processes and energy saving motors are rigorously employed.
If systems for heat recuperation and subsequent energy generation from waste heat are installed, 30–45 kWh/t of clinker can be produced, depending on the technology employed, which is up to 30 % of the electrical power requirement of a cement plant [9]. The benefits of this technology are clear. With increasing power and energy costs the systems will become more and more cost-effective and CO2 emission reduction incentives will provide additional motivation to install. Up to the end of 2009 there were already 525 waste heat recovery systems in operation or under construction in the cement industry (Fig. 12), most of them in China. By the year 2020 this number is expected to increase to 1500. The short-term and long-term prospects for WHR systems in the cement industry are correspondingly good. After Japan and China, there is also an increasing market potential in the rest of the world.
5 Reduction of the clinker factor
Reduction of the clinker factor has a considerable positive effect on CO2 emissions. However, a reduction of the clinker factor is subject to two important limiting factors. Firstly, suitable clinker substitutes have to be available. The worldwide supply amounts to approx. 200 Mta of granulated blast furnace slag, 500 Mta of hard coal fly ash and 300 Mta of natural pozzolana. However, it is estimated that only 60–70 % of these materials fulfill the quality requirements of the cement industry. This means that local delivery bottlenecks are to be expected. The second important point is the standardization of corresponding Portland composite cements and consumer acceptance of these cements. In developed markets there are already signs that the demand for composite cements is saturated, but in markets like India and China it is still growing. In India, composite cement already accounts for 75 % on average of all deliveries.
There are signs that clinker factor reduction is also approaching stagnation point in the TOP sustainability companies (Fig. 13). Of the companies shown, only Lafarge has managed to achieve significant improvements. Although Holcim has only made a slight improvement, it still has the lowest figure of all the companies with a clinker content of 71.5 % or 71.5 kg of clinker/100 kg of cement. Here, too, the main reason is likely to be the great significance of the company‘s Indian subsidiaries and their relatively low clinker content. Italcementi has the highest clinker content of 81.6 % and has displayed an overall upward tendency in the years under consideration. In 2010, Holcim, HeidelbergCement and Cemex also registered stagnating or rising clinker content figures. In the case of HeidelbergCement, this was due to limited material availability in a period of increasing cement sales.
6 Alternative fuels
A comprehensive and up-to-date report was presented in [10]. Substitution of conventional fossil energy sources with surrogate fuels with co-processing of the refuse materials in the cement plant can result in a reduction in the production of greenhouse gases such as CO2, SO2 and NOx compared with the emissions produced by separate refuse incineration and cement production. The refuse materials employed by the industry are referred to as AFR (Alternative Fuel and Raw material). Depending on the proportion of AFR employed, conventional fuel substitution rates of 0 to almost 100 % are conceivable, have already been effected or are at the implementation stage. Taking the example of HeidelbergCement, who play a leading role on this sector, Fig. 14 shows the range of alternative fuels that are used. The fact that the percentage portions have varied greatly in recent years would indicate that the companies have to constantly adapt to changes in the material on offer.
The achieved substitution rates of the leading sustainability companies in the cement industry are shown in Fig. 15. Up to 2009, HeidelbergCement had a relatively clear leadership in alternative fuel use. In 2010, Cemex drew very close with a 20.3 % proportion of alternative fuel. Cemex intends to increase this figure to 35 % by 2015 and would thus probably take over the leadership. Lafarge and Holcim both have midfield rankings while Italcementi is placed relatively far down the list. With regard to CO2-neutral biofuels (Fig. 16), HeidelbergCement was also the leader for many years, but Cemex has now drawn level. However, the actual market leader is Siam Cement, who already reached a biofuel content of 13.3 % in 2008. However, the company‘s figures are not constant; for instance, in 2010 the content of biofuels was only 8.8 %.
In 2006, the estimated proportion of alternative fuel used in developed countries was 16 %, while in the emerging countries it amounted to 5 % [5]. By the year 2030, the aim is to increase these amounts to 40–60 % and 10–20 % respectively. For the year 2050, developed countries are expected to maintain their usage level at 40–60 %, while the emerging countries should have raised their alternative fuel usage to 25–35 %. Compared with today‘s situation, this means that efforts have to be increased by a factor of 3 to 7 in order to achieve the ambitious objectives. The progress achieved up to now with the use of alternative fuels would not have been possible without the vigorous participation of cement producers through the establishment of their own preparation plants or without the willing assistance of the population, for instance in the collection of plastic waste materials. However, it is justified to question whether the positive experience gained in this respect in northern Europe is transferable to the rest of Europe.
7 Other emissions/conservation of resources
The other permanently monitored emissions that are relevant for cement plants (Fig. 17) are nitrogen oxides (NOx), sulphur oxides (SOx) and dust emissions. The NOx emission limit values of significantly less than 500 g/ Nm3 are practically impossible to achieve without the use of primary and secondary reduction measures. Primary measures involve maintaining uniform kiln operation with optimum operating conditions, using low-NOx burners and firing systems, flame cooling and a split firing system in the calciner. Secondary measures include selective noncatalytic reduction (SNCR) and selective catalytic reduction (SCR) using nitrogenous reducing agents such as NH3. At present, the NOx concentrations in the exhaust gas of rotary kiln systems equipped with modern calciners without secondary reduction measures are in the range of 0.5 to 0.9 g/Nm3 (stated as NO2 equivalent), depending on the fuel and the plant technology.
Figure 18 shows the development of NOx emissions of the TOP 5 sustainability companies. The selected reference variable is the quantity of clinker or cement produced. Holcim and HeidelbergCement have the lowest emission figures, while Lafarge and Italcementi have the highest. Except for Holcim all the companies showed increasing emission figures in 2010. In the case of SOx (Fig. 19), Holcim and Cemex are the TOP performers. At present, Lafarge and HeidelbergCement are not so well placed in this regard. Except for HeidelbergCement, all the companies were able to continuously reduce their specific NOx emissions in the last three years. By an international yardstick, Siam Cement has an excellent SOx emission figure of 69 g/t of clinker, and its NOx figure of 817 g/t of clinker is also remarkable.
Figure 20 shows the development of the specific dust emissions of the leading companies. Cemex has meanwhile taken over the leading position ahead of Holcim and was able to cut its emissions by 45 % over a period of three years. HeidelbergCement (Fig. 21) was able to reduce its emissions by 35 % but the company‘s recent figures show a slight increase. In contrast, Italcementi‘s dust emission figures are stagnating. Taking Italcementi as the yardstick, it can be seen that in developed countries the specific dust emissions made up just 17 g/t of clinker in 2010, while in the emerging countries the average figure of 299 g/t of clinker was higher by almost a factor of 9. This shows that a great potential for improvement exists in those countries.
In recent years, attention has focused on water consumption and the general conservation of resources in the cement industry. A cement plant using the wet process consumes around 0.65–0.7 m3 of water/t of clinker, while a plant using the dry process only needs 0.15–0.25 m3 of water/t of clinker. The greatest quantity is consumed in the clinker manufacturing process (gas conditioning, wet scrubbing of NOx and SOx, machine cooling) and in the cement grinding section. In this segment the data from the different companies are not really comparable because no precise definitions are made regarding process water or whether, for instance, cooling water is used for inhouse power stations or for dust avoidance measures.
8 Prospects
On the way to sustainability in the cement industry the leading companies have taken their voluntary commitment very seriously and most of them have surpassed the targets set for the period up to 2010. The 10 leading cement producers in Western Europe were able to derive an economical benefit from their CO2 emission trading of 537 and 716 million Euros in the last two years [6]. On the other hand, the implemented environmental protection measures have also cost a large amount of money. Lafarge, for instance, spent about 58 % of its R&D budget of 152 million Euros on the development of sustainability in 2010. However, it must also be mentioned that numerous kiln lines operated by the major companies are not yet equipped with continuous emission monitoring devices, so that there is plenty of scope for further action.
Überschrift Bezahlschranke (EN)
tab ZKG KOMBI EN
This is a trial offer for programming testing only. It does not entitle you to a valid subscription and is intended purely for testing purposes. Please do not follow this process.
This is a trial offer for programming testing only. It does not entitle you to a valid subscription and is intended purely for testing purposes. Please do not follow this process.
tab ZKG KOMBI Study test
This is a trial offer for programming testing only. It does not entitle you to a valid subscription and is intended purely for testing purposes. Please do not follow this process.
This is a trial offer for programming testing only. It does not entitle you to a valid subscription and is intended purely for testing purposes. Please do not follow this process.