Outlook on the gypsum industry
 Kunooz Gypsum
 OneStone Research
 OneStone Research

 OneStone Research
 OneStone Research

 Gebr. Pfeiffer
 OneStone Research
 American Gypsum
 Knauf Group
 OneStone Research
 OneStone Research
 OneStone Research
 Kunooz Gypsum
 OneStone Research
 OneStone Research
 STRABAG
 OneStone Research
 Sinait
The gypsum industry is undergoing a number of very important changes. The Covid-19 pandemic is having a major impact in 2020, but despite the projected decline this year, the future looks bright. This market review outlines the megatrends for the gypsum industry, including the future of mined and synthetic gypsum and what future demand is to be expected from the cement, wallboard and plaster industries. All data have been extracted from a new market report by OneStone Consulting, which has recently been published.
1 Introduction
OneStone Consulting Ltd. published a new market report with the title “Gypsum Industry Focus 2030” [1]. In this multi-client market study, a breakdown of the global gypsum industry is provided on the basis of worldwide data, 14 world regions and 67 gypsum-producing and consuming countries. These countries (Figure 1) make up 98 % of global gypsum mining and almost 100 % of global wallboard production in 2019. The report covers the period from 2018 to 2020 for each single year and provides an outlook for the years 2021, 2025 and 2030. The market figures in all the segments show...
1 Introduction
OneStone Consulting Ltd. published a new market report with the title “Gypsum Industry Focus 2030” [1]. In this multi-client market study, a breakdown of the global gypsum industry is provided on the basis of worldwide data, 14 world regions and 67 gypsum-producing and consuming countries. These countries (Figure 1) make up 98 % of global gypsum mining and almost 100 % of global wallboard production in 2019. The report covers the period from 2018 to 2020 for each single year and provides an outlook for the years 2021, 2025 and 2030. The market figures in all the segments show that Covid-19 has a major impact on the gypsum industry and the demand in 2020. However, for the gypsum industry the decline is not as large as for the cement industry.
The main questions in the gypsum industry are: How will demand for gypsum continue this year and in the next few years? Which sources can be used? What does the split between mined gypsum and synthetic gypsum look like and what share will recycled gypsum achieve? How will the different countries develop, which countries will increase their market shares and how large will the imports be. What about the gypsum demand for the cement industry, how will it develop? How will the demand for wallboard develop; what about fibreboard, plaster blocks and gypsum ceiling tiles? What is the demand for plaster powder and what is the share for mined and synthetic gypsum in all these different applications. Finally, plant investors and suppliers like to know how the capacity expansion will continue and where the promising projects are.
2 Overall industry data
The global gypsum industry has an annual turn-over of almost US$ 23 billion. However, there are very large price differences in the products. The lowest prices are achieved by synthetic gypsum and mined gypsum, while the highest prices are achieved by the calcined products, which are used in the production of wallboard, fibre board, gypsum blocks, ceiling tiles and specialized plasters. Worldwide in 2019, according to OneStone Research, a total of 310.8 million t (Mt/a) of gypsum have been used by the different industries. Figure 2
shows the split into the type of gypsum used and which amount is calcined and which is uncalcined. Accordingly, the largest amount is mined gypsum with almost 55 %, synthetic gypsum accounts for about 44 %, while only less than 1 % is recycled gypsum (from wallboard production and from construction and demolition waste).
About 42.1 % of all gypsum used is calcined, while the majority is uncalcined. Most of the uncalcined quantity is used in the global cement industry, which is also the largest consumer with 166 Mt/a or 53.4 % of the gypsum demand (Figure 3). 28.6 % are used by the wallboard industry, another 2.0 % for panels/tiles (fibreboard, plaster blocks and ceiling tiles). The plaster industry (plaster powder, pre-mixed plaster products, fill and finish compounds) consumes 11.5 % of all gypsum. Finally, about 4.4 % are used for different applications such as agriculture (fertilizer) and use as an additive/filler (paints, coatings etc.). Other uses (reclamation, soil conditioning etc.) are not covered here.
Figure 4 illustrates the sources of gypsum for the main applications in 2019. In the cement industry the majority is mined gypsum with 53.8 %, while 46.2 % is synthetic gypsum and practically no recycled gypsum has been used. However, from country to country and region to region the shares of mined and synthetic gypsum are very different because of the available sources. In the wallboard industry, the majority of used gypsum is already synthetic with 53.0 %, while 44.3 % is mined gypsum and 2.6 % is recycled gypsum. FGD gypsum, which is derived from flue gas desulfurization (FGD) systems at coal-fired power plants, is the most used synthetic gypsum. This product is well accepted in the gypsum industry because of its good quality and price advantages against natural gypsum.
3 Gypsum use in the cement industry
The cement industry uses gypsum as a retarder. Most people would say that the average gypsum content in cement is around 5 %, but they might be surprised to learn that the global average is now below 4 %. The highest amount in some countries is still about 4.6 %, while there is now an increasing number of countries with only 3.8 %. By 2030 we expect the range to decrease slightly to 3.7-4.3 %. This has to do with a reduced use of ordinary Portland cements and the increasing share of blended cements (Figure 5), which need a lower sulphate concentration to adjust their setting times. Synthetic gypsum will also be increasingly favoured due to its higher purity. Accordingly, if the cement production were stable, then the gypsum demand would decline. Anyhow, in most countries the demand for cement is on the rise.
The cement production during the Covid-19 pandemic and the years thereafter was projected by us in a new market report [2]. Figure 6 shows the gypsum projection for the cement industry and the compound annual growth rates (CAGR) over the years. Accordingly, in the year 2020 a decline by 10.1 % in demand for gypsum is forecast, which will lead to a consumption of 149.3 Mt/a, after 166.0 Mt/a in 2019. In 2021, the demand will recover by only 1.9 %, leading to 152.1 Mt/a. However, this relatively low recovery is mainly due to the projected lower demand for cement in China. Without China, the demand for gypsum in the cement industry will recover in 2021 by 8.1 %. The global outlook for 2025 and 2030 also depends very much on the demand for cement in China, which is projected to further decline.
4 Gypsum use in the wallboard industry
On a global scale, the main source of gypsum in the wallboard industry is already synthetic gypsum, of which about 91.8 % is FGD gypsum and the balance to 100 % is phospogypsum, because the other synthetic gypsum types have not been used so far. Accordingly, over the last couple of decades many wallboard manufacturers moved to power plant locations (Figure 7). Synthetic gypsum is widely used in the wallboard industry and at some locations it substitutes natural gypsum by 100 %. Gypsum logistics have become a very important aspect (Figure 8). But markets will change. On the one hand, in Western Europe and North America we will see huge declines in FGD-gypsum, as many more coal-fired power plants are closed. In some other countries the opposite will happen. India e.g. is a country where synthetic gypsum production will truly explode. It seems that nearly every week a new FGD installation is made operational in one of the power plants.
Figure 9 shows the forecast for the global demand for gypsum wallboard. In 2020, the demand will decline by 7.3 % to 82.5 Mt/a, after 89 Mt/a in 2019. For next year, a recovery by 6.9 % to 88.2 Mt/a is projected. The market demand will grow further by a CAGR of 2.8 % from 2021 to 2025 and a further CAGR of 2.6 % by 2030. Accordingly, the gypsum demand for the wallboard industry will increase by 23.2 Mt/a or 26 % from 2019 to 2030. Most of this increase can only be compensated by an increase of synthetic gypsum and a larger synthetic gypsum share. Again, for the individual countries different projections have been made. While in China and other Asian countries the use of synthetic gypsum will largely increase, in Europe and North America the focus is on the improvement of logistical concepts, using larger amounts of mined gypsum as well as increasing the share of recycled gypsum.
At the moment the global wallboard capacity is more than 14.8 billion m2/year. Wallboard, which is also known as plasterboard, gypsum board, sheetrock or dry board, is manufactured in 492 wallboard plants around the world [3]. In total there are 554 operational lines, which results in an average capacity per line of 26.8 million t/year. The largest capacities are in North America with 4.03 billion m2/year, China with 3.99 billion m2/year and Europe with 2.84 billion m2/year. These three regions also have the largest average capacities per line of 45.2, 24.2 and 27.5 m2/year, respectively. On a global scale the capacity utilisation rate in the wallboard industry was 73.7 %.
5 Gypsum use in the other segments
These segments comprise 1. gypsum fibreboard, gypsum blocks and gypsum ceiling tiles, 2. plaster powder, pre-mixed plaster products, fill and finish plaster compounds as well as 3. applications such as agriculture (fertilizer) and as an additive/filler (paints, paper etc.). In the market report these segments are divided into the three subsegments plaster sector, gypsum blocks/tiles and other industries. While the gypsum blocks/tiles sector has the wallboard sector, the plaster sector has the overall construction industry (cement sector and wallboard sector) as its market driver. The market drivers for the other industries are mostly the food or the paints and coating industries.
The gypsum consumption in the other market segments will decline from 55.8 Mt/a in 2019 to 51.2 Mt/a in 2020, which corresponds to a decline of 8.2 % (Figure 10). Plaster covered 64% of this market in 2019, gypsum blocks/tiles made up 11.2 % and other use made up 24.7 %. By 2030 it is projected that the gypsum demand in this complete segment will increase to 63.5 Mt/a. The largest growth rates are forecast for gypsum blocks/tiles and other industrial use, while the lowest growth is projected for the plaster sector. Anyhow, in absolute terms, the largest growth is in the plaster segment, about 1.5 times bigger than the combined other two segments. It is interesting that in this sector mined gypsum is the dominating source with more than 70 %.
6 Outlook on mined gypsum
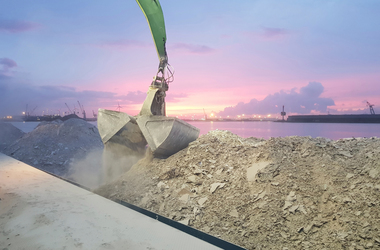
There are several data sources for the generation of mined gypsum, such as the World Mining Data, the BGS Mineral Statistics or the US Geological Survey. The data in these publications differ significantly from country to country. The data here are mostly derived from the World Mining Data, but they have been adjusted and projected to the future by taking several other sources and experts into account. Figure 11 shows our global projection from 2018 to 2030 and the corresponding CAGR. According to our projection, mined gypsum will decline from 169.9 Mt/a in 2019 by a CAGR of 10.6 % to 151.9 Mt/a in 2020. We expect a recovery by 4.8 % in 2021 and relatively small growth rates below 1 % in the next few years until 2030, so that mined gypsum will reach a level of 165.9 Mt/a. On a global scale, the share of mined gypsum will decline from 54.7 % in 2019 to 53.7 % in 2020 and finally to 50.6 % by 2030.
The main decline in mined gypsum will be in China, which mined 38 Mt/a in 2019. This is projected to fall to 13.5 Mt/a by 2030, which corresponds to the declining demand of the cement industry and the increased substitution of natural gypsum by synthetic gypsum. Natural gypsum output will decline in other countries too, such as Thailand or South Africa, mostly due to the ongoing depletion of the natural sources. The largest increase in natural gypsum output will come from the Middle East, particularly from Oman and Iran. Kunooz Gypsum in Oman (Figure 12) is already exporting more than 2 Mt/a and is in the process of acquiring additional mining areas. The company currently has two mining areas with a total surface area of 55 ha, and gypsum layers extending to a depth of 50 m. In 2019, the Sultanate of Oman has recorded gypsum exports of almost 9.0 Mt/a to its main recipient countries in Asia and South/East Africa.
7 Outlook on synthetic gypsum
In 2019, a total of about 397 Mt/a of different types of synthetic gypsum were generated worldwide. Phospogypsum is currently the most produced type of by-product gypsum globally, with about 62 % of all types. FGD gypsum accounts for 35 %, while other types such as flurogypsum, titanogypsum and others (marine gypsum) account for 12 Mt/a. Most of the synthetic gypsum has not yet found a use, due to quality issues, so that in 2019 not more than 138.4 Mt/a or 34.9 % have been used. Figure 13
shows the projected use for synthetic gypsum from 2018 to 2030. The quantities will increase by 28.1 Mt/a or more than 22 % from 2018 to 2030. However, there will be also a major decline from 138.4 Mt/a in 2019 to 128.3 Mt/a in 2020. This decline by 7.3 % is significantly less than the decline in mined gypsum. For 2030, a use of 153.7 Mt/a of synthetic gypsum is projected.
FGD- gypsum is still the dominant type of synthetic gypsum used. FDG gypsum is derived from the wet limestone once-through process (Figure 14),
which accounts for 80 % of all FGD processes. However, in many Western countries FGD gypsum production is declining, so that substitutions by other synthetic gypsum or mined gypsum have to be made. Up to now, relatively little of the generated phospogypsum is used. This will change going forward but growth rates are different from country to country due to problems with acceptance of the product. China, for example, will be using phospogypsum more often and in larger quantities. The use of flurogypsum and titanogypsum by the gypsum industry will continue to be rare due to environmental concerns. Use of marine gypsum, which is one of the other types, is growing in prevalence in France and India, albeit from a low level. At the end of the day it’s a question of the product prices, availability, adequate logistics material handling and processing facilities.
8 Outlook on recycled gypsum
In 2019, about 2.6 Mt/a of gypsum was recycled globally from wallboard waste and gypsum construction and demolition waste. This is less than 20 % of the gypsum waste being produced each year, which is estimated to be in a range of 15 Mt/a to 17 Mt/a. However, the quantities are expected to double in the next ten years. More than 90 % of the gypsum waste is derived from wallboard waste, and can be collected as off-cuts at wallboard manu-facturing plants, construction sites or as waste from deconstruction sites [4]. Up to now, gypsum waste from demolition has hardly been used for recycling because of the possible contamination with harmful products and corresponding processing costs. In standard recycling plants (Figure 15),
which mostly have capacities of less than 0.1 Mt/a, the gypsum material is separated from the plasterboard paper and other foreign materials. However, the market is booming and gypsum recycling will gain in importance in the future, especially in Europe, North America and some Asian countries.
Figure 16 shows the massive increase in recycled gypsum from the relatively low levels in 2018 and 2019. According to the projection, the output of recycling plants will more than triple by 2030. Even for 2020 a further growth by 7.7 % is projected compared to 2019. For the coming years the CAGRs are in the double-digit range above 12 %. The proportion of recycled gypsum in the total gypsum use will increase from below 0.8 % in 2018 to about 1.1 % in 2021 and 2.9 % by 2030. In many countries gypsum recycling is now receiving political and financial promotion due to environmental protection issues, as well as resource and energy efficiency. For the proposed use of recycled gypsum, the quality issue is in the major focus. Accordingly, technology developments are on the agenda.
9 Outlook on plant expansions
OneStone has identified 98 gypsum capacity expansion projects that will become operational from 2020 on. These projects come after 23 projects which were finished in 2019 alone. The majority of the projects concern wallboard lines and complete new greenfield wallboard plants. In total these are 76 projects with a total new capacity of 1.47 billion m2/year, or on an average 19.3 Mm2/year per project. The other identified projects include gypsum calcination and partition walls. There is one very interesting fact: the share of calcined gypsum in the total demand for gypsum will greatly increase from 42.1 % in 2019 to 48.5 % by 2030. This corresponds to almost an additional 29 Mt/a of calcined gypsum. Accordingly, a huge amount of calcining capacity will have to be installed in the coming years.
//www.o" target="_blank" >www.o:www.onestone.consulting
Überschrift Bezahlschranke (EN)
tab ZKG KOMBI EN
This is a trial offer for programming testing only. It does not entitle you to a valid subscription and is intended purely for testing purposes. Please do not follow this process.
This is a trial offer for programming testing only. It does not entitle you to a valid subscription and is intended purely for testing purposes. Please do not follow this process.
tab ZKG KOMBI Study test
This is a trial offer for programming testing only. It does not entitle you to a valid subscription and is intended purely for testing purposes. Please do not follow this process.
This is a trial offer for programming testing only. It does not entitle you to a valid subscription and is intended purely for testing purposes. Please do not follow this process.