Energy efficiency in the German cement industry against the background of more stringent energy policy targets and rising energy costs – Part 1
Increasingly stringent political demands are being imposed on the energy productivity of the industry. In a plant-specific investigation, the savings potential for electrical energy, fuels and CO2 emissions of the German cement industry in the period 2013 to 2035 was studied within an economic framework. Part 1 contains the applied method and initial calculations.
1 Introduction
The cement industry is characterized by a particularly high share of energy costs to the gross value added, and is therefore classified as an energy-intensive industry. Because they represent such a high portion of overall expense in an industry that mainly produces standardized goods, the specific energy costs are often critical competitive factors and as such were already in the focus of plant owners long before the term “energy efficiency” became omnipresent in the political world. In the last two decades, political decision-makers have realized that energy efficiency can...
1 Introduction
The cement industry is characterized by a particularly high share of energy costs to the gross value added, and is therefore classified as an energy-intensive industry. Because they represent such a high portion of overall expense in an industry that mainly produces standardized goods, the specific energy costs are often critical competitive factors and as such were already in the focus of plant owners long before the term “energy efficiency” became omnipresent in the political world. In the last two decades, political decision-makers have realized that energy efficiency can make a cost-effective contribution to the elimination of three main energy-political challenges: climate change, large-scale exploitation of fossil resources and security of supply (EIPPCB 2009). Since the Kyoto protocol came into effect in 2005, the subject of energy efficiency has been given great emphasis on all political levels. Before examining these levels in detail, we should establish a common understanding of the term “energy efficiency” (see energy efficiency box).
The binding targets for the limitation and reduction of greenhouse gas emissions that were agreed for the first time under international law in the Kyoto protocol laid the foundation for political regulations on the European and national levels (cf. Solomon et al. 2007). The European EU trading of emission rights (EU ETS) introduced in 2005, with the purpose of achieving the Kyoto targets at minimum cost must, is certainly one of the most controversial political instruments. Its stated aim was to reduce the emission rates of 2005 by 21 % up to the year 2020. On the basis of the 2010 figures, this would involve an annual reduction of 1.74 %. In the third phase, relating to the period 2013 to 2020, free-of-charge certificates are, for the first time, not being issued on the basis of historical emissions, but in accordance with the benchmark of a plant in comparison with the best available technology (BAT) (EC 2009; Ecofys et al. 2009a). Ultimately, an emission exemption limit of 766 kg CO2 per tonne of clinker was decided upon (CEMBUREAU 2011). The planning for the period after 2020 provides for the endangered sectors to receive a free allocation of CO2 certificates amounting to a maximum of 25 % of the BAT benchmark. It is intended that this percentage will be reduced to zero by 2027.
In concrete terms, the objectives regarding energy efficiency were ratified by the European Commission as “20/20/20-targets” in 2008. One of the three pillars of this target is the reduction in EU primary energy consumption by 20 % compared to a forecast development. To enable the achievement of this target, the industrial sector must reduce its primary energy consumption by 19 % (cf. EC 13.11.2008). On 04.12.2012, the EU Energy Efficiency Directive (2012/27/EU) came into force. This obliges the EU member countries to stipulate indicative national energy efficiency targets. In particular, the EU countries are obliged to cut the amount of energy distributed or sold to final customers by an average of 1.5 % per year in the period 2014 to 2020 by implementing energy efficiency measures (cf. Seefeld and Weinert 2013).
On the national level, the German energy concept is oriented along the lines of the EU stipulations. One fundamental objective is to reduce the primary energy consumption by 50 % of the 2008 figure by the year 2050. This particularly depends on achieving a 2.1 % p.a. increase in energy productivity and a 10 % reduction in power consumption by 2020 and 25 % by 2050 relative to the 2008 figures. In addition, the capping of the energy and electricity tax for the most energy-intensive users will only be upheld, if the companies involved make their contribution to reducing power consumption. This contribution can be verified by certified records in energy management systems or by equivalent measures. Other tax benefits are also to be linked to the implementation of energy management systems in accordance with international standards (EN 160001, ISO 50001). At the same time, an energy efficiency fund will also be established to support, inter alia, the optimization of energy-intensive processes in the producing industry (BMU 2010).
The upshot is that the subject of “energy efficiency” – whether for political or economic reasons – will move more and more into the focus of German industrial companies. Against this background, the potential for reducing power consumption in the German cement industry was examined on the basis of energy-saving measures described in the literature by individually considering the existing German plants. For the purpose of discussion, marginal cost curves for energy saving were created, as these depict both the effectiveness of individual measures and the overall savings potential within an economic framework. The curves serve to visualize the economic savings potential, on the one hand, while, on the other hand, allowing the costs for compliance with political stipulations to be derived. As the last step, the dynamics of potential economic energy-savings were investigated with regard to varying CO2 and energy prices and conclusions were drawn with respect to their consequences for the average energy-related production costs of the German cement industry in the period 2013 to 2035.
2 Method
2.1 System boundary
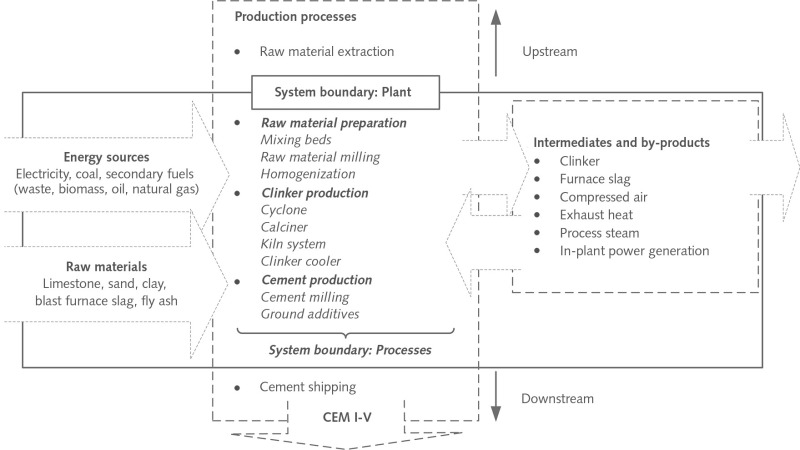
The smallest system boundary in this investigation is the process level (Fig. 1). This is where the respective educts and products are balanced per process stage, and the consequences of energy saving measures are evaluated to this balance. This perspective enables a comparison of the effectiveness of measures with regard to their costs and energy-saving effect. However, it has to be taken into account that the sum of the individual considerations on the process level does not necessarily reflect the situation in the plant as a whole. In particular, insufficient account is taken of measures that – for instance – are associated with different processes, but are intended to share the same waste heat. In order to take account of this competition between measures, and thus be able to reach conclusions about the total savings potential of a plant, the system boundary has to be extended to the complete plant (Fig. 1). To reach this system boundary, competing measures have to be excluded according to defined criteria (section 2.3.1), and this inevitably results in a reduction of the energy-saving potential compared to the process level.
2.2 Data set
As a first step, the plant data required for this investigation, such as type of plant, production capacity, year of construction and year of last modernization, were taken from general publications (e.g. CSI 2012; UBA 2012; USGS 2012; Bund Sachsen 2008; Edwards 2011; Harder 2006) and then extended by adding plant-specific data from company web sites (e.g. plant presentations, environmental and energy reports) and from articles in regional and national newspapers. Reports in industry journals about implemented efficiency also allowed conclusions to be drawn with regard to the plant data. If capacity data were not available from these sources, the following factors were assumed for the conversion of capacities:
330 production days per year,
cement production = clinker capacity+ 20 %
raw material preparation = clinker production capacity x 1.65
The obtained data set was then compared with the aggregate figures for the number and capacity of cement kilns in Germany provided by the VDZ (2012a). It is noticeable that the IER data include one kiln less than the VDZ data and that the total daily capacity is 6 % lower than that stated by VDZ. The last point can be explained by differences in the conversion factors (e.g. 320 production days per year cf. VDZ 2012a), by rounding figures off, or simply by the use of outdated or erroneous data in the reviewed material. In consideration of the fact that Achternbosch and Bräutigam (2000) also found similar deviations in their study of cement clinker manufacturing in Germany and that our data for the mean daily capacity of cyclone preheater kilns is in accordance with the VDZ data (Tab. 1), it can be assumed that the computed data set adequately reflects the real circumstances. For a detailed list of the plant data see Brunke and Blesl (2014).
For identification of the potential energy-saving measures, the first step was to compare the international literature (cf. Hasanbeigi et al. 2013a; Madlool et al. 2013; Sathaye et al. 2011; NEDO 2008; Worrell and Galitsky 2008) with the information in European (cf. EIPPCB 2010; CSI/ECRA 2009) and German literature (cf. Schlomann et al. 2011). The focus was set on commercially available measures and to a limited degree and widely discussed future technologies. Theoretical concepts like presented in Betz et al. (2014) were out of scope. The list of measures with source information is shown in Table 2.
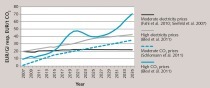
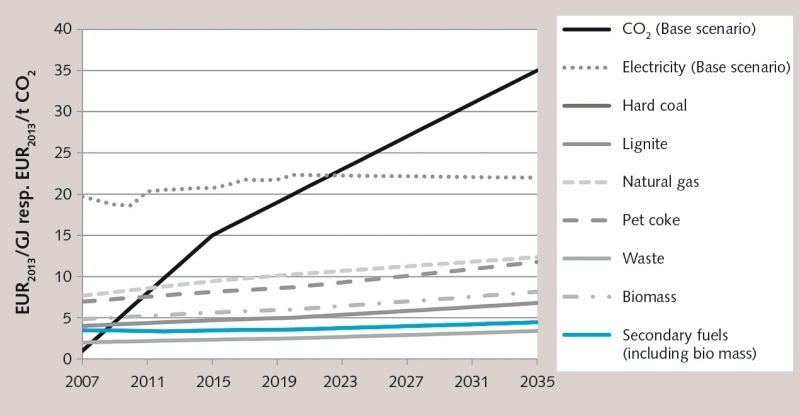
In order to calculate the economic savings potential, the achieved savings have to be evaluated in monetary terms. For this purpose, the prices stated by Schlomann et al. (2011) for CO2 certificates and fuels were taken. The electricity prices are based on the data stated by Seefeld and Claaßen (2011) and were extrapolated for the period after 2020 on the basis of Fahl et al. (2010) (Fig. 2).
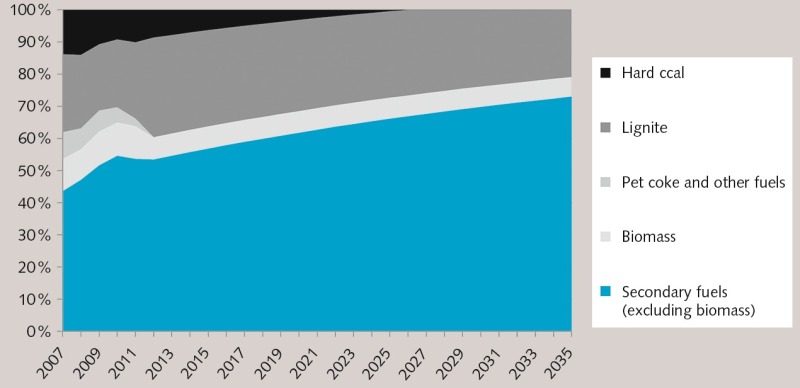
The use of secondary fuels (SF) is a special case, because of their composition is made up of energy sources and waste materials. For several reasons, this investigation distinguished between biomass and non-biomass constituents (Fig. 3). For one thing, there is increasing competition for the use of biomass, and it can be assumed that although the total proportion of SF in the overall fuel mixture will increase, the available absolute quantity of biomass will remain constant in the future. Furthermore, it is important to distinguish between biomass and non-biomass because of the CO2 costs. EC regulations (2012) classify biomass, which fulfills the sustainability criteria, as emission-free in the sense of European emission trading (EU ETS), which offers an additional cost benefit for plant owners.
2.3 Calculation of energy-saving potential
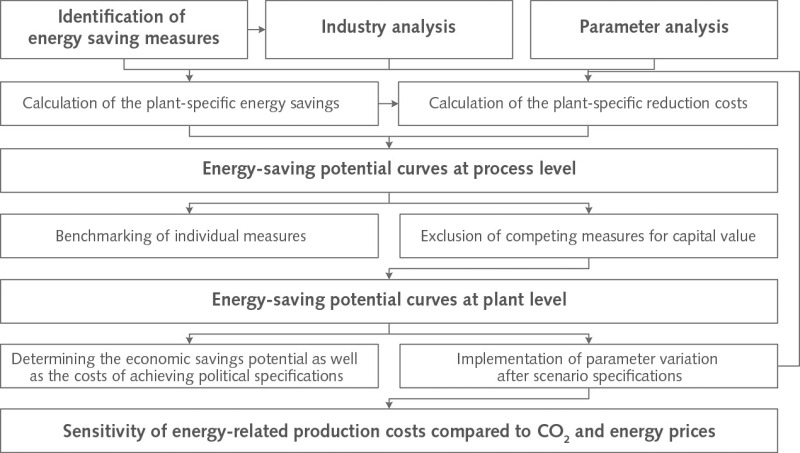
A short explanation of the method used for calculating the energy-saving potential is provided in order to assure traceability and transparency of the results (Fig. 4). Among the information delivered by identification of potential energy-saving measures during the first step are the plant-specific parameters that have to be determined in the analysis of the industry. If the data set is consistent, the calculation of savings potential and mitigation costs can be commenced on the process level. However, in order to reach conclusions about the total savings potential, competing measures have to be taken into account (section 2.1). Following the approach of neoclassical theory (actors maximize their individual utility), the measure with the respectively highest capital value is implemented per process and plant. Subsequently, the economic savings potential of the German cement industry can be determined by means of the marginal cost curves for energy saving. This, in turn, serves as the basis for determination of the effects on energy-related production costs (fuels, electricity, CO2 certificates) in the sensitivity analysis.
2.3.1 Calculation of the plant-specific
energy-saving potential
The energy-saving potential ESavk, i of a measure k is individually calculated for each plant i. In the first step, the preconditions for implementation of the measure are verified:
plant i is in operation and not shut down
according to the latest state of knowledge, plant i will not be shut down in the next three years
measure k has not yet been implemented at plant i
plant i fulfills the technological requirements for the respective measure (Tab. 2).
In the case of regular measures, the calculation of specific electricity ElSavk and fuel savings FlSavk and the annual capacity takes place by means of
ESavk, i = ((FlSavk + ElSavk) ∙ Capi).
Moreover, measures that are particularly dependent on plant-specific parameters Xi, k, such as the proportion of granulated blast furnace slag in the grinding of cement, are separately taken into account. The energy savings ESavk, i then result from the difference between the maximum value Xmax, k and the actual plant value Xi, k, a conversion factor Yk and the annual capacity Capi , producing the equation:
ESavk, i = ((Xmax, k – Xk, i) ∙ Yk ∙ Capi).
The total savings ESavk of a measure k ultimately result from the sum over the plants i. The reductions in CO2 emissions are calculated analogously.
2.3.2 Calculation of the marginal reduction costs
Calculation of the marginal reduction costs takes place in three steps:
In the first step, the payment flows CFk, i, t per plant, per measure and per year t are determined. These are composed of the reduction in fuel costs (FlSavk ∙ ElCostt), electricity costs and CO2 costs (CSavk ∙ CCostt), the non-energy-related changes in operating expenses and maintenance costs (e.g. shorter maintenance intervals) OPEXk, and the capital costs CAPEXk, t , producing the equation:
CFk, i, t = (FlSavk ∙ FlCostt + ElSavk ∙ ElCostt +
CSavk ∙ CCostt – OPEXk + CAPEXk, t) ∙ Capi .
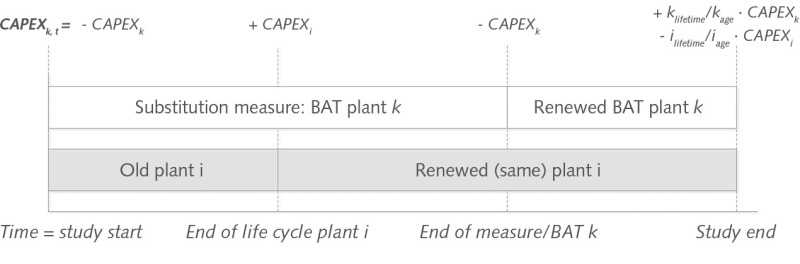
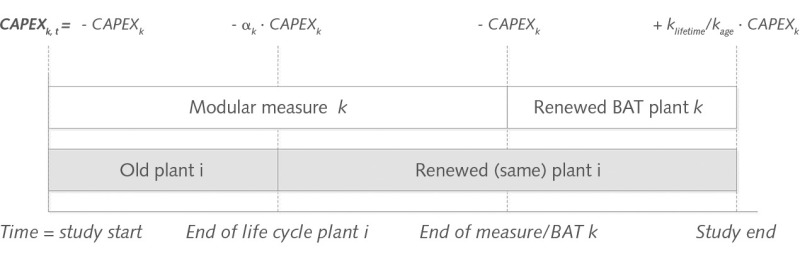
In the case of capital costs, a distinction is made between the replacement of a plant with best available technologies (BAT) or modification by equipment retrofitting. In the first case, the costs for keeping the existing plant (e.g. higher maintenance costs, modernization, new linings) are set off against the capital costs for BAT (Fig. 5).
Measures that involve retrofitting equipment in the existing plant are additionally weighted with the factor αk. This factor represents the interlinkage of a measure and the plant, and is intended as a means of ensuring a company-oriented perspective in the investigation. It takes account of the fact that the retrofitting of equipment in older plants involves an additional risk premium, and also that the implementation of efficiency measures is normally postponed until the next modernization project is carried out. The factor αk always comes to bear when the plant concerned has to be relined at the end of its service life (Fig. 6).
In the second step, the annual payment streams CFk, i, t are discounted with an assumed interest rate r (15 % in the basic scenario) and totalled over the period under consideration (here 2013 to 2035), in order to obtain the capital value NPVk, i of a measure for a plant:
tEnde
NPVk, i = ∑ CFk, i, t ∙ (1 + r)- t + tStart
t = tStart
In the third step, the marginal reduction costs MECCk of a measure k are calculated by weighting the sum of the capital values of all plants N with an annuity factor
(1 + r)m ∙ r
ANFr, m = (1 + r)m – 1
and set in relationship to the achieved savings ESavk:
∑i e N NPVk, i ∙ ANFr, m €2013
MECCk = ESav [ GJ ].
3 Marginal cost curves
3.1 Marginal cost curves for fuel saving
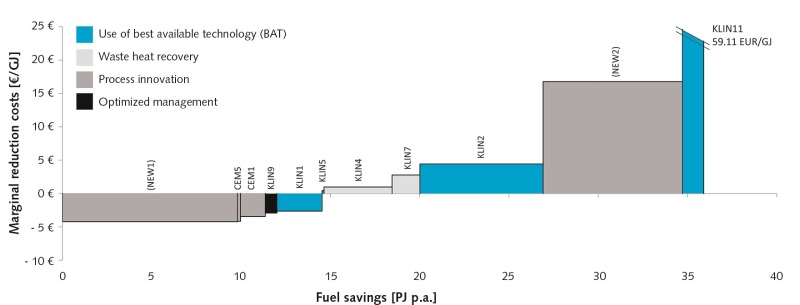
Using the described method, the marginal cost curves for fuel saving in the German cement industry were calculated for the year 2013, initially on process level (Fig. 7). The process view is appropriate for comparing the measures with one another and for evaluating them. It has to be noted that the x-axis of the process view does not reflect the total savings potential (section 2.1). All the measures plotted to the left of the point of intersection of the cost curve tend to be cost effective, but a full evaluation of the total effectiveness requires addition of the area.
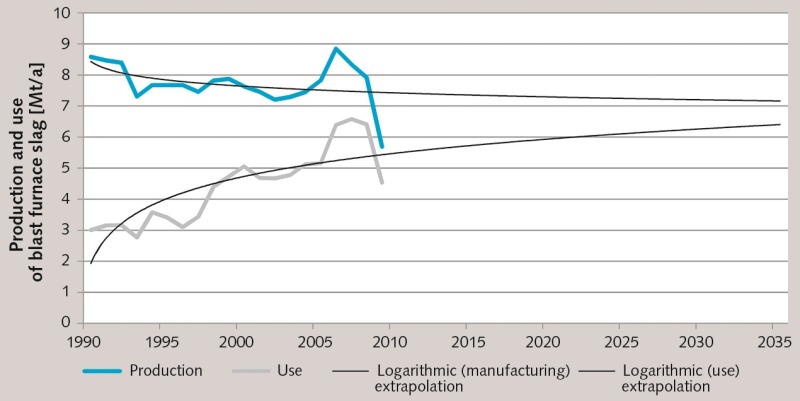
It is clear that the development of new types of cement, such as Celitement (NEW1), would be among the most effective measures by far, if they were commercially available. As both NEW1 and NEW2 are radical process innovations, they are initially not taken into account for consideration of the savings potential. Because of their assumed comparatively high capital costs and maintenance expenses, rotary kilns with fluidized bed firing systems (NEW2) achieve comparatively poor results (Tab. 2). Of the available measures, replacing Lepol kilns with BAT (KLIN1) and increasing the proportion of granulated blast furnace slag (CEM1) are found to be especially cost-effective. It must be mentioned at this point that the remaining usage potential of blast furnace slags was limited to an average of 420 kt p.a. because of many uncertainties and economic reciprocal effects with the iron and steel industry (Fig. 8 and Tab. 2). With the given prices in the basic scenario, changing over from satellite coolers to modern grate coolers (KLIN4) and the retrofitting of precalciners in rotary kiln systems with cyclone preheaters (KLIN2) are not cost-effective, although in sum they promise large savings of 5.93 and 3.06 PJ p. a. The amalgamation of kiln lines or doubling the kiln capacity to 6,000 tonnes per day (KLIN11) is only cost-effective if the existing cement plant has reached the end of its service life. In 2013, this was not the case in any cement plant, partly because of the very long life expectation of such plants (cf. CSI/ECRA 2009), and this led to high marginal costs.
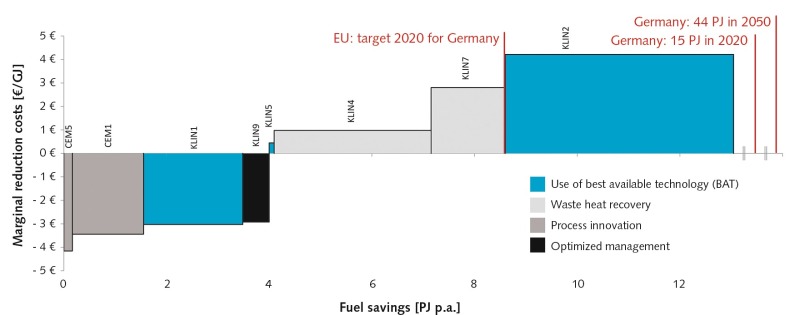
Following the described method on the plant level (section 2.1), the adopted solution in the case of competing measures is to implement the measure with which the highest capital value can be achieved. This inevitably leads to a reduction in the savings potential and an improvement in the cost effectiveness of the measures. Nevertheless, the prices assumed for the basic scenario do not suffice to push measures that promise large savings, such as KLIN4 or KLIN2 into the cost-effective range. The total savings potential is, after all, achieved via the x-axis, with the point of intersection representing the economic fuel savings potential of 4.00 PJ p.a. or 5.2 % of the fuel requirement in the year 2010 (cf. Fig. 9). Through the area of the measures to the left of the point of intersection, annual cost savings amounting to € 12.8 million can be calculated for the entire cement industry. Considering the political objectives, the EU Energy Efficiency Directive specifies annual savings of 1.5 % between 2014 and 2020. Related to the fuel consumption of the cement industry, this means a reduction of 7.15 PJ per year. In comparison to the economic savings potential, the measures KLIN5 and KLIN4 must be additionally implemented, which would involve an additional cost burden of just under € 3 million p.a. The energy concept of the German Federal Government has set ambitious targets and demands, as a first step, that up to the year 2020 the primary energy consumption must be reduced by 20 % compared to the 2008 figure.
On the basis of DESTATIS (2010) and under consideration of the Pehnt et al. (2012) primary energy factors, an ultimate energy saving of 17.78 PJ is obtained, of which 14.95 PJ would have to be achieved by means of fuel savings. However, with the measures investigated here, and without consideration of economic factors, a maximum of 14 PJ could be saved – and even this would involve additional costs of € 25.8 million p.a. (Fig. 9). The objective of the German Federal Government for the year 2050 would correspondingly demand a 43.7 PJ reduction in ultimate energy consumption, but it is not possible within the scope of this investigation to state the additional costs that this would involve. One fundamental point must still be mentioned: due to the focus on primary energy consumption, substantial reductions can be achieved through the increased use of secondary fuels (FUEL1), as these show very low primary energy factor (e.g. 0.11 to 0.13, cf. Pehnt et al., 2012). In a consideration of the final energy consumption this factor is not taken into account (cf. 3.3).
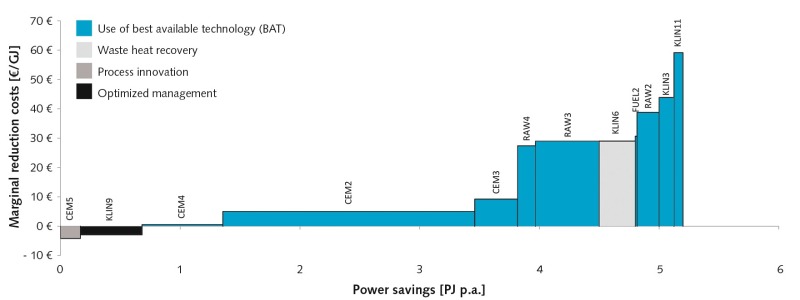
3.2 Marginal cost curves for power saving
The power-saving potential is considered separately in order to do justice to the special importance of this energy source with respect to both its exergy and its price (Fig. 10). As is also the case with the consideration of fuels, the process view is used, in order to evaluate the effectiveness of measures. The application of modern process control systems (KLIN9), which continuously monitor the chemical composition of the raw material and the product, thereby achieves the highest total effectiveness, closely followed by increasing the proportion of fly ash (CEM5). In contrast to the use of granulated blast furnace slag (see Section 3), fly ash needs hardly any grinding and additional power consumption savings are achieved (Tab. 2). The usage potential for fly ash is also limited and, due to the uncertainty caused by its dependence on the existence of coal-dust firing systems, is assessed as 250 kt p.a. (cf. Backes et al. 2011). Although the improved grading of grinding media (CEM4) is assessed as just failing to achieve cost-effectiveness at 0.49 €/GJ, it does contain the second largest savings potential of 0.68 PJ p.a. The competing measure CEM2 (application of vertical mills for cement grinding) has the greatest potential with 2.10 PJ p.a., but is not cost-effective at the existing electricity prices with marginal reduction costs of 4.95 €/GJ, or 1.78 ct/kWh respectively. The use of mechanical conveyor systems (RAW3) avoids the inefficiencies associated with air compression and saves 0.53 PJ p.a.. However, this measure involves comparatively high capital costs (Tab. 2) and fails to achieve a positive capital value in any plant.
On the plant level, competing measures are taken into consideration and selected in accordance with the higher capital value (see Section 2). In the case of vertical mills used for cement grinding (CEM2) and improved grinding media grading (CEM4), the latter measure predominantly achieves lower marginal reduction costs and thus pushes out CEM2 in some plants. The power-saving potential of the measure thus falls from 2.00 to 1.30 PJ p.a.. The savings potential of low-pressure-drop cyclone preheaters (KLIN3) is also reduced by 0.10 PJ p.a. by the development of cyclone preheater stages (KLIN7) that are already equipped with the low-pressure-drop technology. The combining of kiln lines (KLIN11) is completely pushed out by all kiln-related measures (KLIN1-10). Ultimately, the point of intersection shows the economic power saving potential and values this in the basic scenario as 0.68 PJ, which is approximately 5 % of the electrical power requirement of the cement industry in 2010 (cf. DESTATIS 2010). The annual cost savings of the entire industrial sector amount to € 2.19 million.
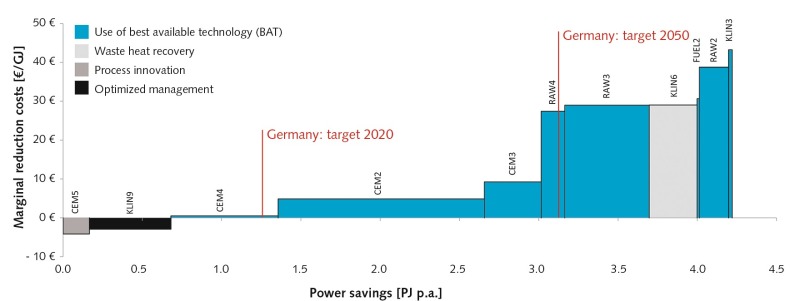
However, if it is assumed that the required power saving of 25 % by 2050 has to be achieved by equal contributions by all sectors of industry, the German cement industry would have to save 3.1 PJ of electricity compared to the 2008 figure (Fig. 11 and cf. BMU 2010; VDZ 2011). If this objective had to be achieved right now, all the measures up to and including raw meal homogenizing using force of gravity silos (RAW4) would have to be implemented. The measures CEM4, CEM2, CEM3 and RAW4 are, however, not cost-effective in the basic scenario and would cause additional costs of almost € 14 million p.a. for the whole industrial sector. By contrast, the planned reduction of 10 % by 2020, which corresponds to approximately 1.24 PJ, can be achieved comparatively easily with € 0.33 million p.a. by additionally implementing the improved grinding media (CEM4).
3.3 Marginal CO2 reduction cost curves
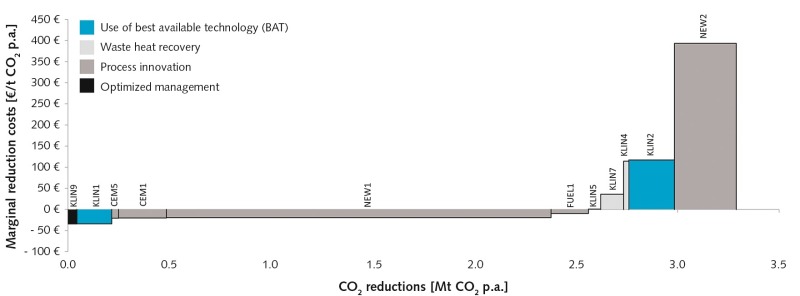
A welcome side effect of the implementation of fuel saving measures in particular is the reduced emission of CO2. In order to ensure that the cost evaluation of the measures takes account of the reduced costs for purchasing CO2 certificates (section 2.3.2), the CO2 savings were also quantified. We deliberately refrained from examining measures that are aimed at CO2 sequestration because of their questionable cost effectiveness and energy efficiency. With the exception of measures NEW1 and FUEL1, the CO2 reductions listed here are achieved purely by reducing the fuel requirement.
The development of new types of cement (NEW1), such as Celitement (cf. Stemmermann et al. 2010), is mentioned here as a measure because CO2 can be reduced not only by lowering the thermal conditions, but also in the clinker burning process itself. Alone the latter could lead to a reduction of 231 kg CO2 per tonne of clinker (Tab. 2). A comparison of the measures shows that CEM1 alone could save more CO2 than all the other measures combined (Fig. 12). However, this savings potential is subject to the assumption that Celitement only completely substitutes the annual demand quantity of the comparable cement type CEM I.
The use of secondary fuels (SF) also has a special position. For mainly economic reasons, approximately 60 % of the average thermal energy requirement in Germany is met through the use of SF. SF is mainly made up of industrial and commercial wastes, but also includes a certain proportion of biomass (VDZ 2012b). Under purely energetic considerations, the use of SF can negatively influence the specific energy consumption, because more fuel materials with a low calorific value are used per tonne of clinker (CSI/ECRA 2009). However, in accordance with the understanding of energy efficiency forming the basis of this study (see energy efficiency box), avoiding the use of fossil raw materials still contributes to an increase in energy efficiency in spite of a higher specific energy consumption. This effect is difficult to represent in an energy saving marginal cost curve, and for this reason the focus is placed here on CO2 reductions. The amounts of biogenic material in SF that meet the sustainability criterion of the EC (2012), are evaluated as climate-neutral by the EU ETS and therefore do not have to be covered by the corresponding purchase of CO2 certificates. Because of the increasing competition for use of these materials, the absolute available quantity of biomass was kept constant for the period of time 2013 to 2035. If the employed proportion of SF is increased to 80 % (FUEL1) in all German plants, the climate-neutral biomass would lead to a CO2 reduction of 180,000 t p.a. Of the remaining measures, KLIN1 and CEM1 are found to be also very effective for CO2 reduction, analogously to the fuel savings.
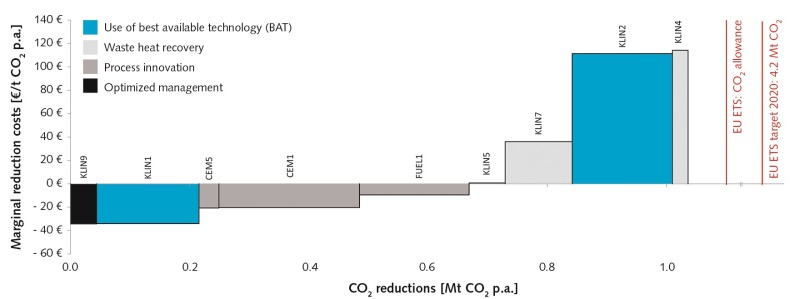
On the plant level, future measures (NEW1 and NEW2) are not taken into account for evaluation of the economic savings potential (Fig. 13). Due to the precedence of more cost-effective measures, a change in the order of marginal costs also takes place, as in the examples of KLIN2 and KLIN4. The economic CO2 reduction potential in the basic scenario thus amounts to 0.67 million t of CO2 p.a., which approximately makes up 3.4 % of the CO2 emissions in 2010. At the assumed prices, the economic measures would lead to an annual saving of € 14 million. On the basis of an average CO2 emission rate of 0.81 t CO2/t clinker, an additional 1.09 million t of CO2 would have to be saved in order to enable the achievement of the CO2 exemption level of 0.766 t CO2/t clinker – equally distributed over all German plants. This cannot be achieved with the investigated measures.
The maximum reduction potential, which includes measures in the cement manufacturing process that have no influence on the emissions, amounts to 1.04 million t CO2 p.a. and in comparison to its economic potential would generate additional costs amounting to € 25.80 million p.a..
It is also impossible to achieve the objectives of EU ETS by 2020 with reductions of 4.21 million t CO2 and by 2030 with reductions of 7.7 million t CO2 with the investigated measures. The objective for 2030 would result in specific CO2 emissions of just under 0.5 t CO2/t clinker, and would be below the objective of the World Business Council for Sustainable Development of 0.56 t CO2/t clinker by 2030 (cf. WBCSD and IEA 2009).
Überschrift Bezahlschranke (EN)
tab ZKG KOMBI EN
This is a trial offer for programming testing only. It does not entitle you to a valid subscription and is intended purely for testing purposes. Please do not follow this process.
This is a trial offer for programming testing only. It does not entitle you to a valid subscription and is intended purely for testing purposes. Please do not follow this process.
tab ZKG KOMBI Study test
This is a trial offer for programming testing only. It does not entitle you to a valid subscription and is intended purely for testing purposes. Please do not follow this process.
This is a trial offer for programming testing only. It does not entitle you to a valid subscription and is intended purely for testing purposes. Please do not follow this process.