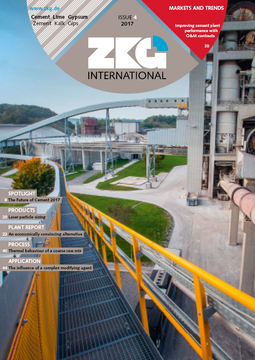
Improving cement plant performance with O&M contracts
 HeidelbergCement
 LafargeHolcim Foundation
 CRH
CRH
 OneStone Research
 OneStone Research
 OneStone Research
 OneStone Research
 OneStone Research
 OneStone Research
 VDZ
VDZ
 VDZ
VDZ
 ECRA
ECRA
 Loesche
 CII
CII
 OneStone Research
 thyssenkrupp Industrial Solutions
 FLSmidth
Decreasing capacity utilization rates and financial constraints are reasons for the ongoing performance improvements of cement plants. However, when technical solutions are getting more complex and when operational know-how is limited, O&M contracts can be the solution. This article will look at this approach more closely.
1 Introduction
Cement plants differ in plant age, size, technology, automation, fuel supply, operational and maintenance requirements and other issues. Generally, more CapEx is spent on the latest technology (Figure 1), to reduce operational and maintenance costs. Sometimes it is very difficult to compare individual plants. Plants with several kiln lines (Figure 2), which use identical raw materials, can compare the efficiency of the individual kiln lines more effectively than an isolated plant with just one kiln line. The best performing plants often perform best in only one or two parameters,...
1 Introduction
Cement plants differ in plant age, size, technology, automation, fuel supply, operational and maintenance requirements and other issues. Generally, more CapEx is spent on the latest technology (Figure 1), to reduce operational and maintenance costs. Sometimes it is very difficult to compare individual plants. Plants with several kiln lines (Figure 2), which use identical raw materials, can compare the efficiency of the individual kiln lines more effectively than an isolated plant with just one kiln line. The best performing plants often perform best in only one or two parameters, while they perform averagely in others. Cement producers with several plants and several kiln lines in these plants are very knowledgeable about these issues.
The awareness and identification of best available technologies (BAT) and best practices is necessary to assess and compare the performance of a cement plant and to identify gaps and possible solutions for improvement. There are cement producers, who have identified more than 50 key performance indicators (KPI) for their plants. However, when it comes to cost categories, some of the most discussed parameters are capacity utilization, clinker factor, alternative fuel rate, specific thermal energy demand, specific electricity consumption and the overall operational & maintenance (O&M) costs. Without monitoring the key parameters it is difficult to maintain and sustain benefits. Some of the parameters can only be obtained from process audits with a detailed analysis of individual performance indicators.
Kiln lines tend to become unstable or unbalanced over time [1]. When the plant is commissioned and the guarantee parameters are achieved the individual set points for the plant are fixed. But when the plant ages, the raw material composition and moisture change, the fuel mix changes and when mill throughputs or fineness change due to wear, then the set points have to be adjusted. If for example the fineness of the raw material has to be reduced due to throughput constraints, the fuel consumption of the kiln will increase. Empirical studies show that each additional 1 % residue of raw material fineness above the target of 12 % on the 90 µm screen will result not only in a lower power requirement for the mills but also in about 20-40 extra MJ/t clinker in fuel demand for the kiln [2].
The performance of a cement plant depends on these individual parameters. Without a good understanding of the different processes it becomes difficult to adequately optimize the cement production process. There are many inter-relationships of the process parameters. An optimization of the plant’s throughput must not be the energy optimum or vice versa. And there are a lot of other parameters, which could have their own optimum, such as the cement quality, the plant availability, a maximum use of alternative fuels, lowest maintenance or the environmental impact of the plant at the rated or given capacity. Furthermore an individual optimization can be achieved for the different plant sections from the quarry to the cement storage and distribution. It is important to find the right mix.
2 Selected cement producer KPIs
Globally, cement capacity and clinker capacity utilization rates have declined in the last few years, because capacities were growing faster than demand [3]. Some of the largest Chinese companies such as CNBM and Sinoma only achieved cement capacity utilization rates of 62.8 % and 72.0 %, while those of the Western peers LafargeHolcim, HeidelbergCement and Cemex were 68.4 %, 72.0 % and 71.0 %, respectively (Figure 3). In the regions and countries capacity utilization of the leading companies differs widely. For example, in 2015, HeidelbergCement achieved capacity utilization rates of between 58.5 % (Eastern Europe-Central Asia) and 95.3 % (North America) in its regions (Figure 4), excluding Joint-Ventures, incl. clinker deliveries.
Declining capacity utilization increases the pressure on the cement producers and with growing financial constraints, energy savings, higher alternative fuel rates and a reduction of the clinker content in cement become an issue. The development of the clinker factor by leading cement producers is illustrated in Figure 5. LafargeHolcim is achieving the lowest clinker factors, although in the last few years the factor has been difficult to improve. This is also a result of the asset disposals that had to be made because of the LafargeHolcim merger. CRH improved significantly after the acquisition of more than 35 Mta capacity disposed of by Lafarge and Holcim. Votorantin also significantly improved their performance, while Cemex was not able to continue the trend of lower clinker factors.
The alternative fuel rates for the cement industry have not generally increased in the last few years (Figure 6). This has to do with availability problems and the costs of the alternative fuels in comparison to conventional fuels and petcoke. From 2010 to the summer of 2016 the coal prices largely declined to just 50 US$/t. In many countries petcoke even achieved a significant discount of more than 20 % compared to coal. There are many examples of cement producers massively improving their petcoke fuel rate, while the alternative fuel rate stagnated. However CRH is now the leading producer with 33.9 % alternative fuel rate, followed by Cemex and HeidelbergCement. LafargeHolcim fell behind, due to the disposal of assets with high alternative fuel rates in Europe and a consolidation of assets in India and elsewhere with low alternative fuel rates.
The efficiency of clinker production lines can still be analyzed from the fuel consumption (Figure 7), which is normally given in MJ/t of clinker. However, when it is related to the tons of cementitious products it can be divided by the clinker factor in percent. From the cement producers here under review LafargeHolcim and CRH achieve the best average thermal efficiencies with about 3500 to 3600 MJ/t clinker. HeidelbergCement and Cemex are significantly above these figures and Votorantim is still above 4200 MJ/t clinker (3095 MJ/t cementitious products and 73 % clinker factor). In the thermal efficiencies of the companies’ plants no significant improvement can be seen. On the contrary, the thermal efficiencies decline. One reason might be the higher alternative fuel rates, which reduce the thermal efficiencies of the plants. However, it is also possible that the plant performance was not adequately managed.
A similar development can be seen in the specific consumption of electrical energy of the cement plants (Figure 8), which is normally based on the kWh per ton of cement respectively cementitious products. The figures for LafargeHolcim, HeidelbergCement, Cemex and Votorantim (CRH did not give any figures in their 2015 Sustainability Reports) show that the specific kWh demand stagnated or even increased. However LafargeHolcim has significantly lower figures than HeidelbergCement, Cemex and Votorantim. The lower figures relate especially to a higher share of advanced cement grinding systems (vertical roller mills/roller presses, when compared to ball mills) and the energy optimization of ball mills (Figure 9). On the other hand slag cements require a higher fineness and much higher energy demand for grinding than standard Portland cements.
3 Selected initiatives in a
plant-to-plant comparison
For many years, the Research Institute of the German Cement Producer Association (VDZ) has been supporting cement producers with a number of services. Figure 10 shows a simulation of the specific thermal energy requirement of three different sizes of modern kiln systems with precalciner technology [4, 5]. The reference plant is a 3000 tpd kiln system with a 5-stage cyclone preheater, in which the performance test shows a heat requirement of 3026 MJ/t clinker when using coal dust as fuel. With each kiln stop and larger process fluctuations the efficiency decreases and in “real” plants only a yearly average of 3180 to 3340 MJ/t clinker can be achieved. The larger the plant is the more the heat requirement can be reduced. A 5000 tpd plant reduces the reference value to below 3000 MJ/t clinker.
The reference value for the heat requirement also depends on the number of cyclone stages and other process parameters. A 6-stage cyclone system, which is suitable for raw material moisture contents of up to 6 % will reduce the heat requirement to 2965 MJ/t clinker (performance test), while a 10 % bypass increases the heat requirement to 3400 MJ/t clinker. Finally, a big influence comes from the fuels used. Figure 11 provides the results for coal dust and lignite and various coal dust substitution rates for alternatives fuels with a calorific value of 20 MJ/kg, compared to coal dust with 27 MJ/kg. In the case of 100 % substitution the heat requirement increases to almost 3500 MJ/t clinker for the 3000 t/d reference plant. However it has to be noted that some alternative fuels with higher calorific value could also achieve lower heat consumption rates for the kiln.
The European Cement Research Academy (ECRA) is for example providing figures for state-of-the-art cement technology [6]. The average electric energy demand of the cement production process is given in Figure 12. Grinding processes consume most of the power and accordingly grinding technology has a major impact on the total electricity demand. Especially in clinker/cement grinding a huge amount of energy can be saved with vertical roller mills (VRM, Figure 13), high pressure grinding rollers (HPGR) and Horomills, when compared to conventional ball mills. The large population of ball mills also offers possibilities for energy savings as demonstrated by the ball mill initiative of LafargeHolcim [7] and other cement producers. Modern grate cooler technology offers potential for thermal fuel savings, but can also increase the demand for electric power by the fans for cooling air.
The Confederation of Indian Industry (CII) collected data about the energy performance of Indian cement plants and published a working manual about the findings [8]. The data was derived from the filled-in questionnaires of a large number of cement factories. The collected data is classified in different sections. For each section best practices are given and in total more than 300 best practices are listed. Figure 14 contains the specific heat requirement of the 10 best identified cement plants with 5-stage cyclone preheaters in India. The plants, which have cement capacities from 1.0 to 8.6 million annual tons (Mta) require heat balances from just 2958 to 3088 MJ/t clinker and probably comprise capacity which is less than 10 years old. Generally more than 50 % of the Indian cement capacity is less than 10 years old.
The United States Environmental Protection Agency (EPA) published a review about “Energy Efficiency Improvement and Cost Saving Opportunities for Cement Making” with a large number of aspects and recommendations [9]. In the USA cement plants can apply for an Energy Star certification, an indication that a plant’s energy performance is within the top quartile of energy performance for the industry. The Energy Star EPI scores cement plants on a scale of 1 to 100, with 100 being the highest level of performance. Plants that achieve 75 scores and more receive the certificate. Plants that score between 1 and 50 are candidates for investment and upgrades, while plants scoring between 50-75 may benefit from improved operating conditions. Since certification was first offered to the cement industry in 2006, EPA has issued 51 cement plant certifications. In 2015 a total of 28 plants received the award.
4 O&M contracts for plant
performance improvement
At the moment 10 O&M and TPM (Technical Plant Management) contracts for cement kiln lines are in place covering 23 kilns in Europe, North Africa and the Middle East. This is the result of a market study [10], which will be released soon. The first contract was awarded in 1987 to ASEC for technical assistance at two 3300 kiln lines in Egypt. At that time the cement market was rapidly growing and there was a lack of skills and no adequate personnel in Egypt. Up to now a total of 57 major O&M and TPM contracts for kiln lines have been awarded. Additional contracts have been awarded for grinding and packing plants as well as captive power plants, waste heat recovery (WHR)-systems and other equipment. Some of the O&M contracts have been running for more than 15 years having been renewed every five years, while some contracts were terminated after a short time.
There are different options available for operating and maintenance services. Basically, three different levels of involvement by the contractor can be differentiated (Figure 15). The smallest external involvement is, when the contractor is providing technical plant assistance (TPA) such as operational support and optimization services. In this case the plant owner has his own employees running the plant under the advice of the contractor. At the next level technical plant management (TPM) is provided, which means that the contractor provides experienced staff of several disciplines, including preventive maintenance, managing the plant and the owner’s team with full responsibility for the plant operation and maintenance. At the full O&M level, the contractor is providing all services for the operation and maintenance of the plant, including the responsibility for spares and “debottlenecking”.
The target is always to achieve mutual benefits for the plant owner and O&M contractor by increasing the availability and reliability of the plant with optimized maintenance (Figure 16), decreased energy consumption and improved performance. In full-service contracts the O&M contractor and plant owner have completely different responsibilities. While the plant owner is responsible for the raw materials, fuels, utilities, permits, marketing and selling, the O&M contractor manages, operates and maintains the plant, supplies consumables and spares and is responsible for know-how transfer and training. O&M contracts are either typically for the start-up of cement plants with a period of 6 to 12 month to achieve a rapid production ramp-up after plant commissioning or for 5-year periods for improving and maintaining the performance of the plant through adequate plant management and optimization.
The price and payment models for O&M contracts differ widely and not only depend on the support level but also on the service period, performance guarantees and the cement or clinker price per ton (PPT). For example FLSmidth offers its O&M services on a monthly fee or PPT-basis, including bonuses/penalties on production, energy consumption and other targets (Figure 17) [11]. The benefit for the plant owner is the reduction of fixed costs and operational risks. This is especially useful for companies and new investors who have no adequate personnel to operate a plant competitively or for established cement producers who want to reduce fixed costs and maximize cash flows. The number of service providers has increased in the last few years, as O&M services offer a large market potential and high margin income, when compared to engineering services.
5 Outlook
The outsourcing of O&M and TPM (Technical Plant Management) is the trend and it is interesting that the market is shifting from countries in emerging markets to countries in mature cement markets. One reason is that established cement producers recognize the benefits of outsourcing to reduce fixed costs. Another reason is that the service providers, which are mainly the large cement plant engineering groups, have increased their know-how with service contracts and are able to provide to their clients significant cost benefits. The advantage/disadvantage could be that cement companies lose their own know-how about how to operate and optimize their plants, while the engineering companies or service providers generate additional income. However, there are enough examples from other process industries such as mining that these models provide win-win situations for plant owners and suppliers.
//www.onestone.eu" target="_blank" >www.onestone.eu:www.onestone.eu
Überschrift Bezahlschranke (EN)
tab ZKG KOMBI EN
This is a trial offer for programming testing only. It does not entitle you to a valid subscription and is intended purely for testing purposes. Please do not follow this process.
This is a trial offer for programming testing only. It does not entitle you to a valid subscription and is intended purely for testing purposes. Please do not follow this process.
tab ZKG KOMBI Study test
This is a trial offer for programming testing only. It does not entitle you to a valid subscription and is intended purely for testing purposes. Please do not follow this process.
This is a trial offer for programming testing only. It does not entitle you to a valid subscription and is intended purely for testing purposes. Please do not follow this process.